| Param | Original file | Final file |
|---|---|---|
| Filename | modeM0/AS1A14_066T02_9000006546_55943cztM0_level2.fits | modeM0/AS1A14_066T02_9000006546_55943cztM0_level2_quad_clean.evt |
| Size (bytes) | 400,985,280 | 103,852,800 |
| Size | 382.4 MB | 99.0 MB |
| Events in quadrant A | 3,273,723 | 676,936 |
| Events in quadrant B | 3,194,988 | 720,546 |
| Events in quadrant C | 3,938,457 | 631,292 |
| Events in quadrant D | 3,871,876 | 611,664 |
| Mode M9 | |||
|---|---|---|---|
| Quadrant | BADHDUFLAG | Total packets | Discarded packets |
| A | 0 | 6 | 0 |
| B | 0 | 6 | 0 |
| C | 0 | 6 | 0 |
| D | 0 | 6 | 0 |
| Mode M0 | |||
|---|---|---|---|
| Quadrant | BADHDUFLAG | Total packets | Discarded packets |
| A | 0 | 15224 | 1 |
| B | 0 | 15100 | 1 |
| C | 0 | 17105 | 1 |
| D | 0 | 16853 | 1 |
| Mode SS | |||
|---|---|---|---|
| Quadrant | BADHDUFLAG | Total packets | Discarded packets |
| A | 0 | 146 | 0 |
| B | 0 | 146 | 0 |
| C | 0 | 146 | 0 |
| D | 0 | 146 | 0 |
| Quadrant | Total seconds | Saturated seconds | Saturation percentage |
|---|---|---|---|
| A | 7245 | 52 | 0.717736% |
| B | 7245 | 78 | 1.076605% |
| C | 7245 | 203 | 2.801932% |
| D | 7245 | 74 | 1.021394% |
Noise dominated data is calculated using 1-second bins in cleaned event files. If a bin has >2000 counts, and if more than 50% of those come from <1% of pixels, then it is considered to be noise-dominated and hence unusable.
| Quadrant | # 1 sec bins | Bins with >0 counts | Bins with >2000 counts | High rate bins dominated by noise | Noise dominated (total time) | Noise dominated (detector-on time) | Marked lightcurve |
|---|---|---|---|---|---|---|---|
| A | 7865 | 7246 | 5 | 5 | 0.06% | 0.07% | 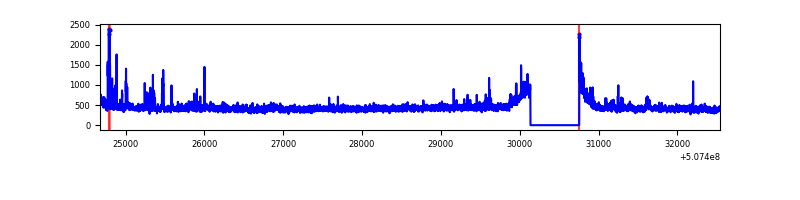 |
| B | 7865 | 7246 | 9 | 9 | 0.11% | 0.12% | 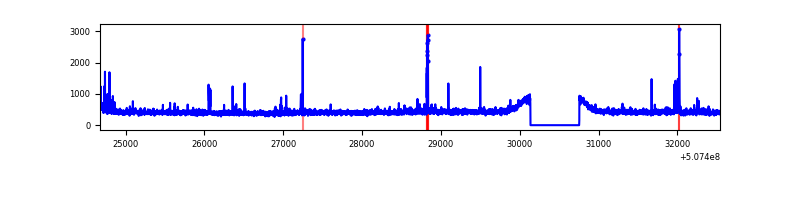 |
| C | 7865 | 7246 | 142 | 142 | 1.81% | 1.96% | 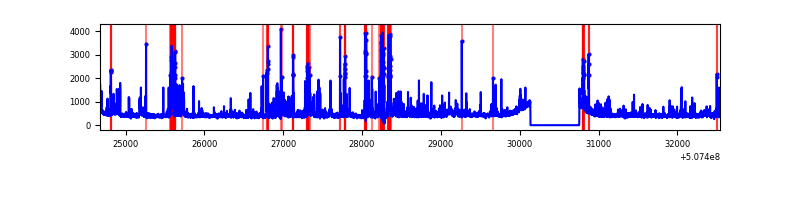 |
| D | 7865 | 7246 | 62 | 62 | 0.79% | 0.86% | 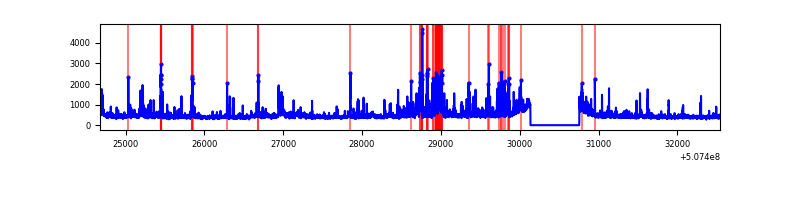 |
Top three noisy pixels from each quadrant. If the there are fewer than three noisy pixels in the level2.evt file, extra rows are filled as -1
| Pixel properties | Quadrant properties | ||||||
|---|---|---|---|---|---|---|---|
| Quadrant | DetID | PixID | Counts | Sigma | Mean | Median | Sigma |
| A | 3 | 14 | 194712 | 1027.88 | 770 | 751 | 188.7 |
| A | 8 | 249 | 30819 | 159.34 | 770 | 751 | 188.7 |
| A | 4 | 3 | 25564 | 131.49 | 770 | 751 | 188.7 |
| B | 9 | 251 | 43795 | 258.67 | 763 | 734 | 166.5 |
| B | 0 | 216 | 39679 | 233.94 | 763 | 734 | 166.5 |
| B | 4 | 21 | 21261 | 123.3 | 763 | 734 | 166.5 |
| C | 12 | 252 | 435922 | 2133.28 | 743 | 738 | 204.0 |
| C | 15 | 199 | 226864 | 1108.47 | 743 | 738 | 204.0 |
| C | 13 | 3 | 184391 | 900.27 | 743 | 738 | 204.0 |
| D | 11 | 129 | 400251 | 1885.23 | 746 | 714 | 211.9 |
| D | 2 | 31 | 116751 | 547.52 | 746 | 714 | 211.9 |
| D | 3 | 12 | 110172 | 516.48 | 746 | 714 | 211.9 |
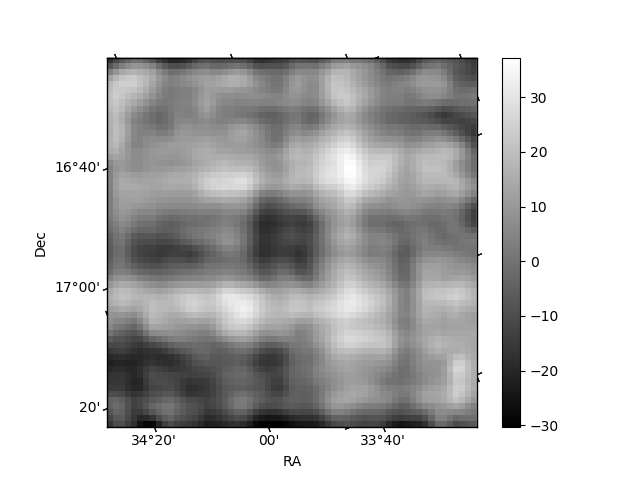
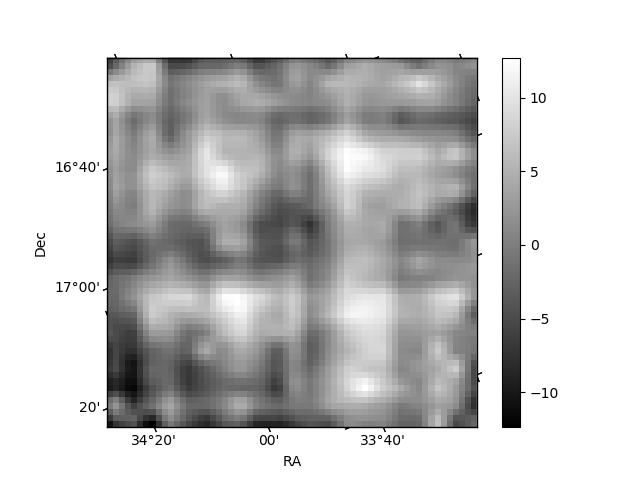
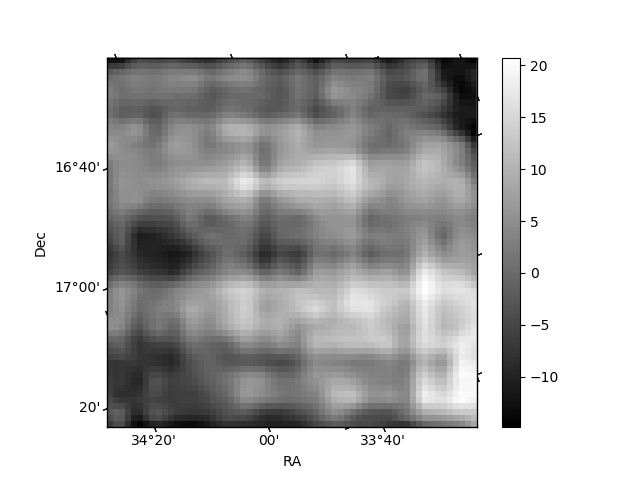
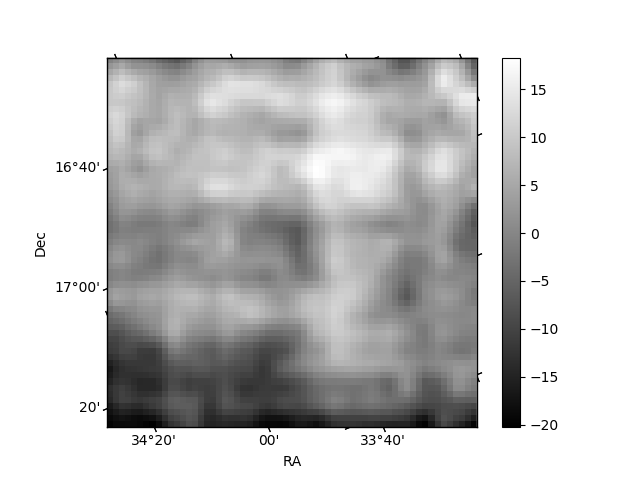
Histogram calculated using DETX and DETY for each event in the final _common_clean file
| Quadrant A | 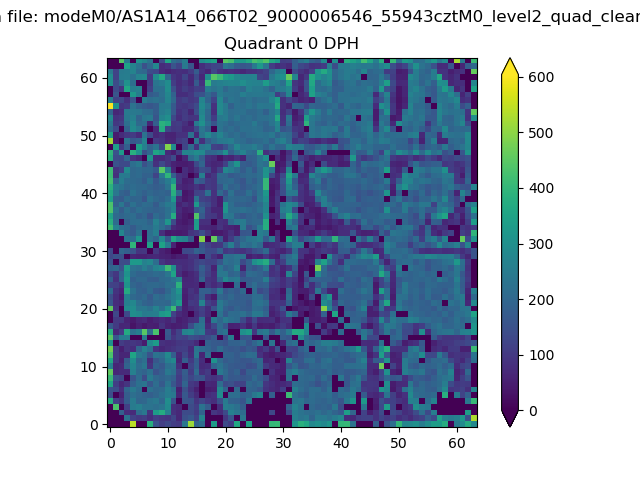 |
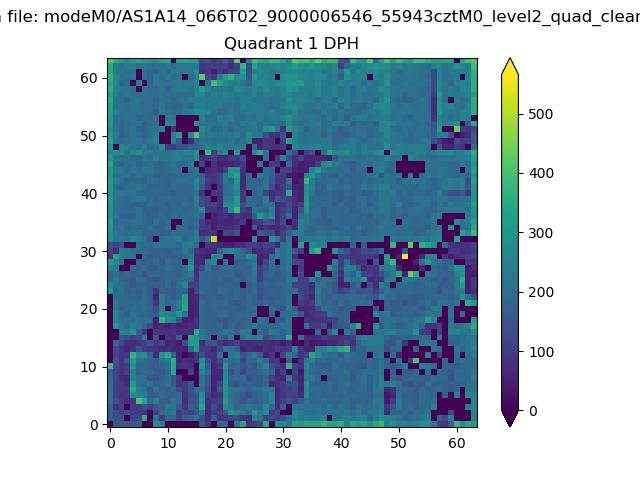 |
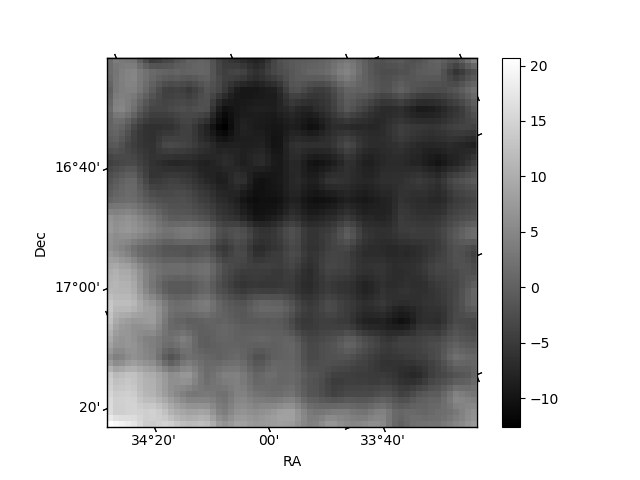
Quadrant B |
|---|---|---|---|
| Quadrant D | 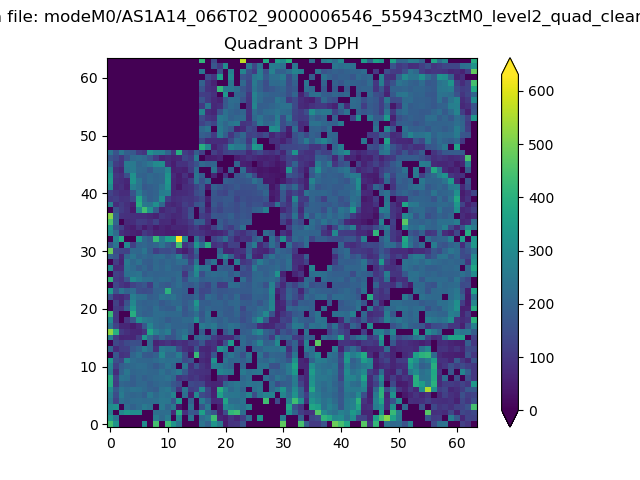 |
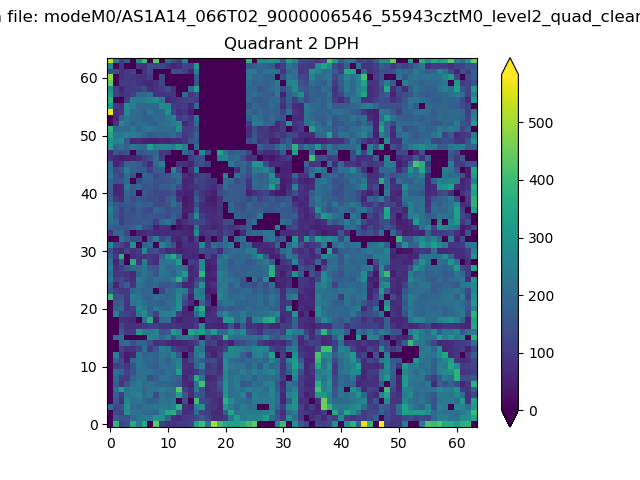 |
Quadrant C |
| Plot type | Count rate plots | Images |
|---|---|---|
| Comparison with Poisson distribution Blue bars denote a histogram of data divided into 1 sec bins. Red curve is a Poisson curve with rate = median count rate of data. |
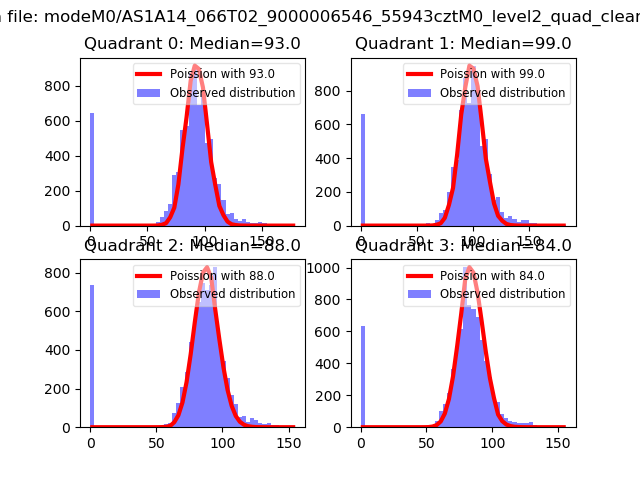 |
 |
| Quadrant-wise count rates Data is divided into 100 sec bins |
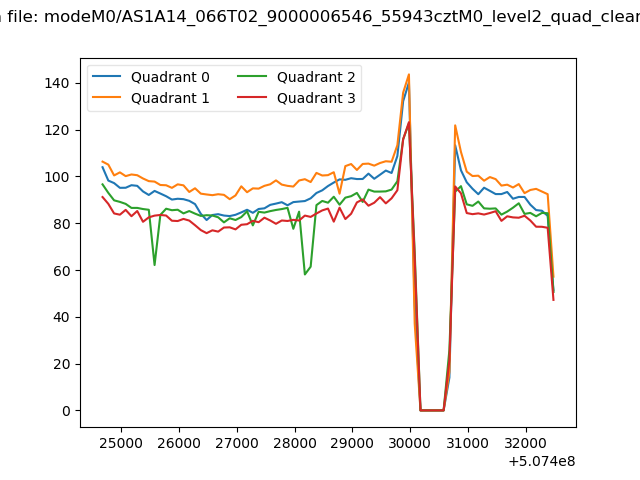 |
|
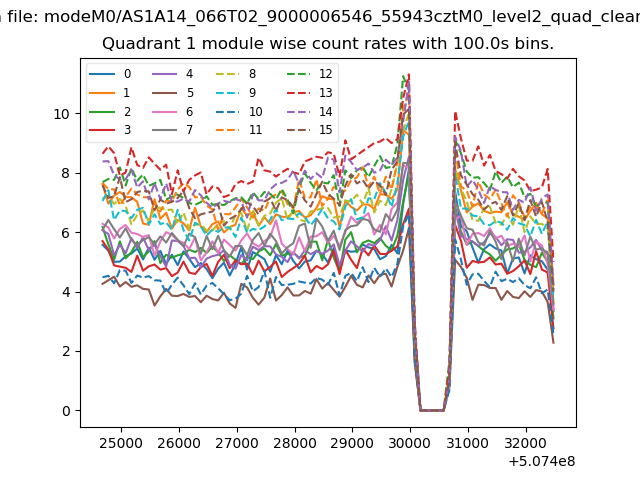
| Module-wise count rates for Quadrant A Data is divided into 100 sec bins |
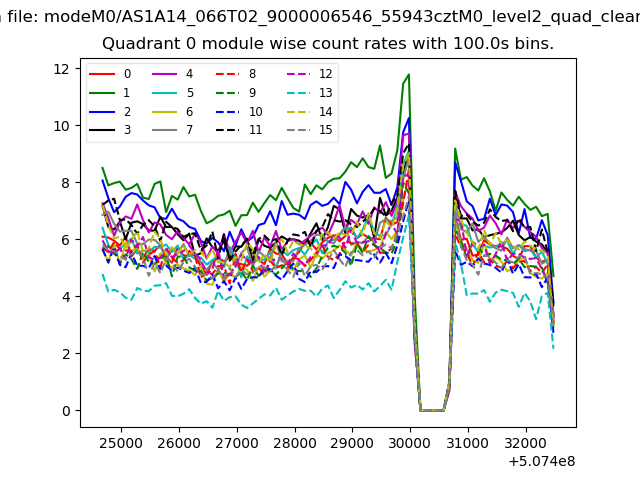 |
 |
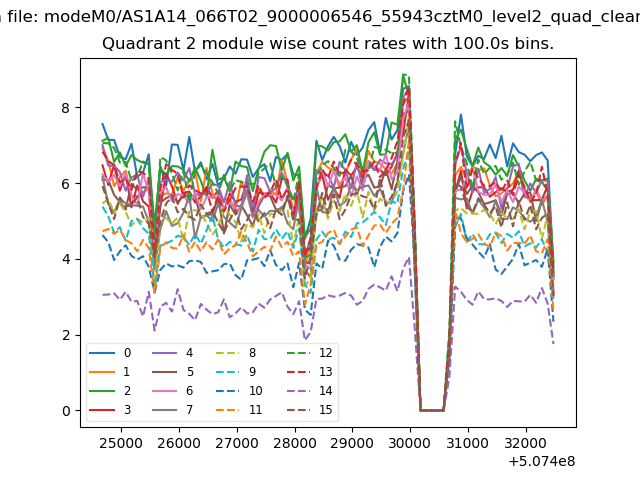
| Module-wise count rates for Quadrant B Data is divided into 100 sec bins |
 |
 |
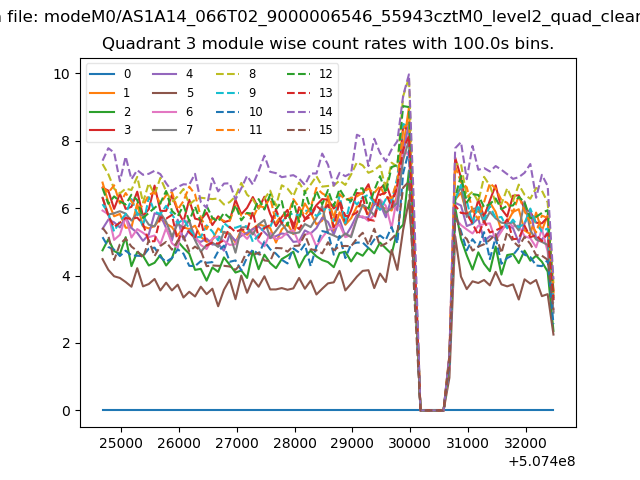
| Module-wise count rates for Quadrant C Data is divided into 100 sec bins |
 |
 |
| Module-wise count rates for Quadrant D Data is divided into 100 sec bins |
 |
 |
| Parameter | Plot |
|---|---|
| CZT HV Monitor | 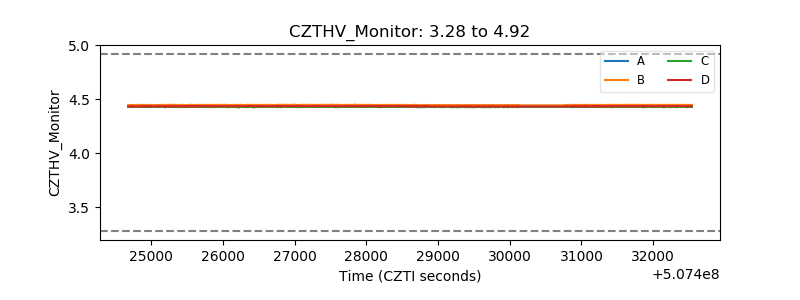 |
| D_VDD | 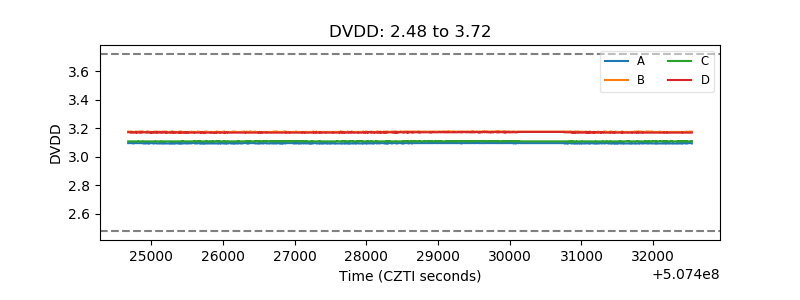 |
| Temperature 1 | 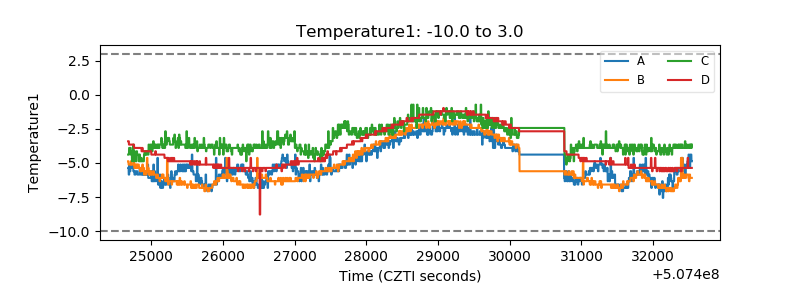 |
| Veto HV Monitor | 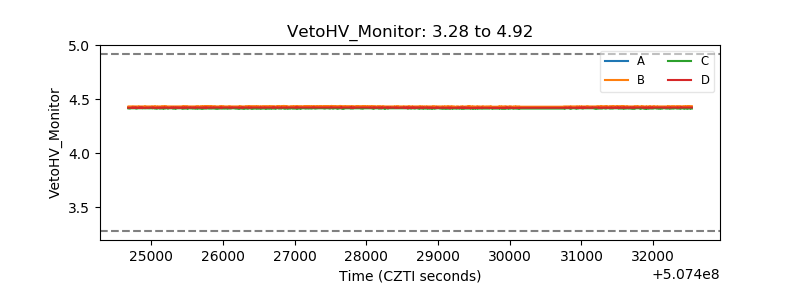 |
| Veto LLD | 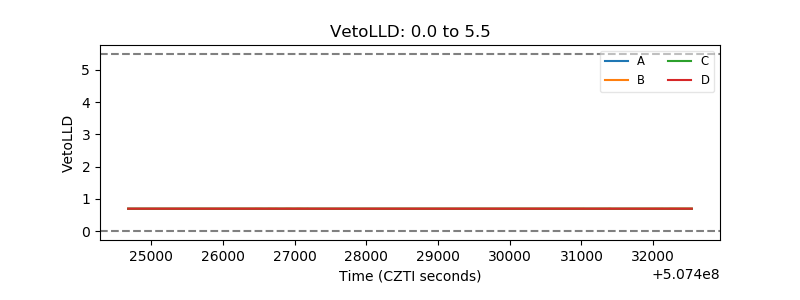 |
| Alpha Counter | 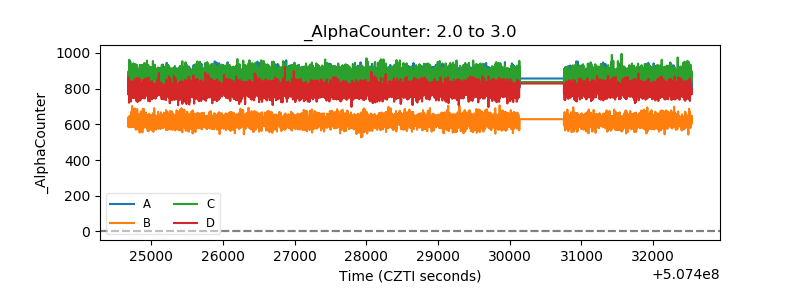 |
| _CPM_Rate | 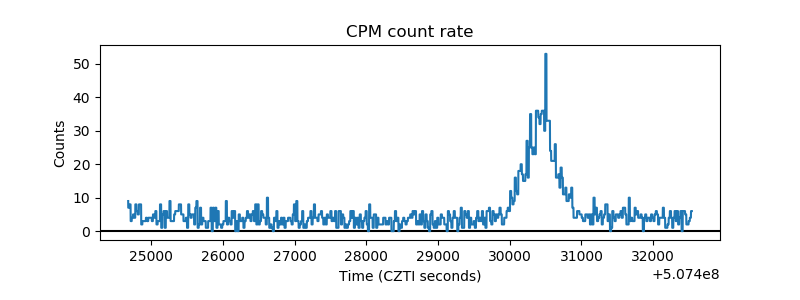 |
| CZT Counter | 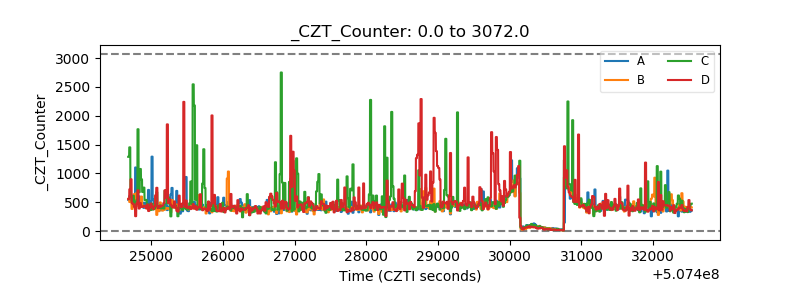 |
| +2.5 Volts monitor |  |
| +5 Volts monitor |  |
| _ROLL_ROT | 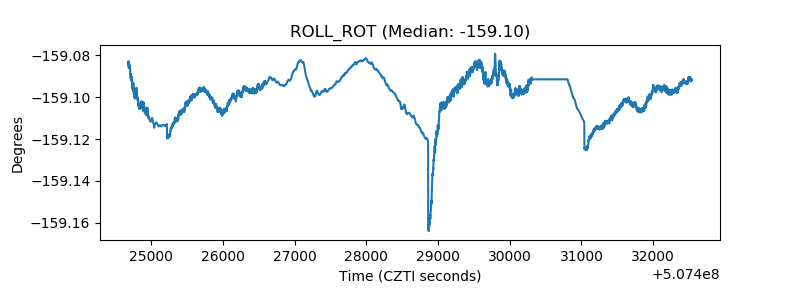 |
| _Roll_DEC | 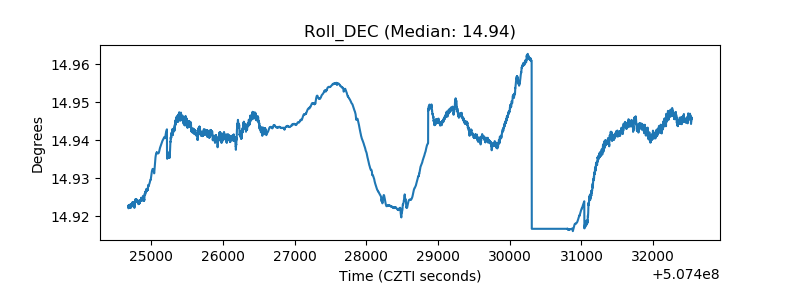 |
| _Roll_RA | 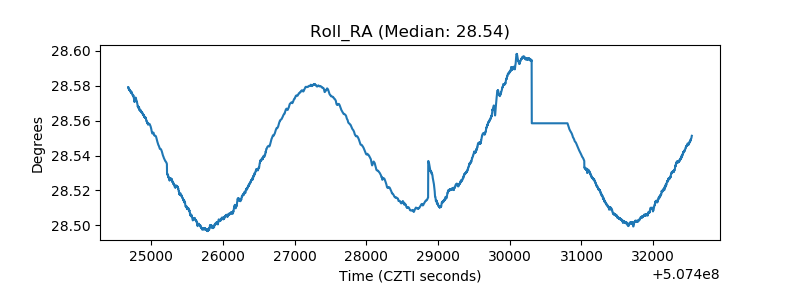 |
| Veto Counter | 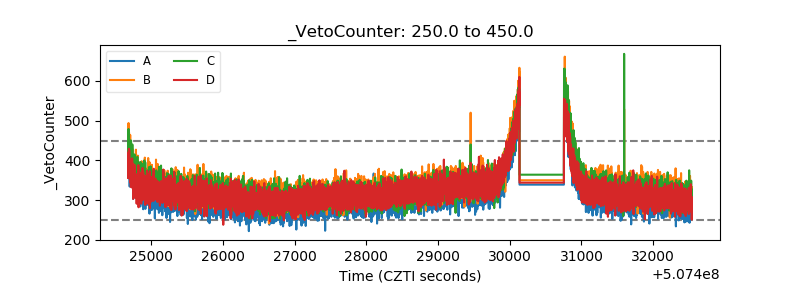 |