| Param | Original file | Final file |
|---|---|---|
| Filename | modeM0/AS1A14_066T02_9000006546_55944cztM0_level2.fits | modeM0/AS1A14_066T02_9000006546_55944cztM0_level2_quad_clean.evt |
| Size (bytes) | 448,099,200 | 110,321,280 |
| Size | 427.3 MB | 105.2 MB |
| Events in quadrant A | 3,837,716 | 709,511 |
| Events in quadrant B | 3,514,796 | 766,402 |
| Events in quadrant C | 4,420,525 | 676,168 |
| Events in quadrant D | 4,210,349 | 649,115 |
| Mode M0 | |||
|---|---|---|---|
| Quadrant | BADHDUFLAG | Total packets | Discarded packets |
| A | 0 | 17246 | 0 |
| B | 0 | 16365 | 0 |
| C | 0 | 18809 | 0 |
| D | 0 | 18300 | 0 |
| Mode SS | |||
|---|---|---|---|
| Quadrant | BADHDUFLAG | Total packets | Discarded packets |
| A | 0 | 154 | 0 |
| B | 0 | 154 | 0 |
| C | 0 | 154 | 0 |
| D | 0 | 154 | 0 |
| Quadrant | Total seconds | Saturated seconds | Saturation percentage |
|---|---|---|---|
| A | 7759 | 184 | 2.371440% |
| B | 7759 | 143 | 1.843021% |
| C | 7759 | 257 | 3.312283% |
| D | 7760 | 128 | 1.649485% |
Noise dominated data is calculated using 1-second bins in cleaned event files. If a bin has >2000 counts, and if more than 50% of those come from <1% of pixels, then it is considered to be noise-dominated and hence unusable.
| Quadrant | # 1 sec bins | Bins with >0 counts | Bins with >2000 counts | High rate bins dominated by noise | Noise dominated (total time) | Noise dominated (detector-on time) | Marked lightcurve |
|---|---|---|---|---|---|---|---|
| A | 7759 | 7759 | 65 | 65 | 0.84% | 0.84% | 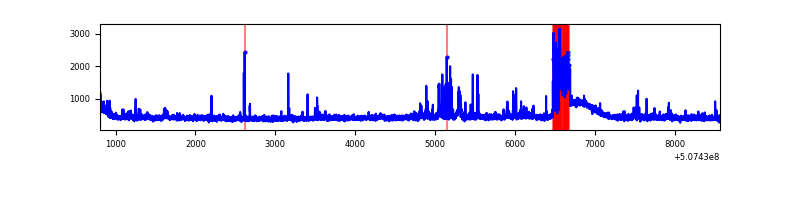 |
| B | 7759 | 7759 | 4 | 4 | 0.05% | 0.05% | 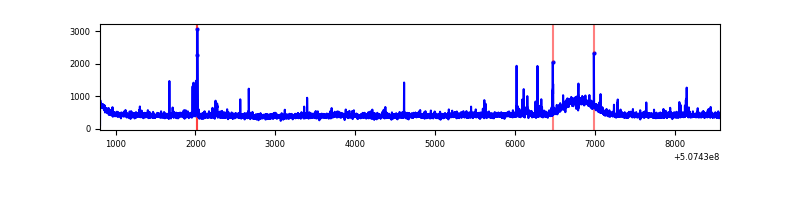 |
| C | 7759 | 7759 | 150 | 150 | 1.93% | 1.93% | 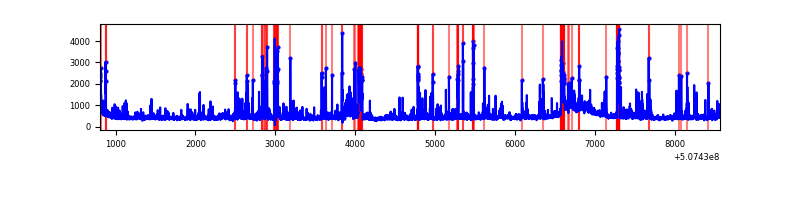 |
| D | 7760 | 7760 | 95 | 95 | 1.22% | 1.22% | 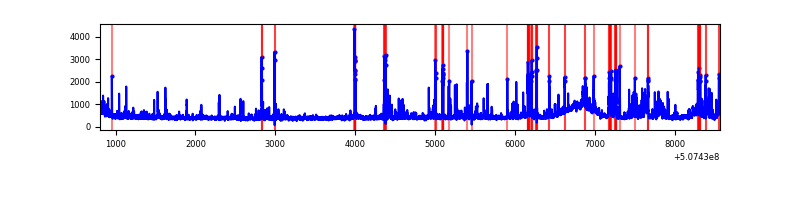 |
Top three noisy pixels from each quadrant. If the there are fewer than three noisy pixels in the level2.evt file, extra rows are filled as -1
| Pixel properties | Quadrant properties | ||||||
|---|---|---|---|---|---|---|---|
| Quadrant | DetID | PixID | Counts | Sigma | Mean | Median | Sigma |
| A | 3 | 14 | 490156 | 2361.8 | 845 | 822 | 207.2 |
| A | 4 | 3 | 19753 | 91.37 | 845 | 822 | 207.2 |
| A | 0 | 8 | 17060 | 78.37 | 845 | 822 | 207.2 |
| B | 7 | 252 | 44543 | 239.62 | 841 | 810 | 182.5 |
| B | 4 | 21 | 37084 | 198.75 | 841 | 810 | 182.5 |
| B | 9 | 251 | 33812 | 180.83 | 841 | 810 | 182.5 |
| C | 13 | 3 | 366935 | 1639.73 | 815 | 807 | 223.3 |
| C | 6 | 223 | 321126 | 1434.57 | 815 | 807 | 223.3 |
| C | 12 | 252 | 261635 | 1168.13 | 815 | 807 | 223.3 |
| D | 11 | 129 | 596435 | 2570.76 | 818 | 782 | 231.7 |
| D | 1 | 31 | 129738 | 556.56 | 818 | 782 | 231.7 |
| D | 5 | 173 | 57246 | 243.69 | 818 | 782 | 231.7 |
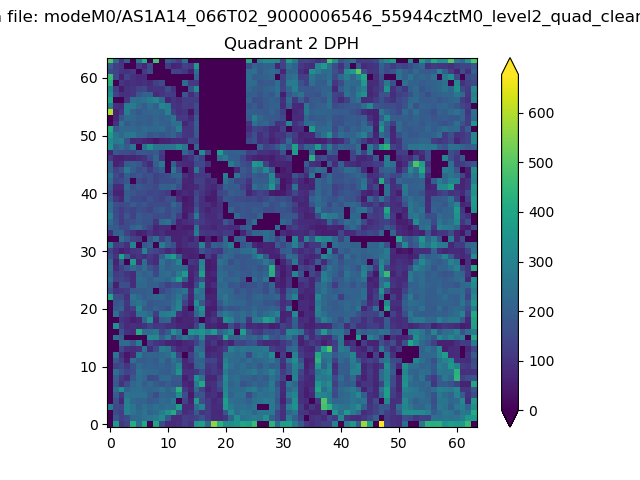
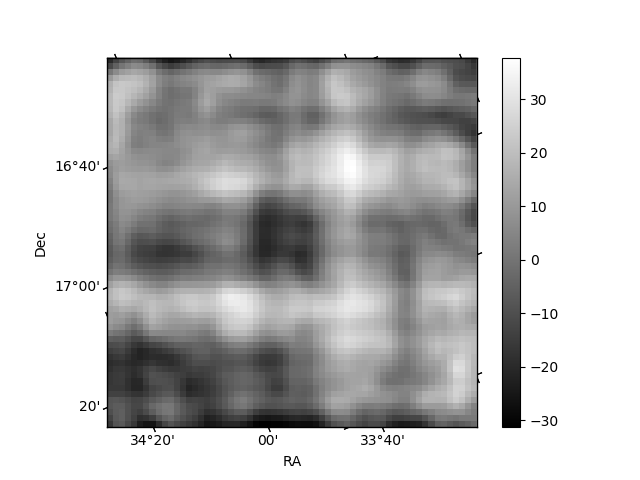
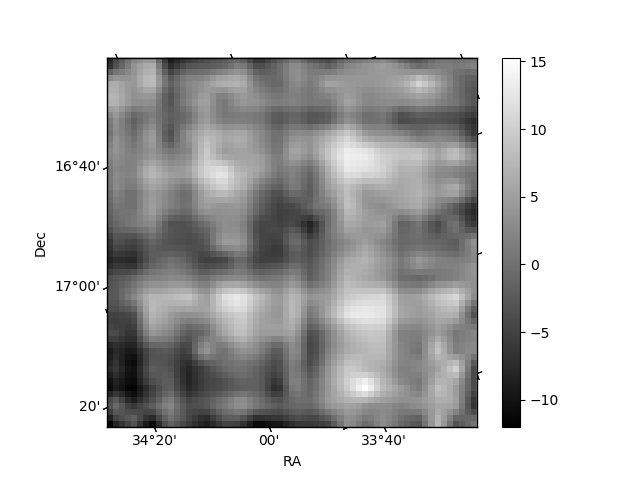
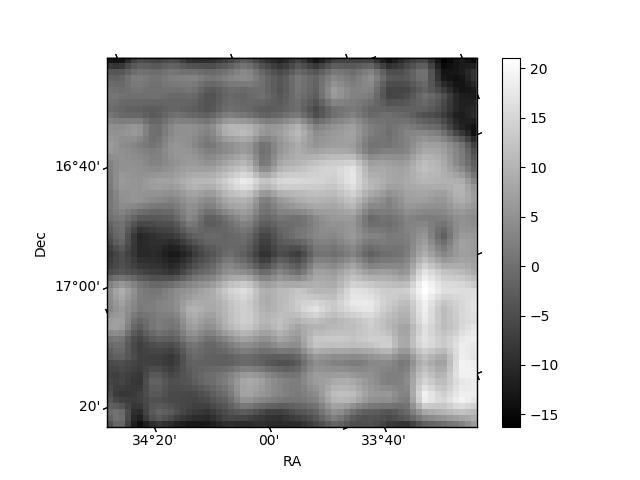
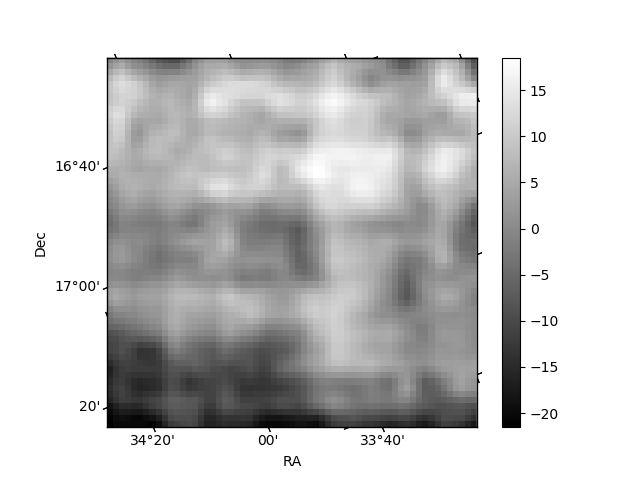
Histogram calculated using DETX and DETY for each event in the final _common_clean file
| Quadrant A | 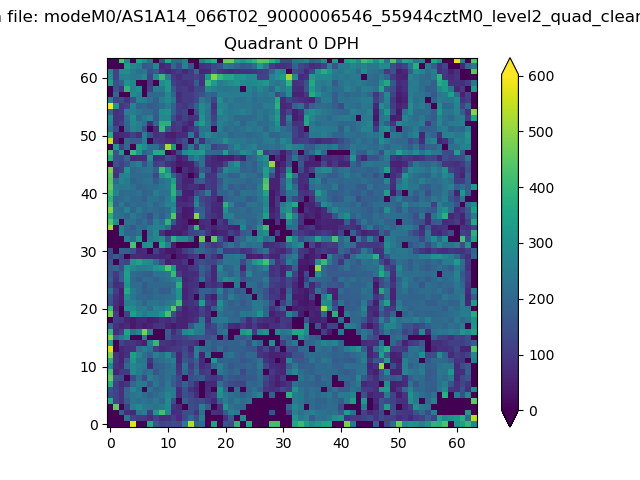 |
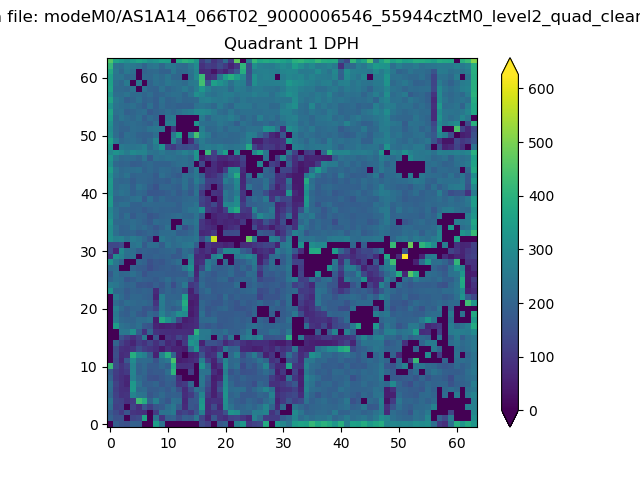 |
Quadrant B |
|---|---|---|---|
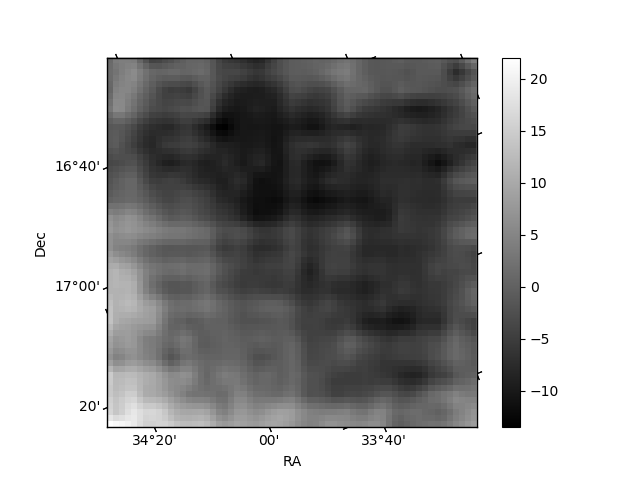
| Quadrant D | 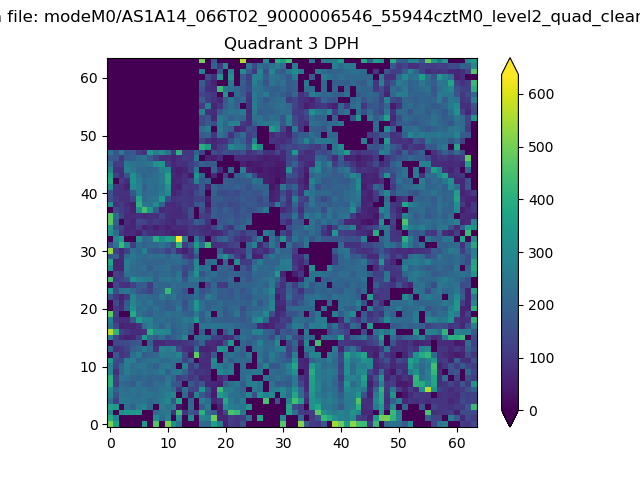 |
 |
Quadrant C |
| Plot type | Count rate plots | Images |
|---|---|---|
| Comparison with Poisson distribution Blue bars denote a histogram of data divided into 1 sec bins. Red curve is a Poisson curve with rate = median count rate of data. |
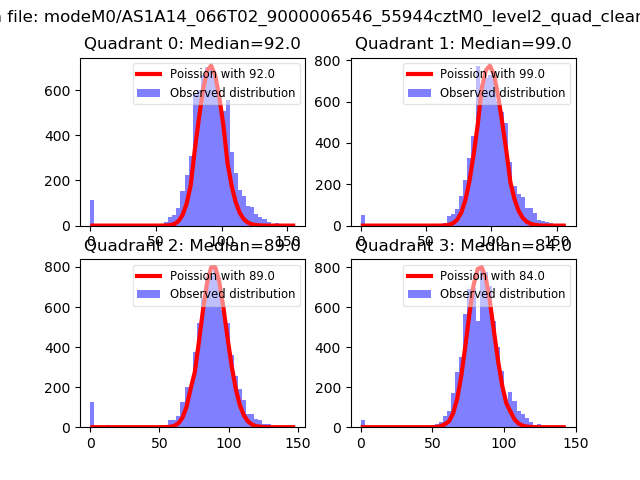 |
 |
| Quadrant-wise count rates Data is divided into 100 sec bins |
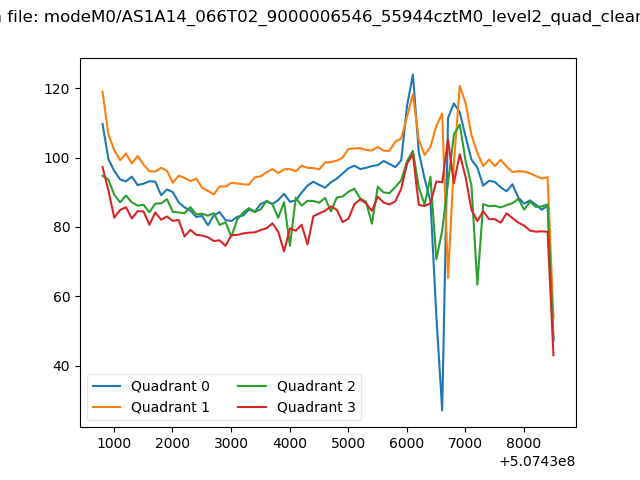 |
|
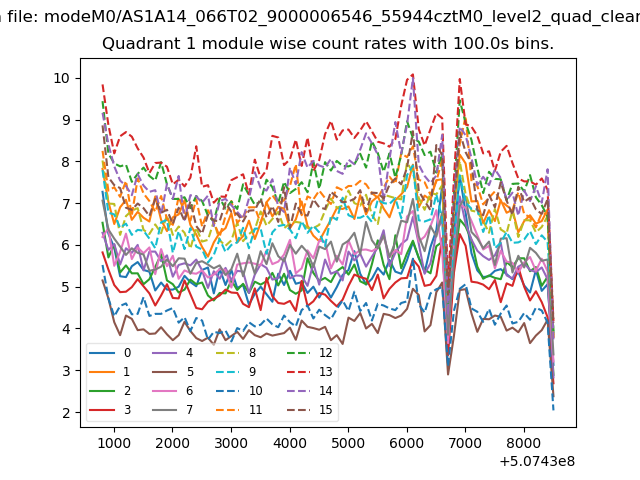
| Module-wise count rates for Quadrant A Data is divided into 100 sec bins |
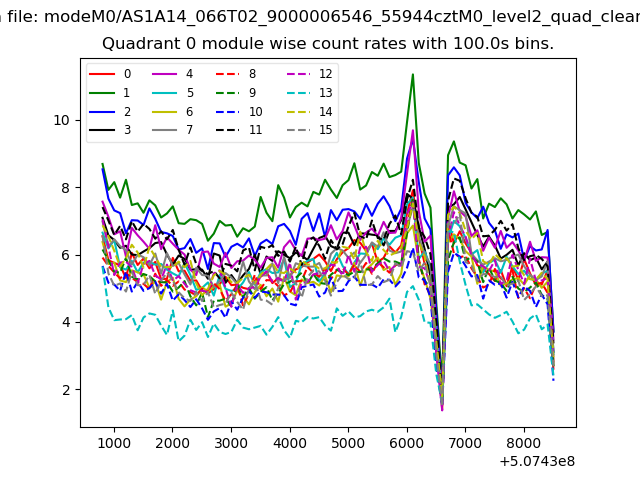 |
 |
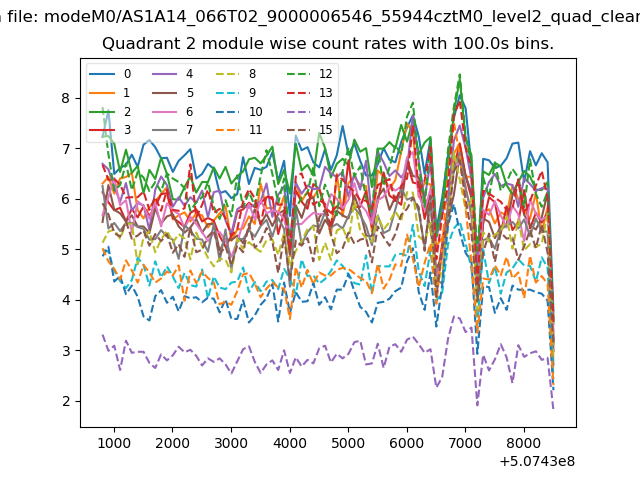
| Module-wise count rates for Quadrant B Data is divided into 100 sec bins |
 |
 |
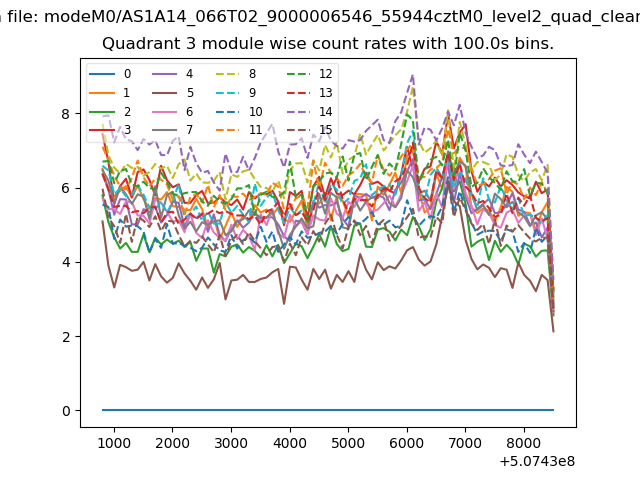
| Module-wise count rates for Quadrant C Data is divided into 100 sec bins |
 |
 |
| Module-wise count rates for Quadrant D Data is divided into 100 sec bins |
 |
 |
| Parameter | Plot |
|---|---|
| CZT HV Monitor | 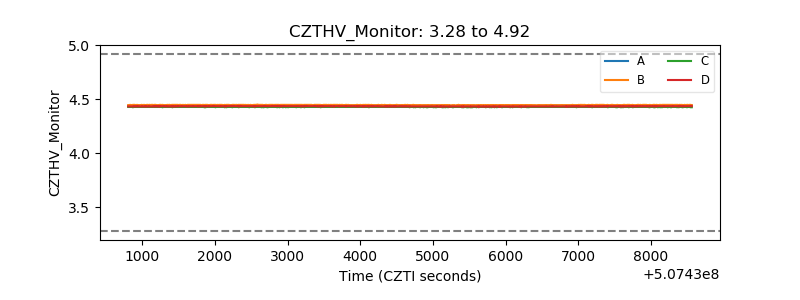 |
| D_VDD | 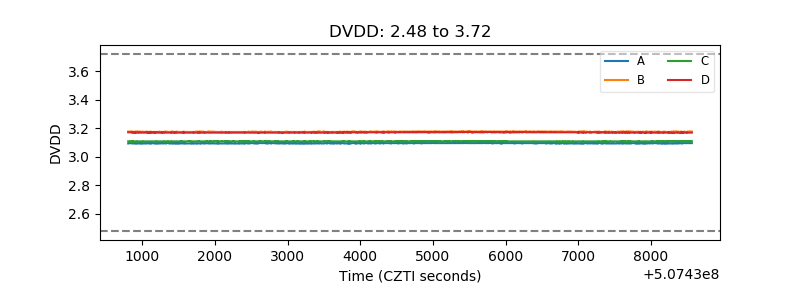 |
| Temperature 1 | 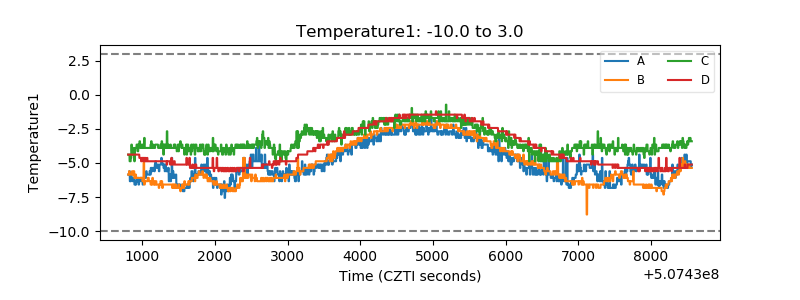 |
| Veto HV Monitor | 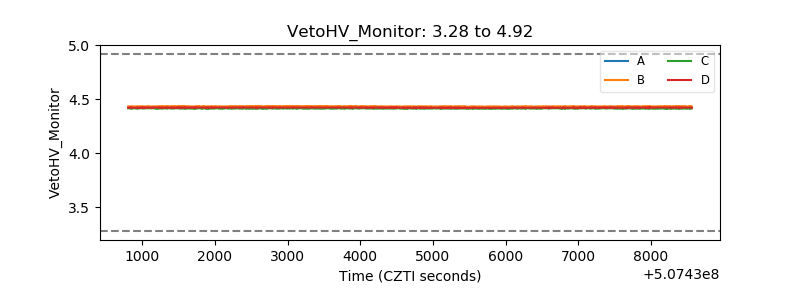 |
| Veto LLD | 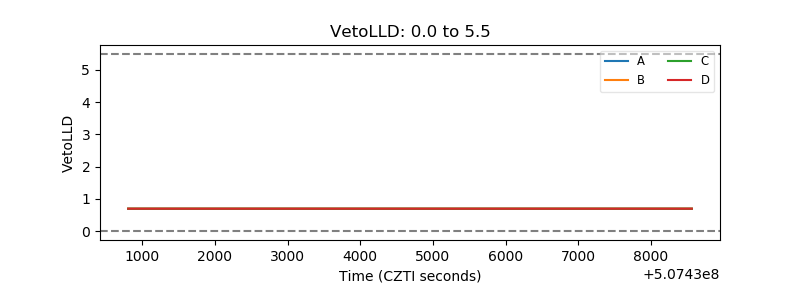 |
| Alpha Counter | 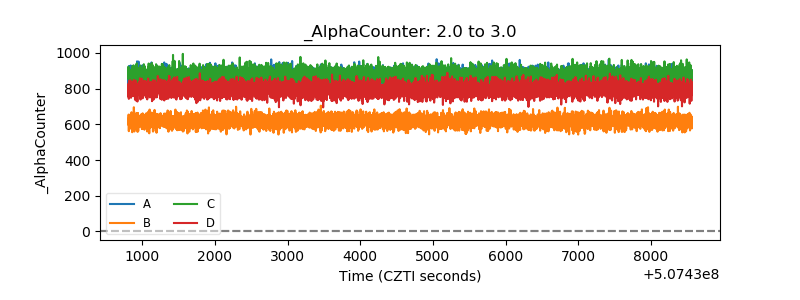 |
| _CPM_Rate | 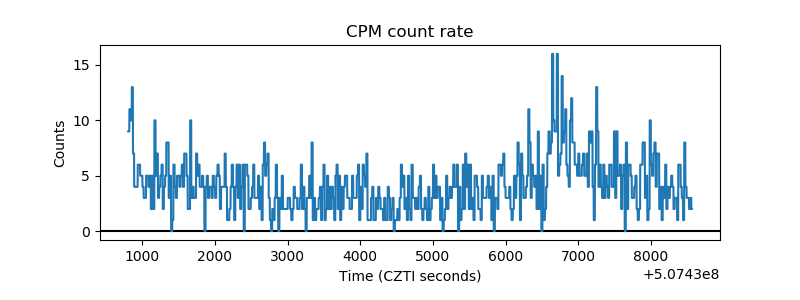 |
| CZT Counter | 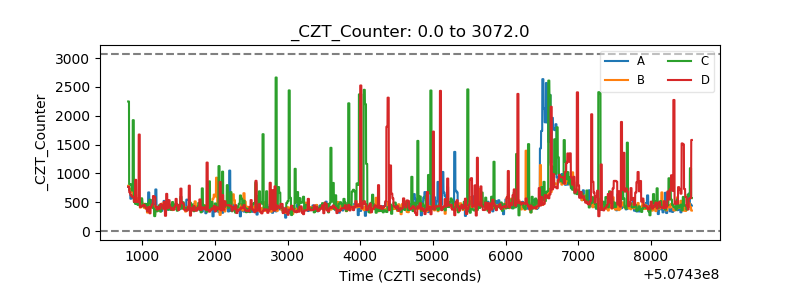 |
| +2.5 Volts monitor |  |
| +5 Volts monitor |  |
| _ROLL_ROT | 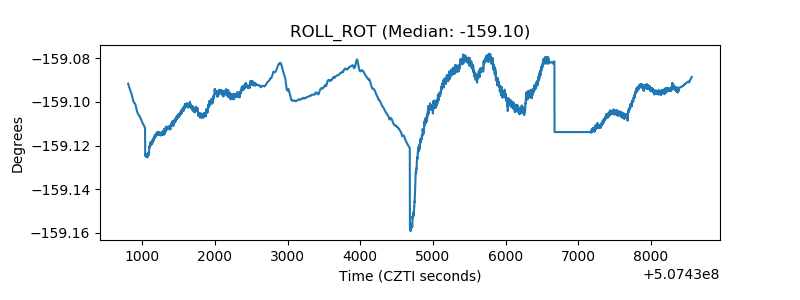 |
| _Roll_DEC | 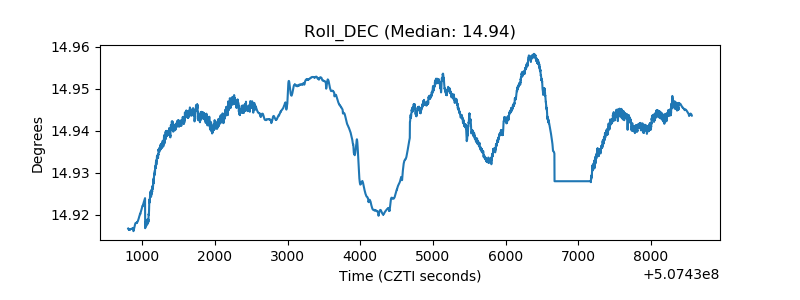 |
| _Roll_RA | 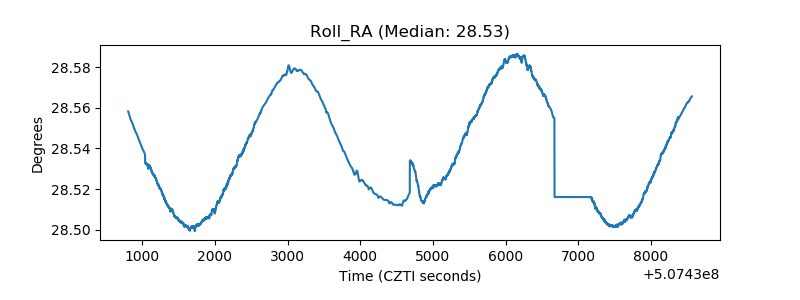 |
| Veto Counter | 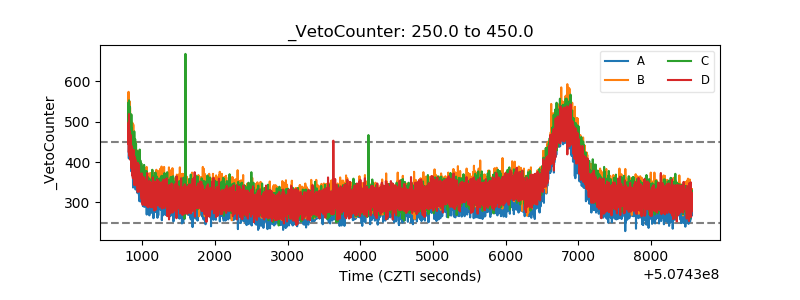 |