| Param | Original file | Final file |
|---|---|---|
| Filename | modeM0/AS1A14_066T02_9000006546_55945cztM0_level2.fits | modeM0/AS1A14_066T02_9000006546_55945cztM0_level2_quad_clean.evt |
| Size (bytes) | 466,194,240 | 107,732,160 |
| Size | 444.6 MB | 102.7 MB |
| Events in quadrant A | 3,478,473 | 708,369 |
| Events in quadrant B | 3,367,612 | 760,324 |
| Events in quadrant C | 3,755,001 | 673,791 |
| Events in quadrant D | 6,053,310 | 581,267 |
| Mode M0 | |||
|---|---|---|---|
| Quadrant | BADHDUFLAG | Total packets | Discarded packets |
| A | 0 | 16198 | 0 |
| B | 0 | 15990 | 0 |
| C | 0 | 17042 | 1 |
| D | 0 | 23557 | 0 |
| Mode SS | |||
|---|---|---|---|
| Quadrant | BADHDUFLAG | Total packets | Discarded packets |
| A | 0 | 154 | 0 |
| B | 0 | 154 | 0 |
| C | 0 | 154 | 0 |
| D | 0 | 154 | 0 |
| Quadrant | Total seconds | Saturated seconds | Saturation percentage |
|---|---|---|---|
| A | 7745 | 10 | 0.129116% |
| B | 7746 | 18 | 0.232378% |
| C | 7745 | 113 | 1.459006% |
| D | 7745 | 824 | 10.639122% |
Noise dominated data is calculated using 1-second bins in cleaned event files. If a bin has >2000 counts, and if more than 50% of those come from <1% of pixels, then it is considered to be noise-dominated and hence unusable.
| Quadrant | # 1 sec bins | Bins with >0 counts | Bins with >2000 counts | High rate bins dominated by noise | Noise dominated (total time) | Noise dominated (detector-on time) | Marked lightcurve |
|---|---|---|---|---|---|---|---|
| A | 7745 | 7745 | 5 | 5 | 0.06% | 0.06% | 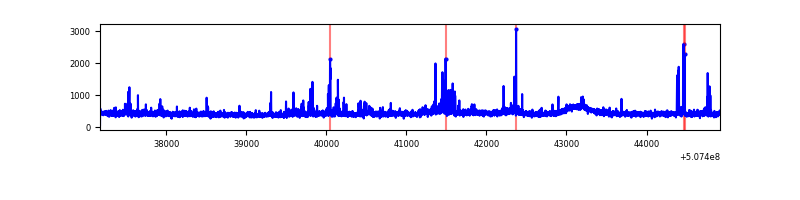 |
| B | 7746 | 7746 | 6 | 6 | 0.08% | 0.08% | 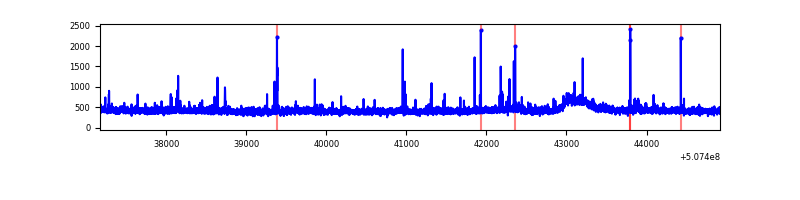 |
| C | 7745 | 7745 | 79 | 79 | 1.02% | 1.02% | 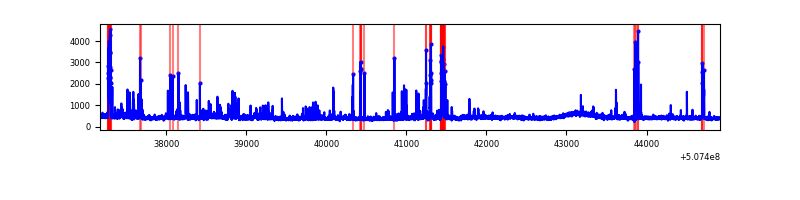 |
| D | 7745 | 7745 | 669 | 669 | 8.64% | 8.64% | 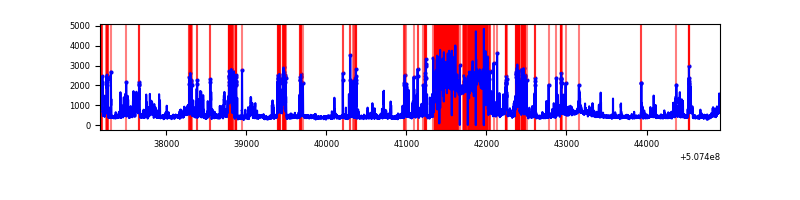 |
Top three noisy pixels from each quadrant. If the there are fewer than three noisy pixels in the level2.evt file, extra rows are filled as -1
| Pixel properties | Quadrant properties | ||||||
|---|---|---|---|---|---|---|---|
| Quadrant | DetID | PixID | Counts | Sigma | Mean | Median | Sigma |
| A | 3 | 14 | 150266 | 737.85 | 811 | 791 | 202.6 |
| A | 15 | 32 | 67850 | 331.02 | 811 | 791 | 202.6 |
| A | 5 | 16 | 31460 | 151.39 | 811 | 791 | 202.6 |
| B | 0 | 213 | 41708 | 236.38 | 805 | 775 | 173.2 |
| B | 4 | 21 | 33049 | 186.37 | 805 | 775 | 173.2 |
| B | 12 | 111 | 21594 | 120.22 | 805 | 775 | 173.2 |
| C | 12 | 252 | 305866 | 1409.97 | 789 | 784 | 216.4 |
| C | 13 | 3 | 235305 | 1083.87 | 789 | 784 | 216.4 |
| C | 11 | 244 | 32119 | 144.82 | 789 | 784 | 216.4 |
| D | 11 | 129 | 2718789 | 13048.17 | 730 | 697 | 208.3 |
| D | 1 | 31 | 178922 | 855.57 | 730 | 697 | 208.3 |
| D | 3 | 12 | 111697 | 532.85 | 730 | 697 | 208.3 |
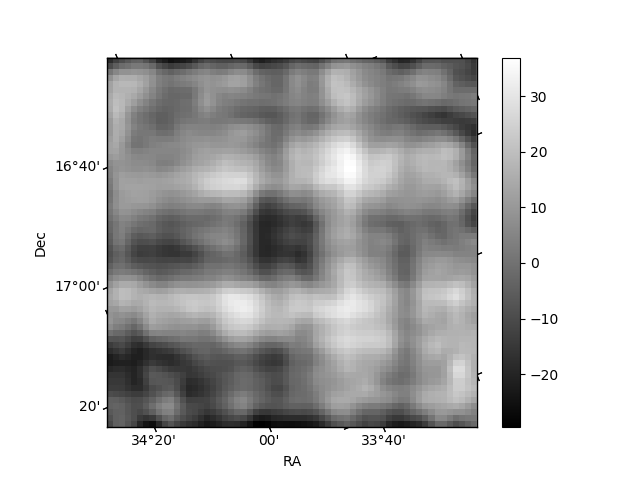
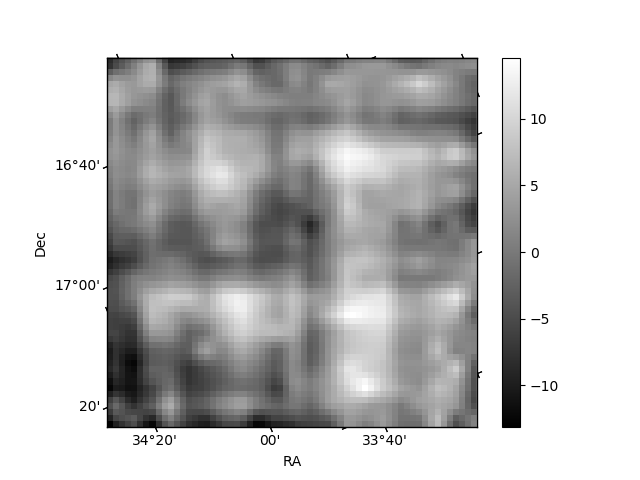
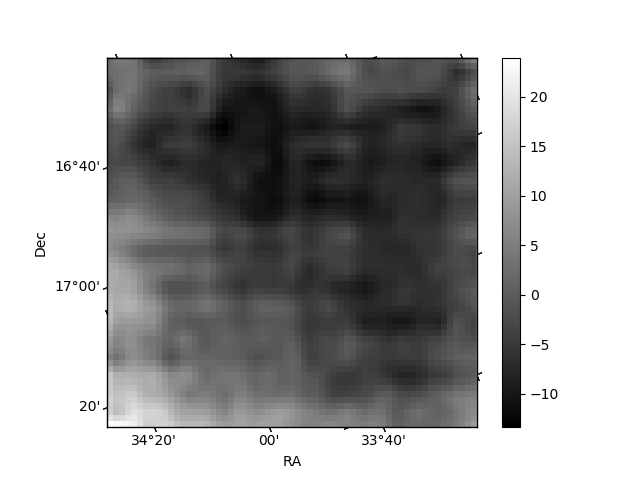
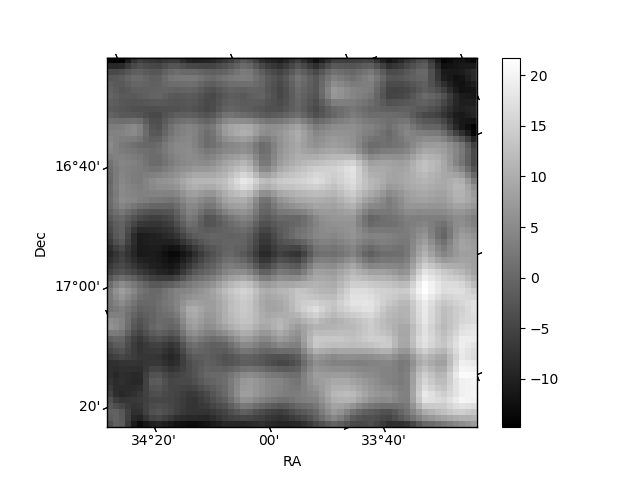
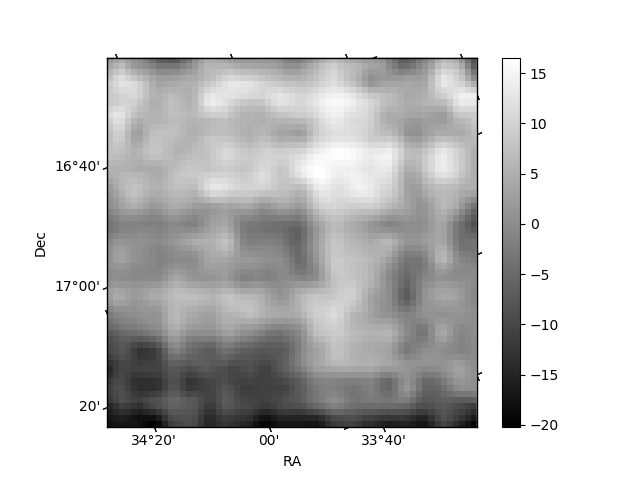
Histogram calculated using DETX and DETY for each event in the final _common_clean file
| Quadrant A | 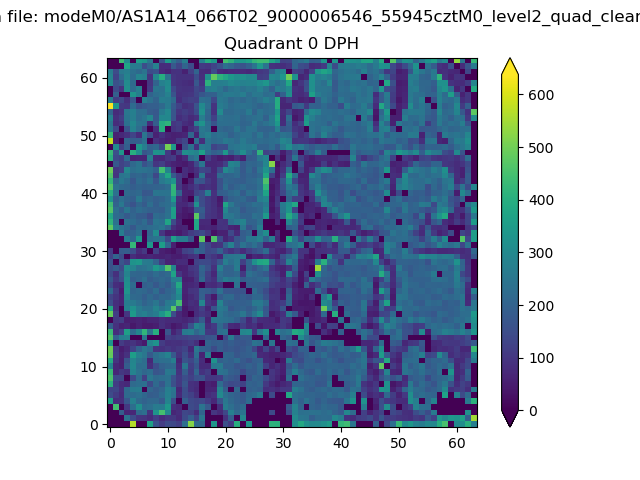 |
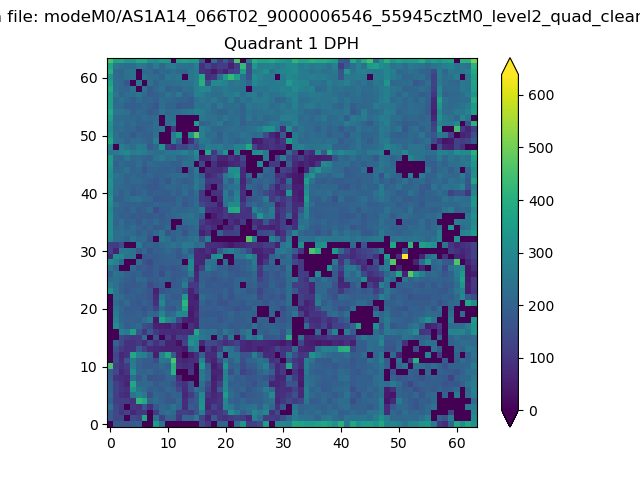 |
Quadrant B |
|---|---|---|---|
| Quadrant D | 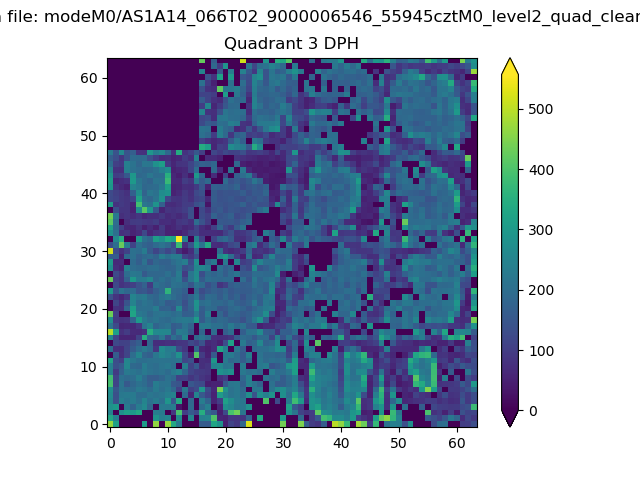 |
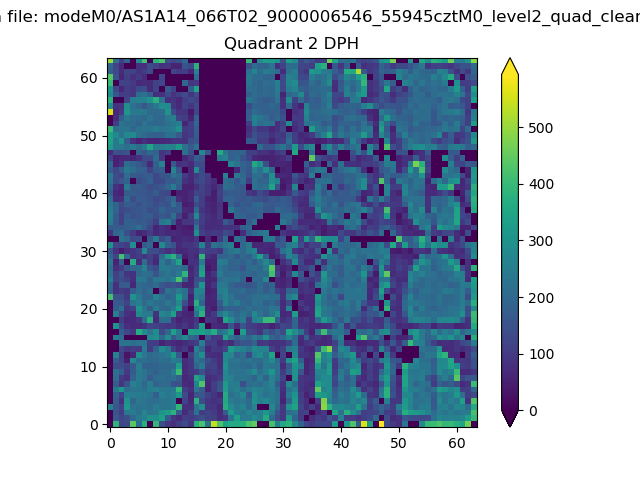 |
Quadrant C |
| Plot type | Count rate plots | Images |
|---|---|---|
| Comparison with Poisson distribution Blue bars denote a histogram of data divided into 1 sec bins. Red curve is a Poisson curve with rate = median count rate of data. |
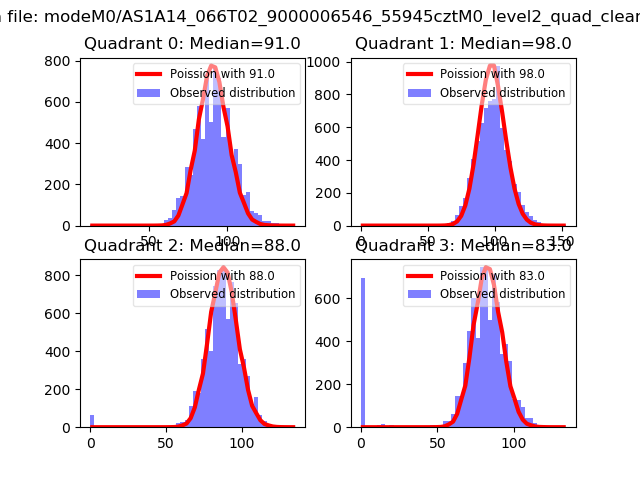 |
 |
| Quadrant-wise count rates Data is divided into 100 sec bins |
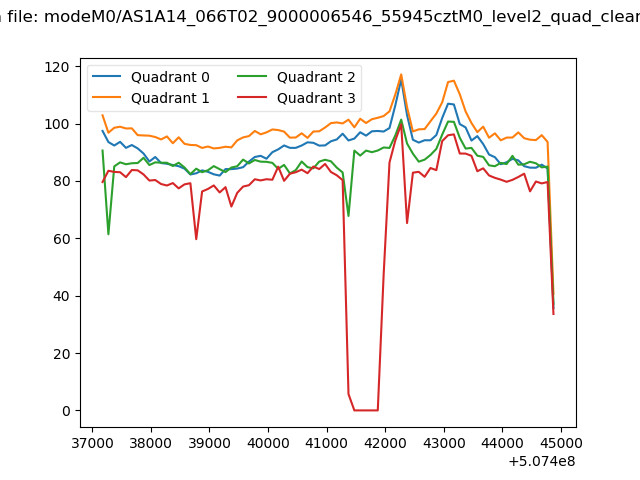 |
|
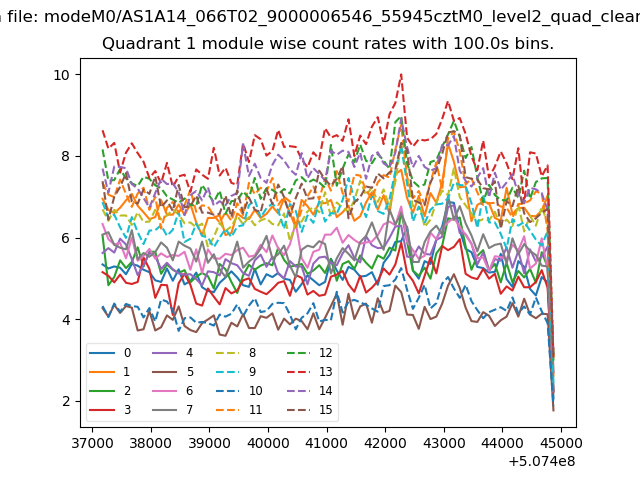
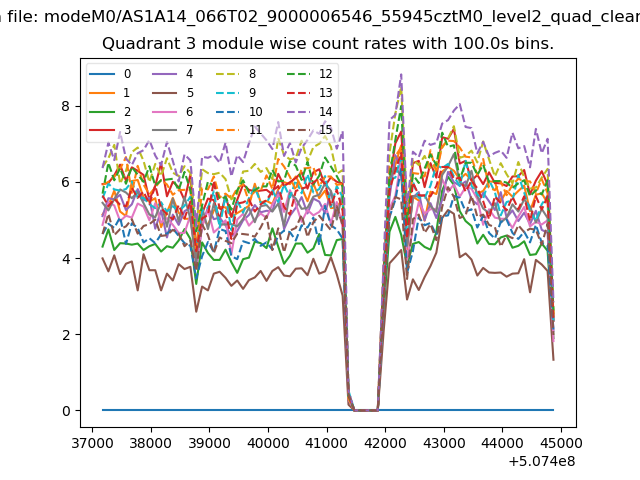
| Module-wise count rates for Quadrant A Data is divided into 100 sec bins |
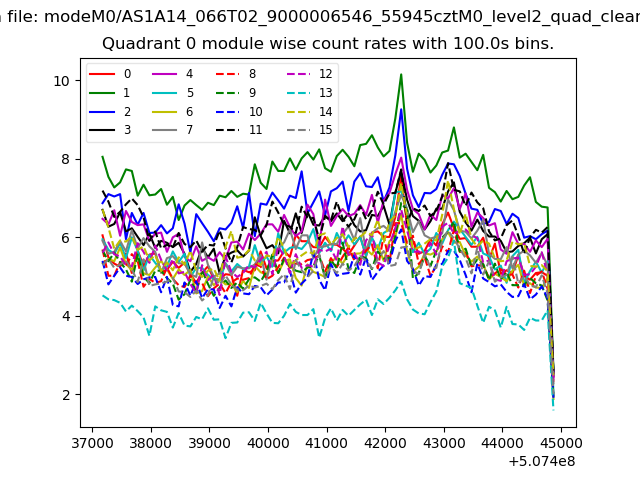 |
 |
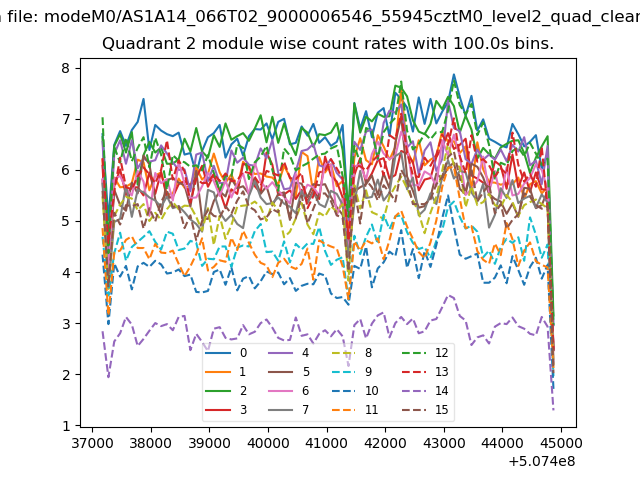
| Module-wise count rates for Quadrant B Data is divided into 100 sec bins |
 |
 |
| Module-wise count rates for Quadrant C Data is divided into 100 sec bins |
 |
 |
| Module-wise count rates for Quadrant D Data is divided into 100 sec bins |
 |
 |
| Parameter | Plot |
|---|---|
| CZT HV Monitor | 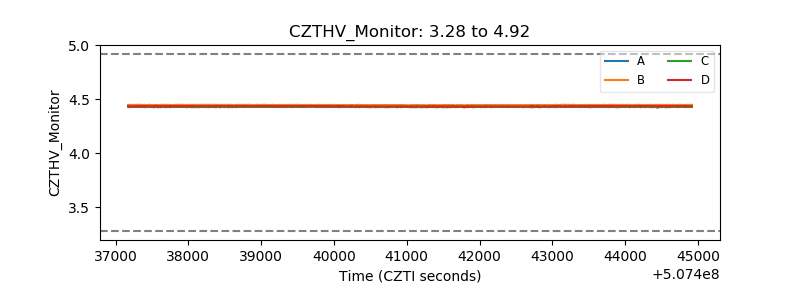 |
| D_VDD | 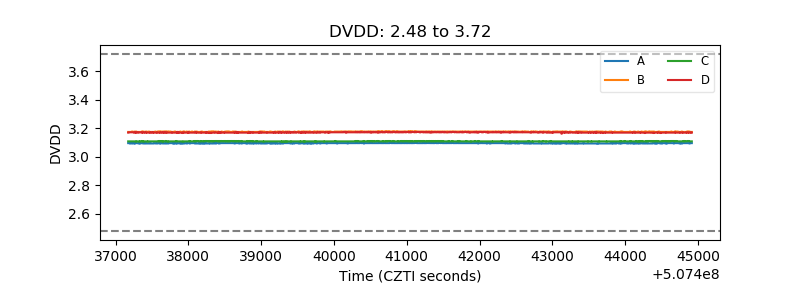 |
| Temperature 1 | 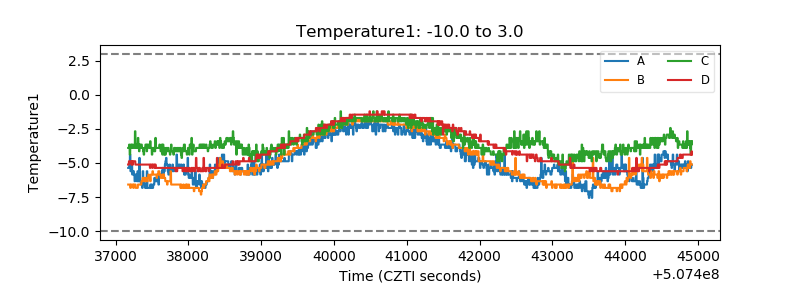 |
| Veto HV Monitor | 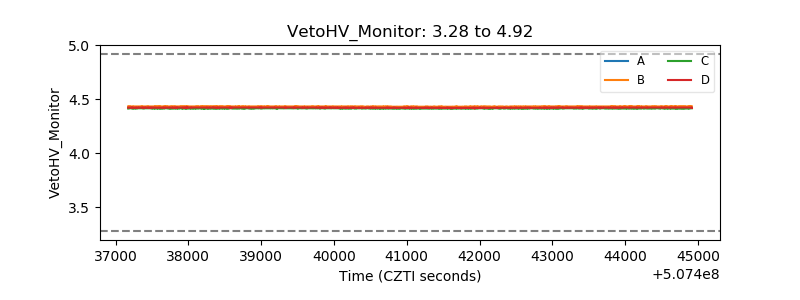 |
| Veto LLD | 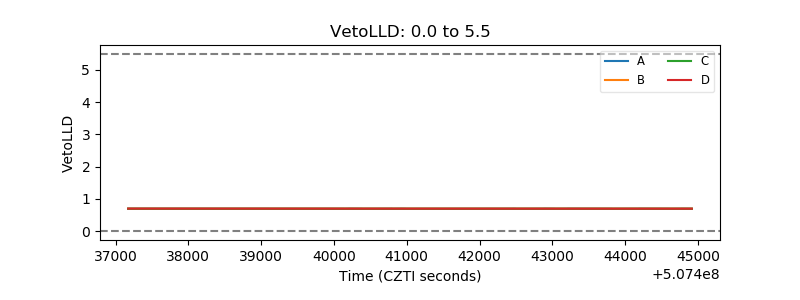 |
| Alpha Counter | 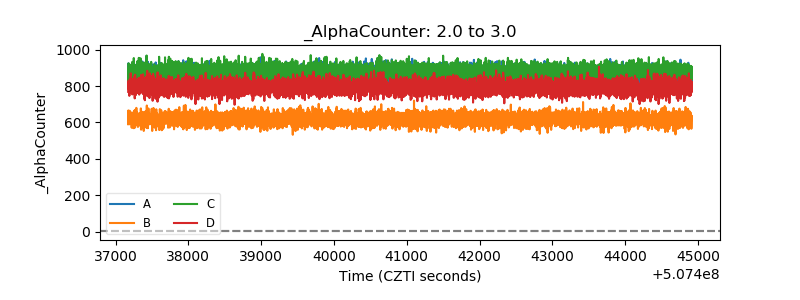 |
| _CPM_Rate | 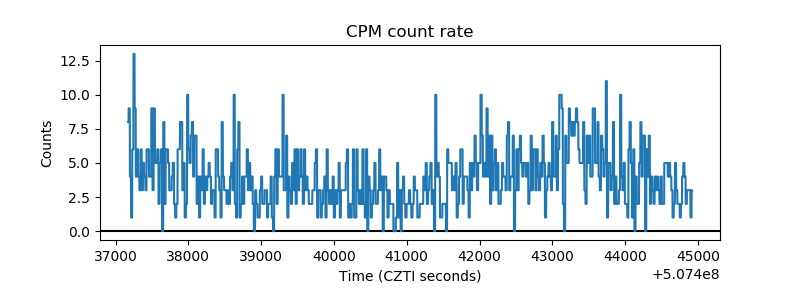 |
| CZT Counter | 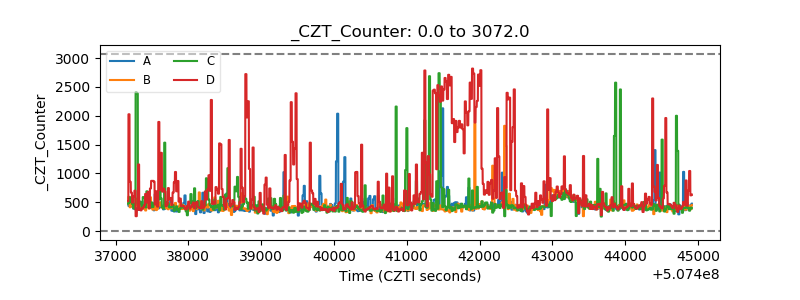 |
| +2.5 Volts monitor | 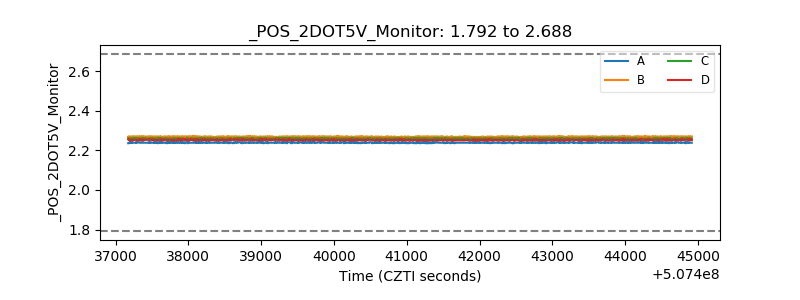 |
| +5 Volts monitor |  |
| _ROLL_ROT | 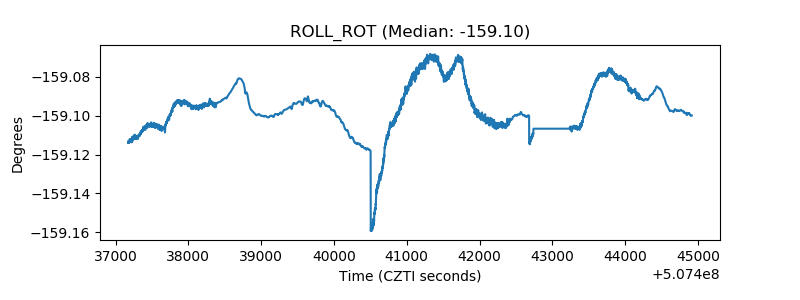 |
| _Roll_DEC | 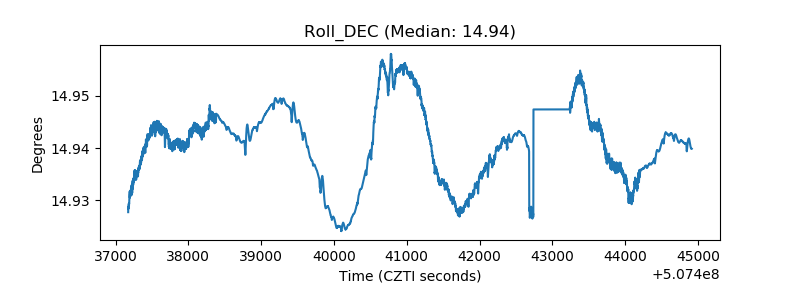 |
| _Roll_RA | 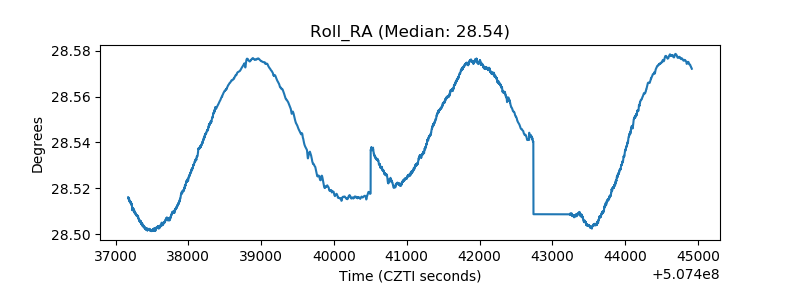 |
| Veto Counter | 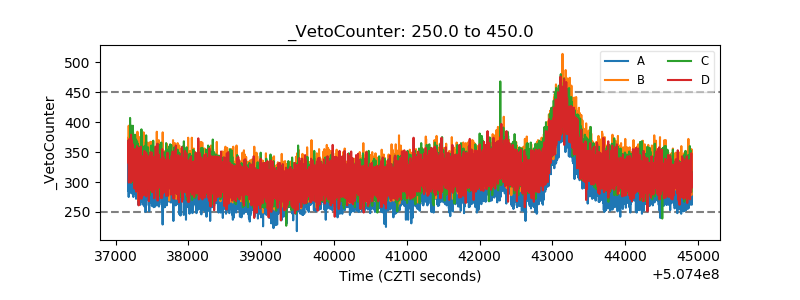 |