| Param | Original file | Final file |
|---|---|---|
| Filename | modeM0/AS1A14_066T02_9000006546_55946cztM0_level2.fits | modeM0/AS1A14_066T02_9000006546_55946cztM0_level2_quad_clean.evt |
| Size (bytes) | 463,510,080 | 114,206,400 |
| Size | 442.0 MB | 108.9 MB |
| Events in quadrant A | 4,156,268 | 736,591 |
| Events in quadrant B | 3,612,018 | 790,839 |
| Events in quadrant C | 3,889,950 | 705,698 |
| Events in quadrant D | 4,873,494 | 665,148 |
| Mode M0 | |||
|---|---|---|---|
| Quadrant | BADHDUFLAG | Total packets | Discarded packets |
| A | 0 | 18202 | 0 |
| B | 0 | 16843 | 0 |
| C | 0 | 17816 | 0 |
| D | 0 | 20212 | 0 |
| Mode SS | |||
|---|---|---|---|
| Quadrant | BADHDUFLAG | Total packets | Discarded packets |
| A | 0 | 162 | 0 |
| B | 0 | 162 | 0 |
| C | 0 | 162 | 0 |
| D | 0 | 162 | 0 |
| Quadrant | Total seconds | Saturated seconds | Saturation percentage |
|---|---|---|---|
| A | 8049 | 78 | 0.969064% |
| B | 8049 | 88 | 1.093304% |
| C | 8049 | 127 | 1.577836% |
| D | 8050 | 141 | 1.751553% |
Noise dominated data is calculated using 1-second bins in cleaned event files. If a bin has >2000 counts, and if more than 50% of those come from <1% of pixels, then it is considered to be noise-dominated and hence unusable.
| Quadrant | # 1 sec bins | Bins with >0 counts | Bins with >2000 counts | High rate bins dominated by noise | Noise dominated (total time) | Noise dominated (detector-on time) | Marked lightcurve |
|---|---|---|---|---|---|---|---|
| A | 8049 | 8049 | 53 | 53 | 0.66% | 0.66% | 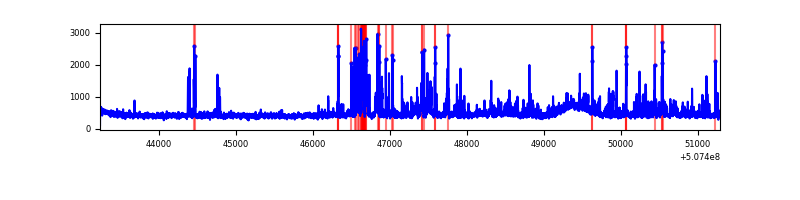 |
| B | 8049 | 8049 | 15 | 15 | 0.19% | 0.19% | 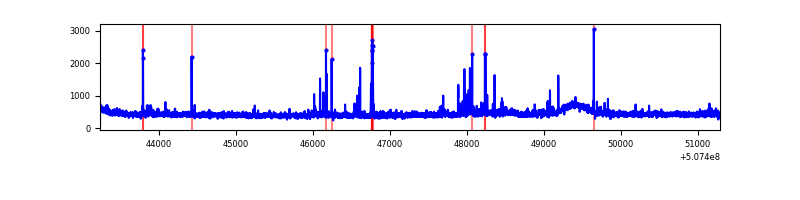 |
| C | 8049 | 8049 | 84 | 84 | 1.04% | 1.04% | 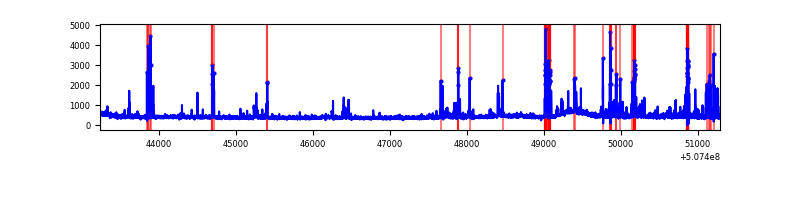 |
| D | 8050 | 8050 | 118 | 118 | 1.47% | 1.47% | 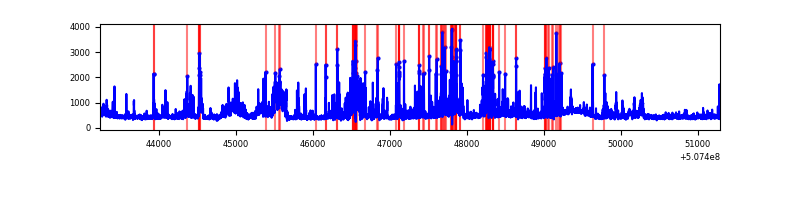 |
Top three noisy pixels from each quadrant. If the there are fewer than three noisy pixels in the level2.evt file, extra rows are filled as -1
| Pixel properties | Quadrant properties | ||||||
|---|---|---|---|---|---|---|---|
| Quadrant | DetID | PixID | Counts | Sigma | Mean | Median | Sigma |
| A | 3 | 14 | 506209 | 2380.69 | 856 | 835 | 212.3 |
| A | 7 | 64 | 218541 | 1025.56 | 856 | 835 | 212.3 |
| A | 5 | 16 | 44574 | 206.04 | 856 | 835 | 212.3 |
| B | 10 | 59 | 48246 | 258.77 | 851 | 819 | 183.3 |
| B | 7 | 252 | 35908 | 191.45 | 851 | 819 | 183.3 |
| B | 0 | 199 | 26047 | 137.64 | 851 | 819 | 183.3 |
| C | 12 | 252 | 280980 | 1230.45 | 832 | 825 | 227.7 |
| C | 13 | 3 | 95248 | 414.71 | 832 | 825 | 227.7 |
| C | 1 | 109 | 86307 | 375.44 | 832 | 825 | 227.7 |
| D | 11 | 129 | 914042 | 3944.34 | 825 | 790 | 231.5 |
| D | 7 | 129 | 145656 | 625.68 | 825 | 790 | 231.5 |
| D | 1 | 31 | 109251 | 468.44 | 825 | 790 | 231.5 |
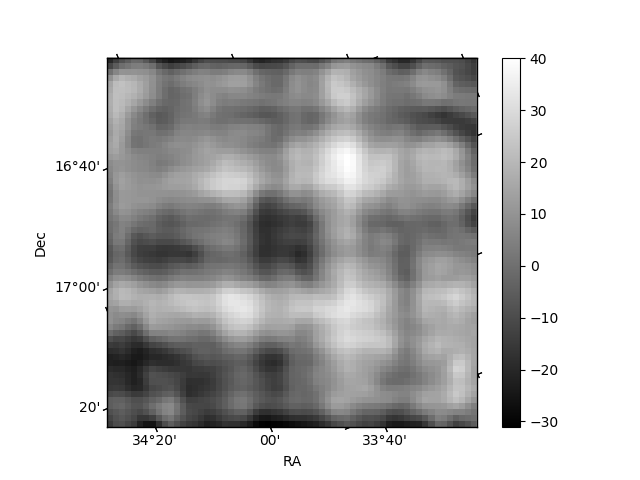
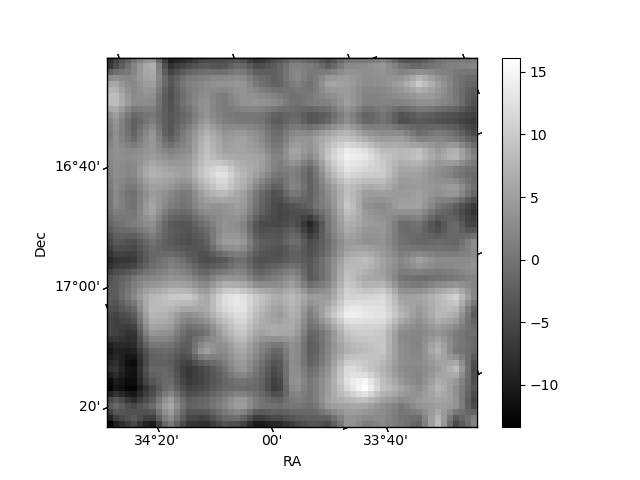
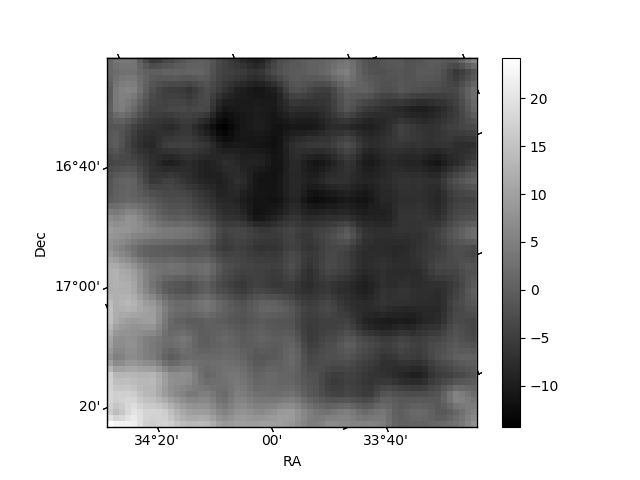
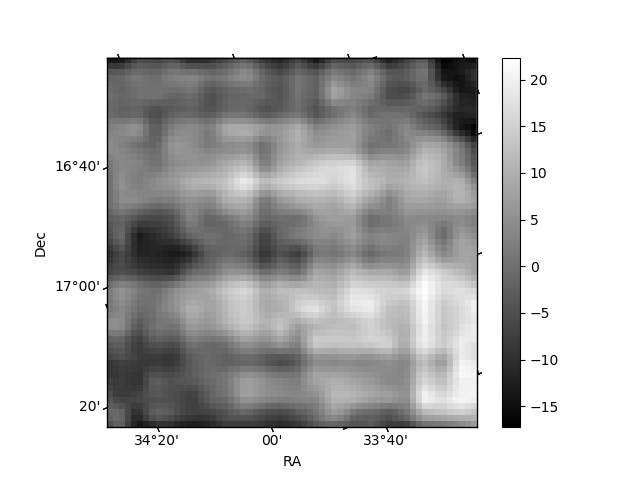
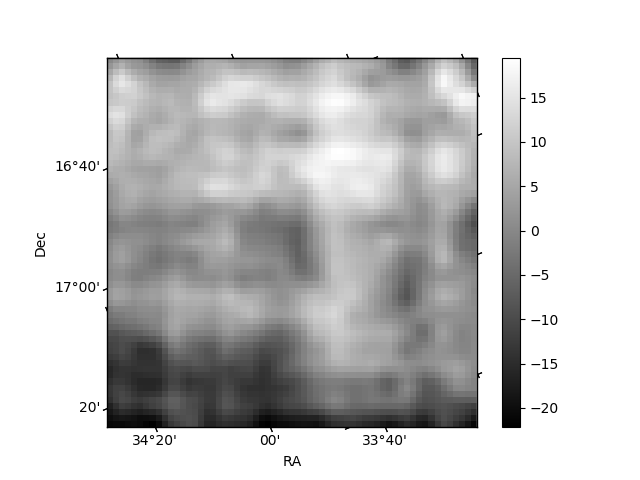
Histogram calculated using DETX and DETY for each event in the final _common_clean file
| Quadrant A | 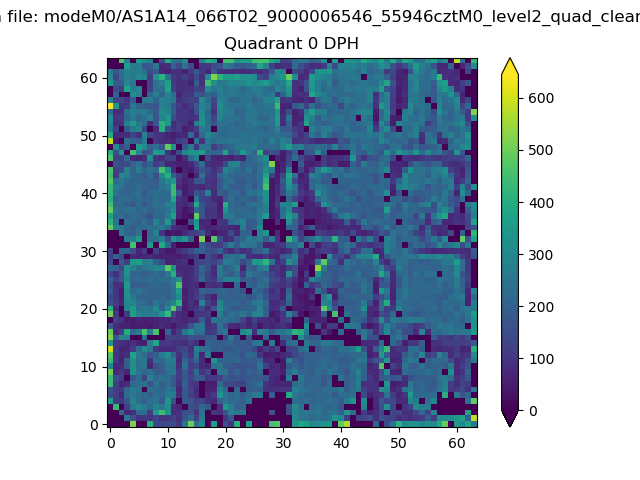 |
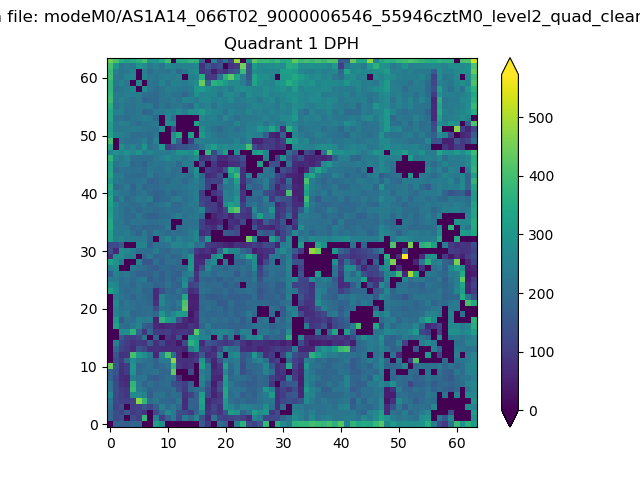 |
Quadrant B |
|---|---|---|---|
| Quadrant D | 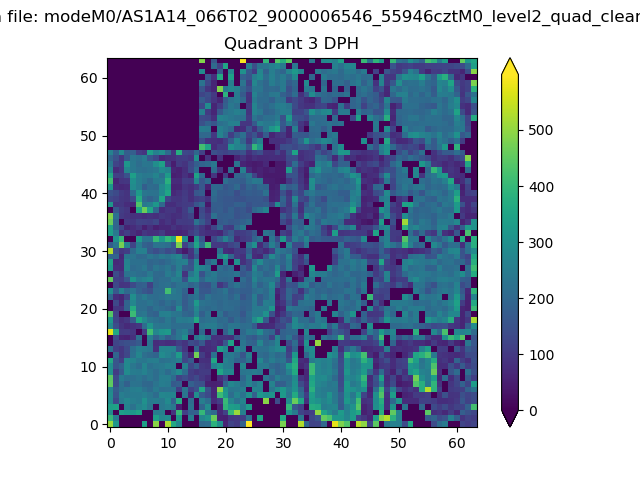 |
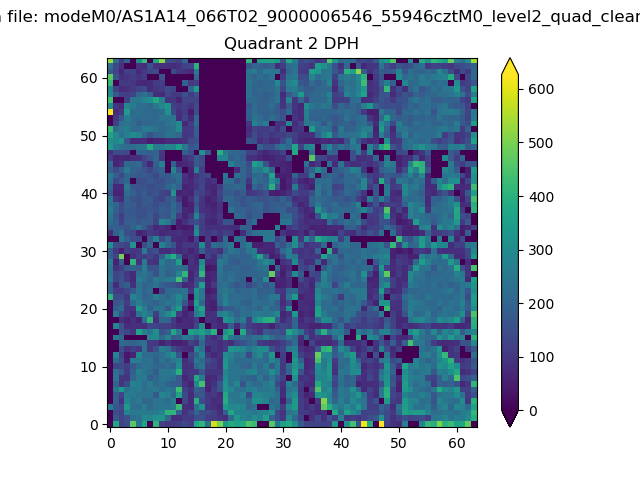 |
Quadrant C |
| Plot type | Count rate plots | Images |
|---|---|---|
| Comparison with Poisson distribution Blue bars denote a histogram of data divided into 1 sec bins. Red curve is a Poisson curve with rate = median count rate of data. |
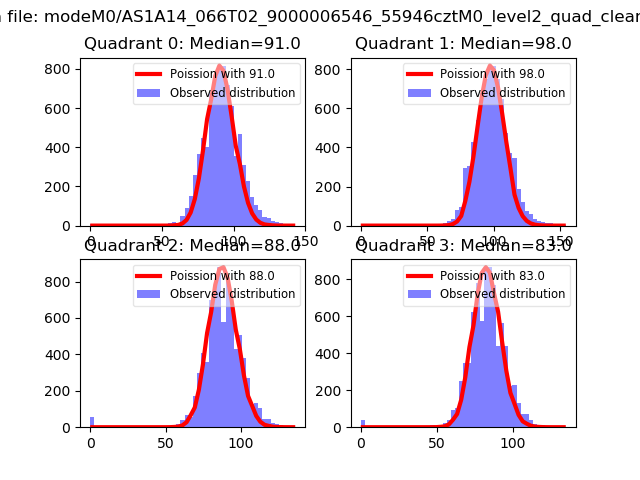 |
 |
| Quadrant-wise count rates Data is divided into 100 sec bins |
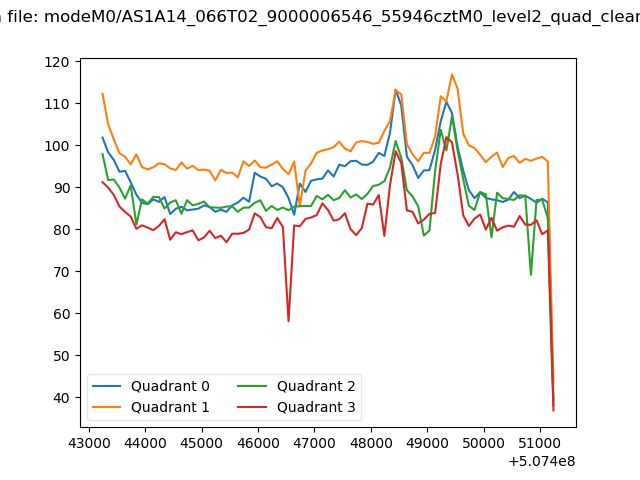 |
|
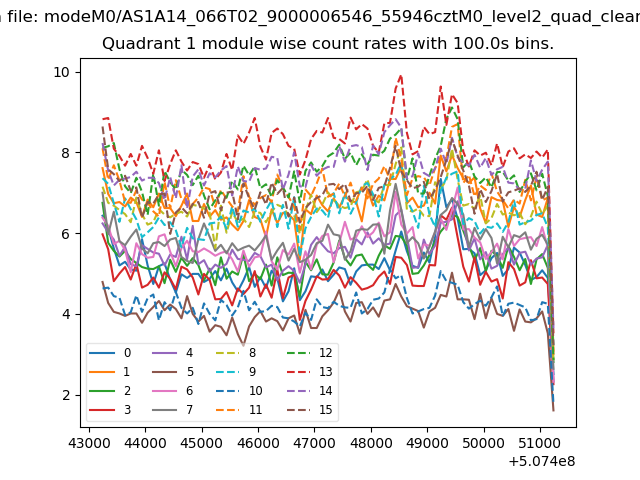
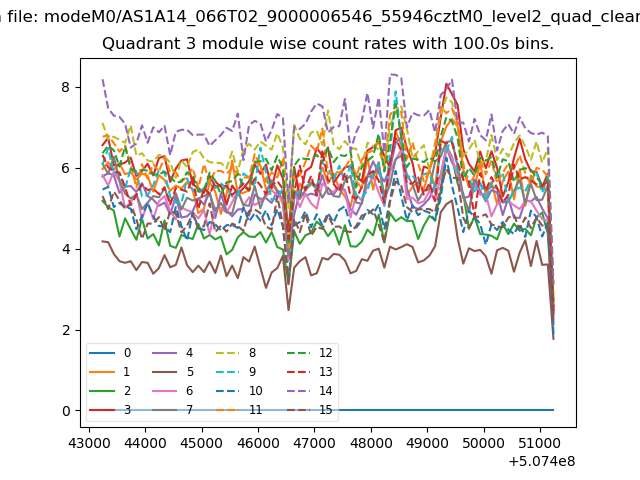
| Module-wise count rates for Quadrant A Data is divided into 100 sec bins |
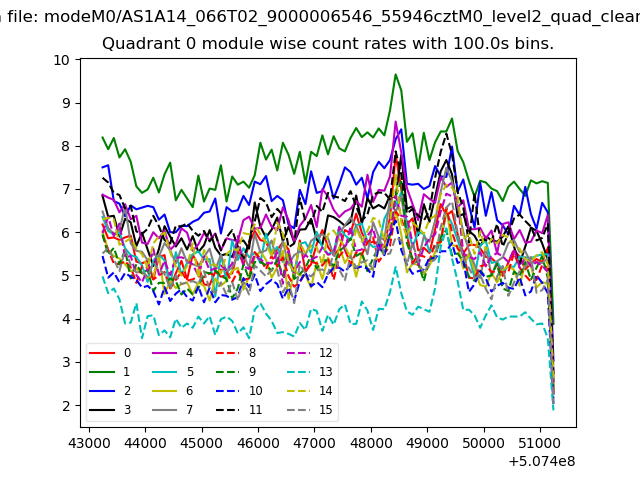 |
 |
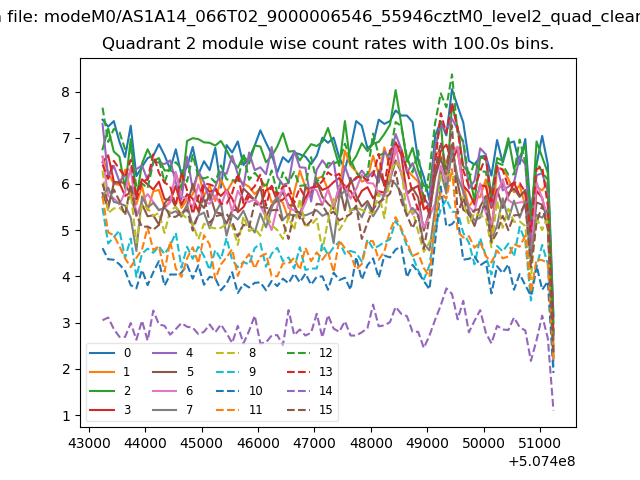
| Module-wise count rates for Quadrant B Data is divided into 100 sec bins |
 |
 |
| Module-wise count rates for Quadrant C Data is divided into 100 sec bins |
 |
 |
| Module-wise count rates for Quadrant D Data is divided into 100 sec bins |
 |
 |
| Parameter | Plot |
|---|---|
| CZT HV Monitor | 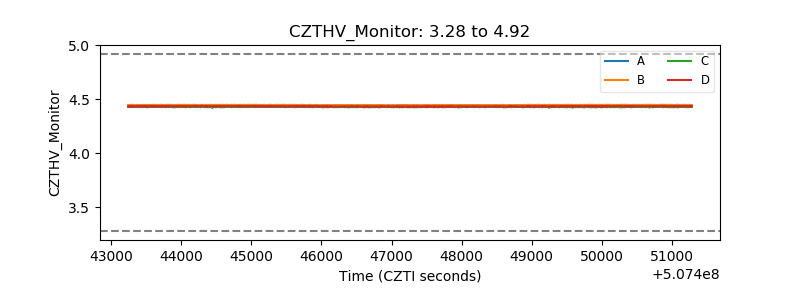 |
| D_VDD | 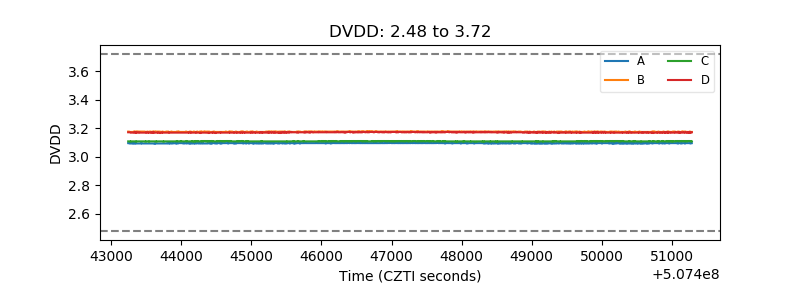 |
| Temperature 1 | 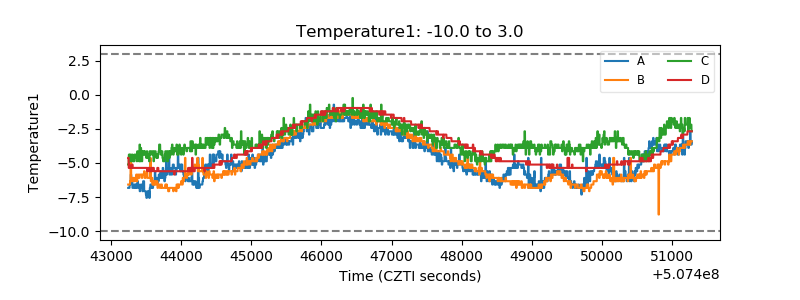 |
| Veto HV Monitor | 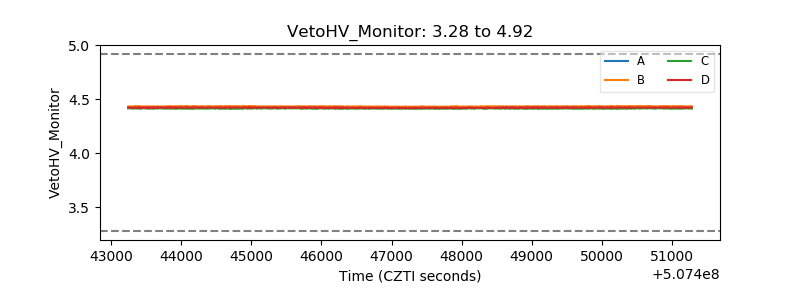 |
| Veto LLD | 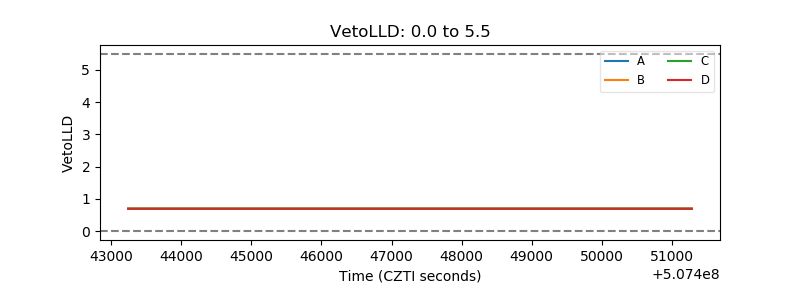 |
| Alpha Counter | 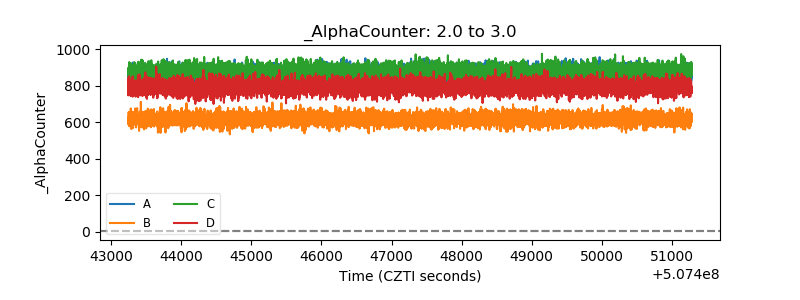 |
| _CPM_Rate | 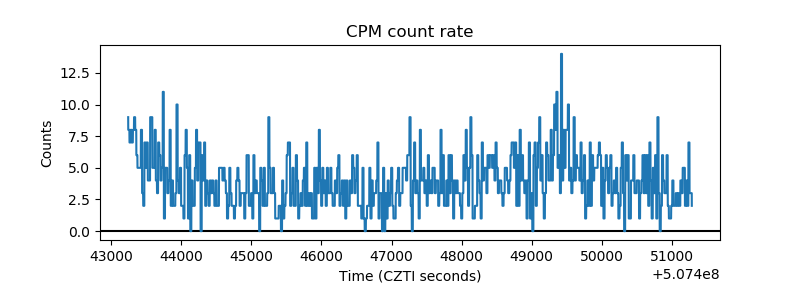 |
| CZT Counter | 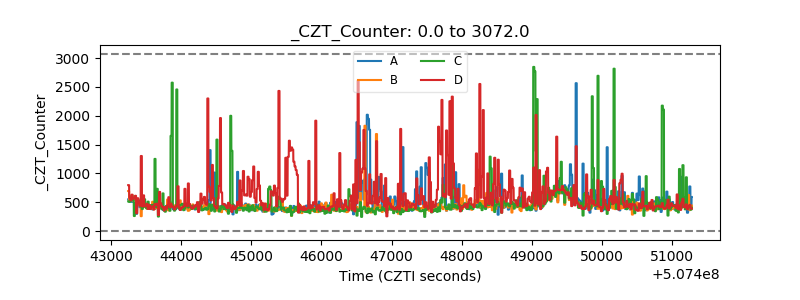 |
| +2.5 Volts monitor | 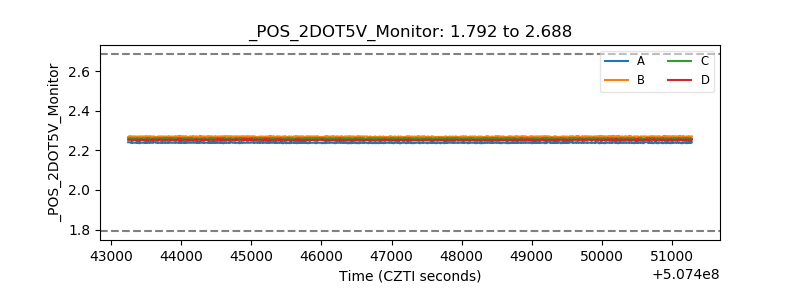 |
| +5 Volts monitor |  |
| _ROLL_ROT | 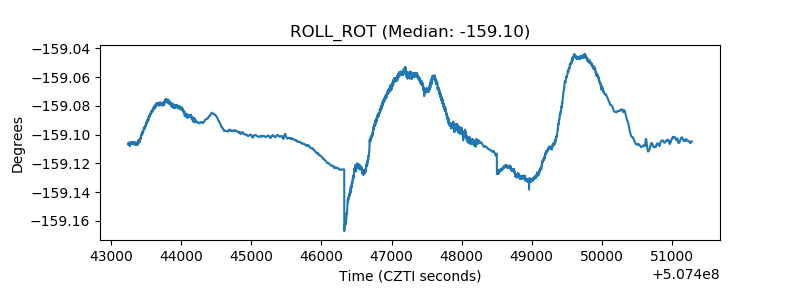 |
| _Roll_DEC | 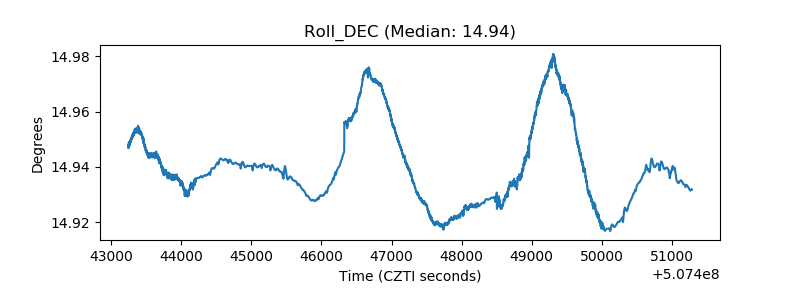 |
| _Roll_RA | 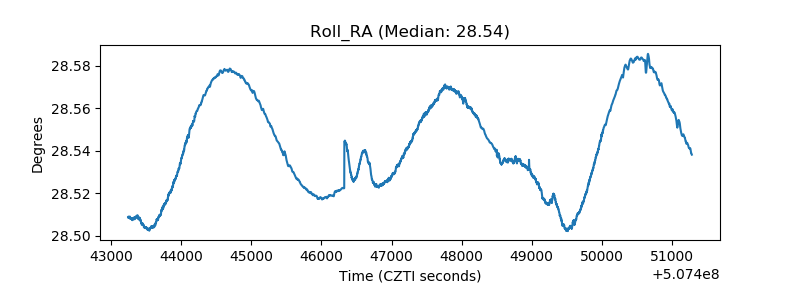 |
| Veto Counter | 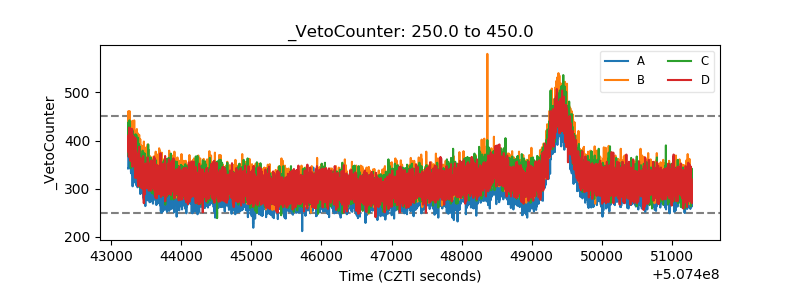 |