| Param | Original file | Final file |
|---|---|---|
| Filename | modeM0/AS1A14_066T02_9000006546_55949cztM0_level2.fits | modeM0/AS1A14_066T02_9000006546_55949cztM0_level2_quad_clean.evt |
| Size (bytes) | 1,385,337,600 | 254,946,240 |
| Size | 1.3 GB | 243.1 MB |
| Events in quadrant A | 11,141,992 | 1,658,442 |
| Events in quadrant B | 8,630,126 | 1,825,426 |
| Events in quadrant C | 12,138,098 | 1,554,480 |
| Events in quadrant D | 17,903,828 | 1,374,769 |
| Mode M9 | |||
|---|---|---|---|
| Quadrant | BADHDUFLAG | Total packets | Discarded packets |
| A | 0 | 12 | 0 |
| B | 0 | 12 | 0 |
| C | 0 | 12 | 0 |
| D | 0 | 12 | 0 |
| Mode M0 | |||
|---|---|---|---|
| Quadrant | BADHDUFLAG | Total packets | Discarded packets |
| A | 0 | 46538 | 3 |
| B | 0 | 39818 | 3 |
| C | 0 | 50592 | 3 |
| D | 0 | 66363 | 9 |
| Mode SS | |||
|---|---|---|---|
| Quadrant | BADHDUFLAG | Total packets | Discarded packets |
| A | 0 | 386 | 0 |
| B | 0 | 386 | 0 |
| C | 0 | 386 | 0 |
| D | 0 | 386 | 0 |
| Quadrant | Total seconds | Saturated seconds | Saturation percentage |
|---|---|---|---|
| A | 18947 | 906 | 4.781760% |
| B | 18948 | 434 | 2.290479% |
| C | 18948 | 1402 | 7.399198% |
| D | 18946 | 2584 | 13.638763% |
Noise dominated data is calculated using 1-second bins in cleaned event files. If a bin has >2000 counts, and if more than 50% of those come from <1% of pixels, then it is considered to be noise-dominated and hence unusable.
| Quadrant | # 1 sec bins | Bins with >0 counts | Bins with >2000 counts | High rate bins dominated by noise | Noise dominated (total time) | Noise dominated (detector-on time) | Marked lightcurve |
|---|---|---|---|---|---|---|---|
| A | 20187 | 18950 | 506 | 506 | 2.51% | 2.67% | 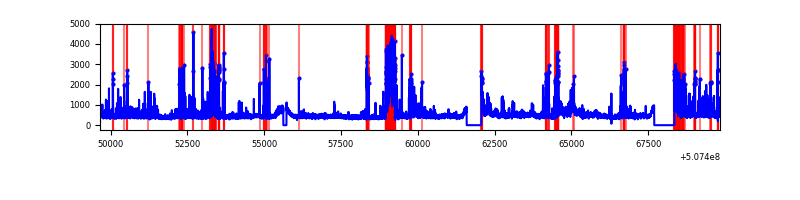 |
| B | 20188 | 18951 | 26 | 26 | 0.13% | 0.14% | 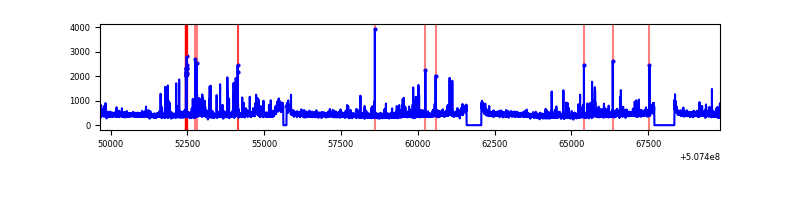 |
| C | 20188 | 18951 | 743 | 743 | 3.68% | 3.92% | 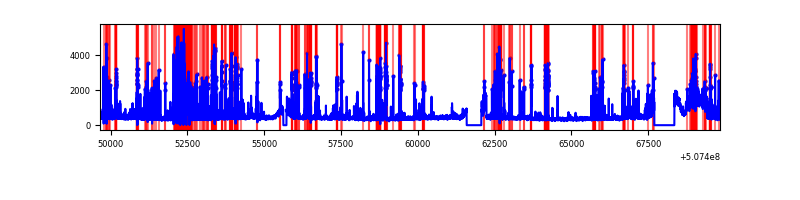 |
| D | 20188 | 18950 | 2424 | 2424 | 12.01% | 12.79% | 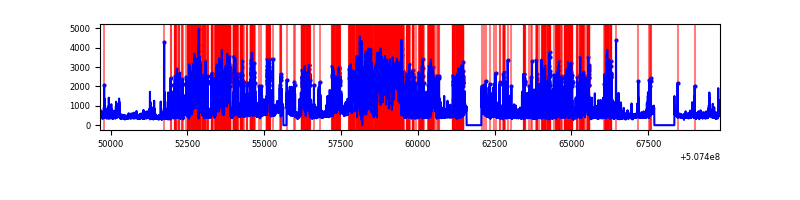 |
Top three noisy pixels from each quadrant. If the there are fewer than three noisy pixels in the level2.evt file, extra rows are filled as -1
| Pixel properties | Quadrant properties | ||||||
|---|---|---|---|---|---|---|---|
| Quadrant | DetID | PixID | Counts | Sigma | Mean | Median | Sigma |
| A | 7 | 64 | 1167018 | 2358.06 | 1996 | 1939 | 494.1 |
| A | 12 | 115 | 907270 | 1832.35 | 1996 | 1939 | 494.1 |
| A | 3 | 14 | 803260 | 1621.83 | 1996 | 1939 | 494.1 |
| B | 0 | 171 | 153562 | 357.3 | 1984 | 1908 | 424.4 |
| B | 4 | 21 | 115517 | 267.67 | 1984 | 1908 | 424.4 |
| B | 0 | 213 | 110395 | 255.6 | 1984 | 1908 | 424.4 |
| C | 12 | 252 | 2411155 | 4646.05 | 1888 | 1871 | 518.6 |
| C | 1 | 29 | 923804 | 1777.85 | 1888 | 1871 | 518.6 |
| C | 6 | 9 | 612700 | 1177.92 | 1888 | 1871 | 518.6 |
| D | 11 | 129 | 8814455 | 16570.09 | 1875 | 1793 | 531.8 |
| D | 1 | 31 | 328858 | 614.97 | 1875 | 1793 | 531.8 |
| D | 2 | 31 | 270496 | 505.23 | 1875 | 1793 | 531.8 |
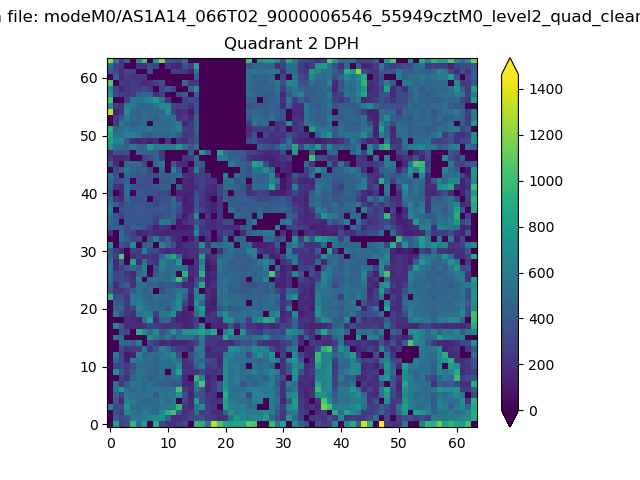
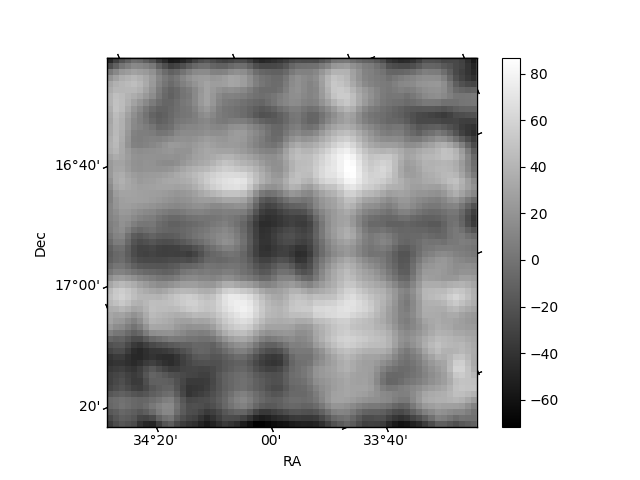
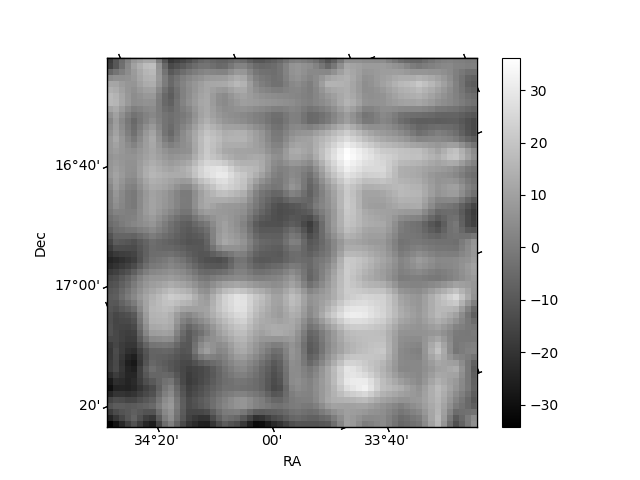
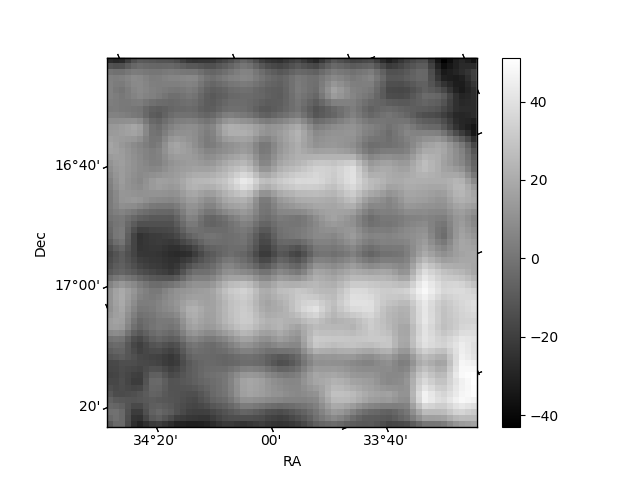
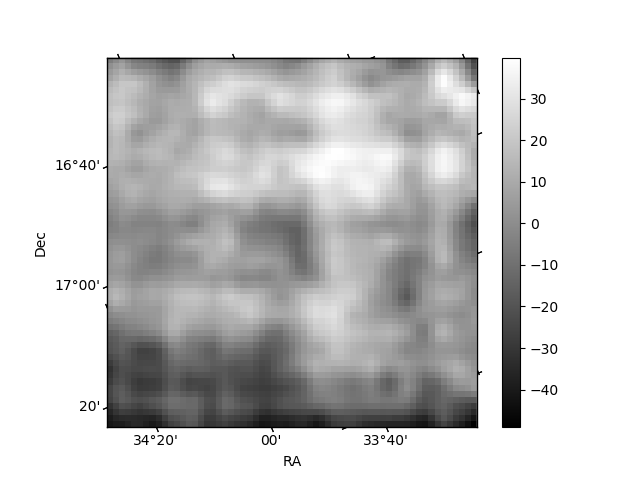
Histogram calculated using DETX and DETY for each event in the final _common_clean file
| Quadrant A | 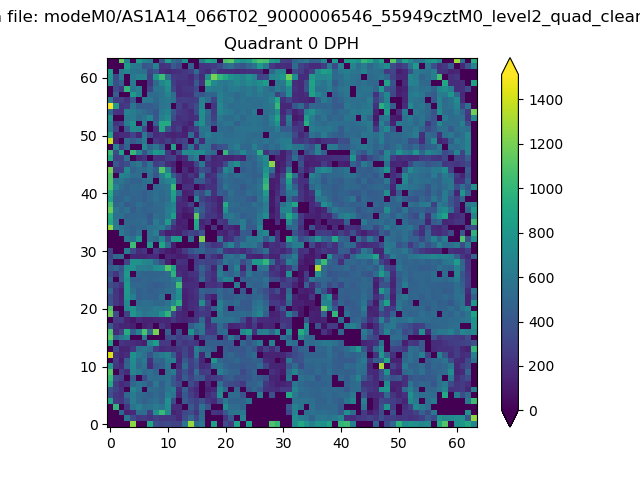 |
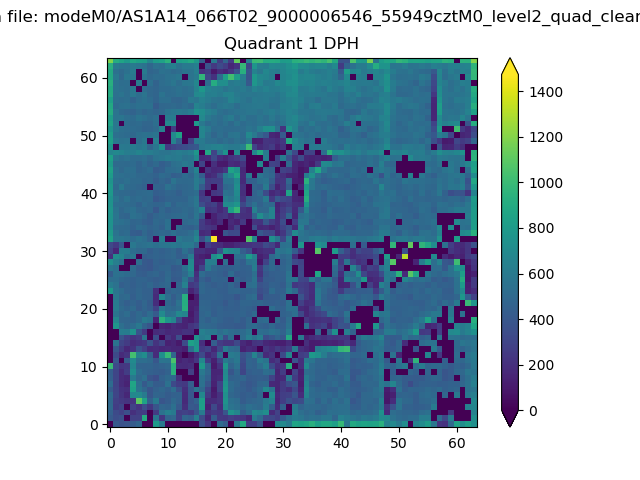 |
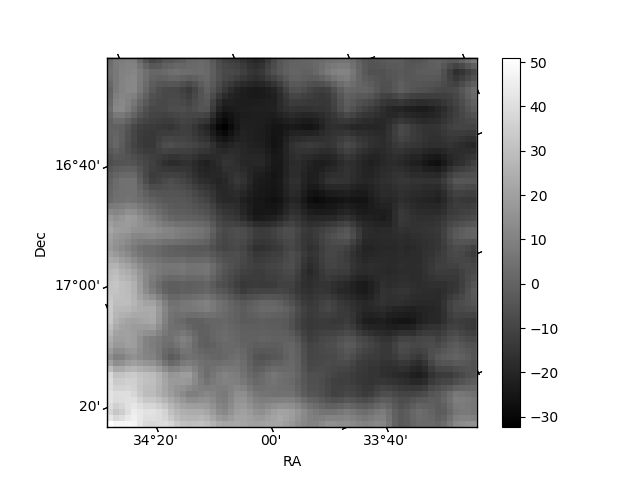
Quadrant B |
|---|---|---|---|
| Quadrant D | 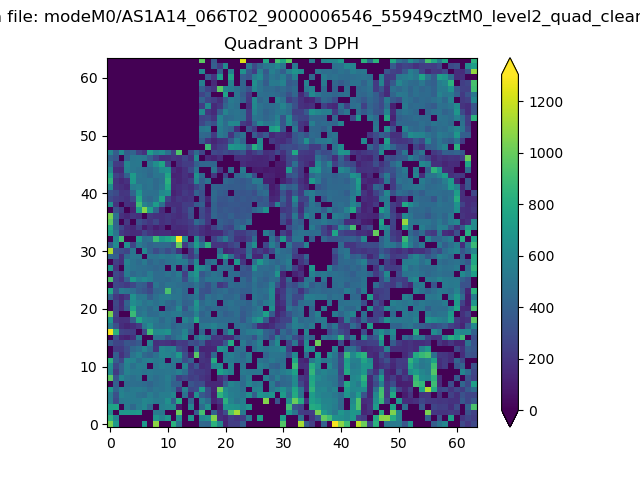 |
 |
Quadrant C |
| Plot type | Count rate plots | Images |
|---|---|---|
| Comparison with Poisson distribution Blue bars denote a histogram of data divided into 1 sec bins. Red curve is a Poisson curve with rate = median count rate of data. |
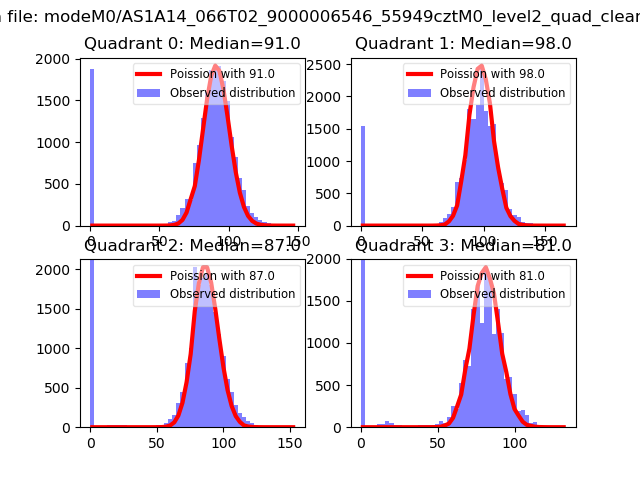 |
 |
| Quadrant-wise count rates Data is divided into 100 sec bins |
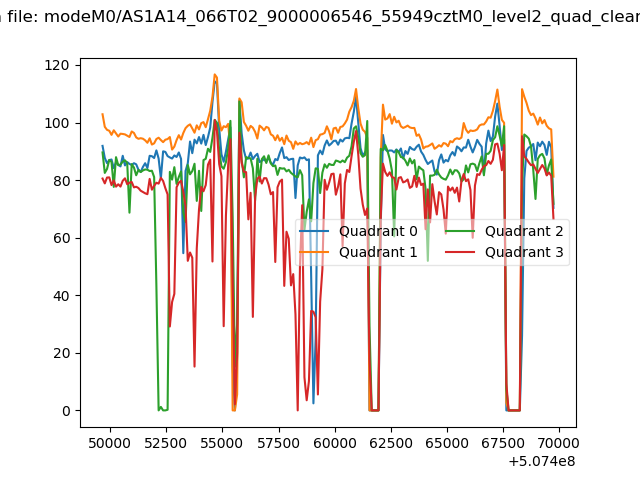 |
|
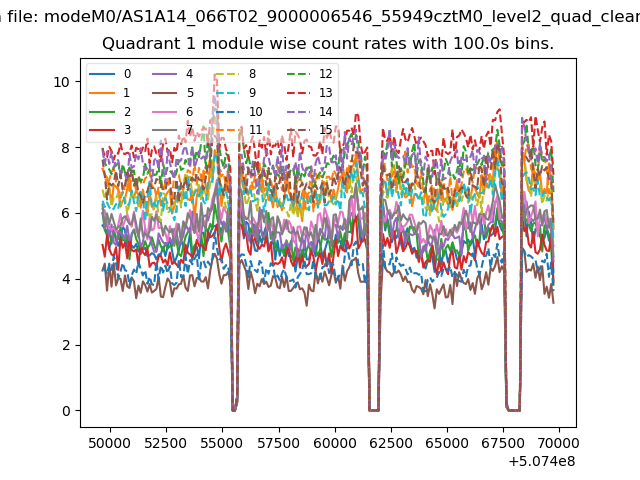
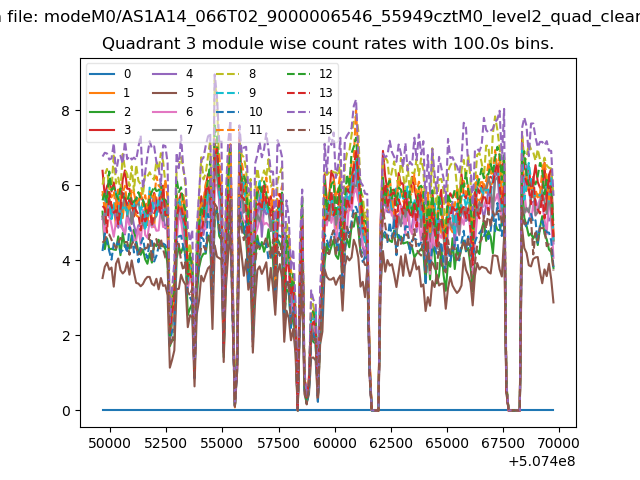
| Module-wise count rates for Quadrant A Data is divided into 100 sec bins |
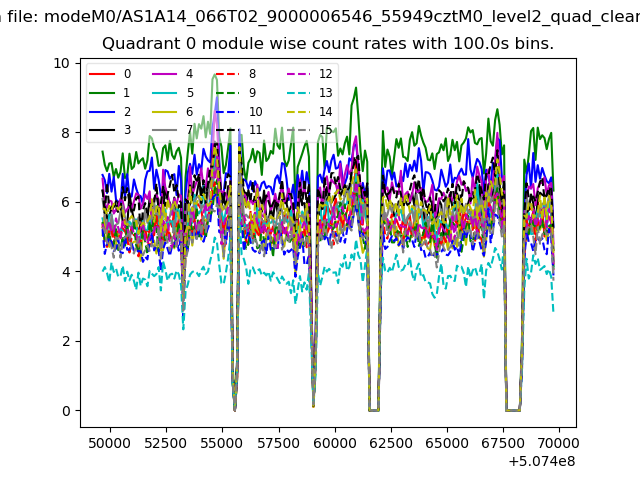 |
 |
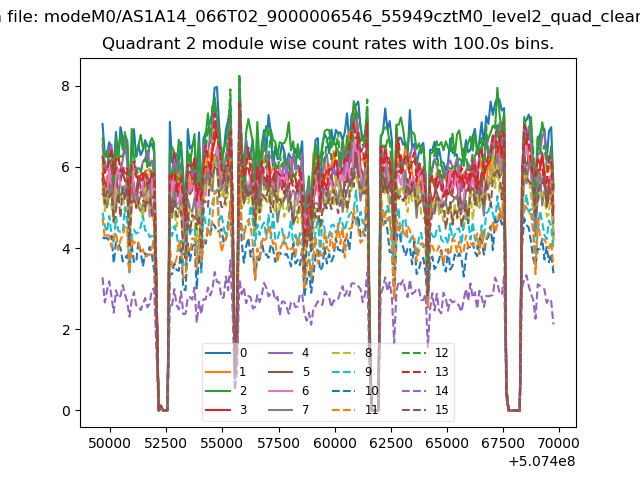
| Module-wise count rates for Quadrant B Data is divided into 100 sec bins |
 |
 |
| Module-wise count rates for Quadrant C Data is divided into 100 sec bins |
 |
 |
| Module-wise count rates for Quadrant D Data is divided into 100 sec bins |
 |
 |
| Parameter | Plot |
|---|---|
| CZT HV Monitor | 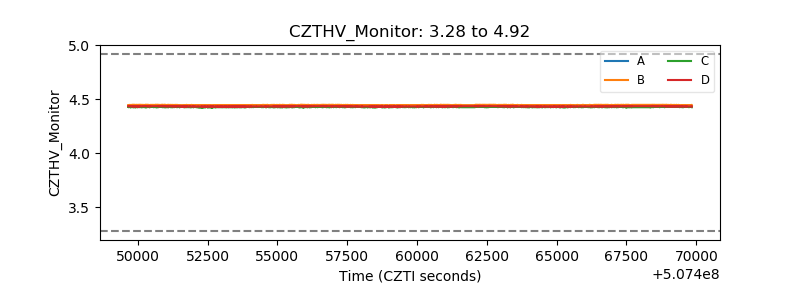 |
| D_VDD | 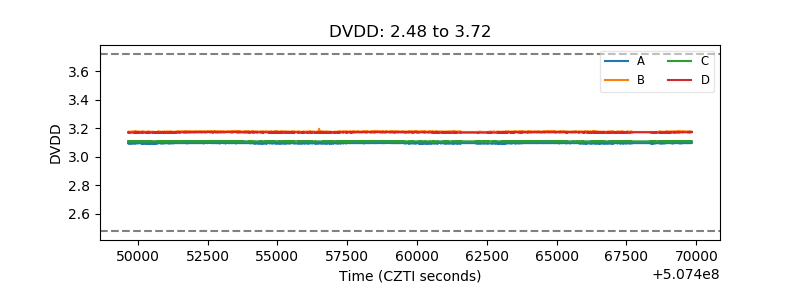 |
| Temperature 1 | 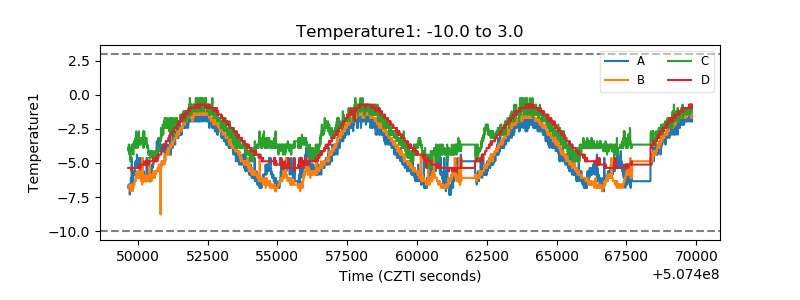 |
| Veto HV Monitor | 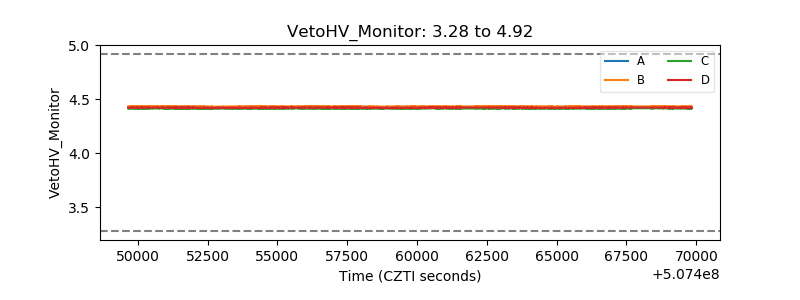 |
| Veto LLD | 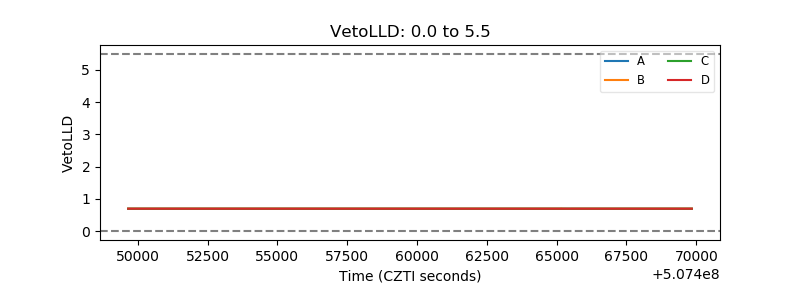 |
| Alpha Counter | 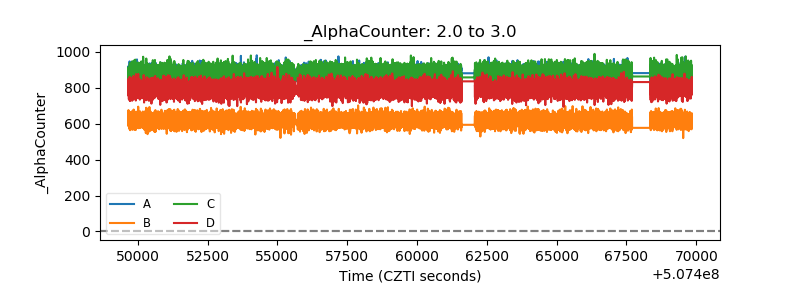 |
| _CPM_Rate | 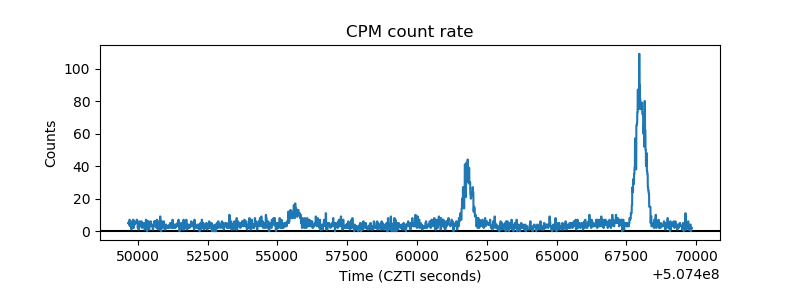 |
| CZT Counter | 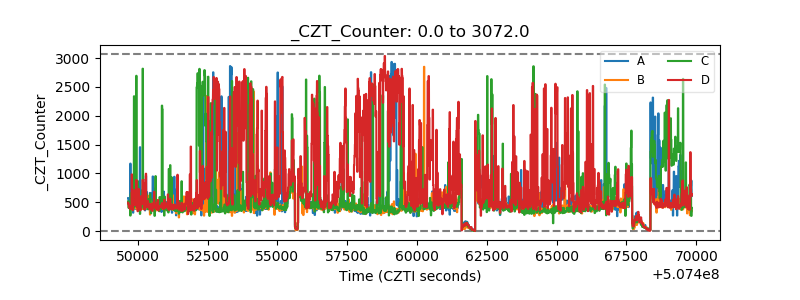 |
| +2.5 Volts monitor | 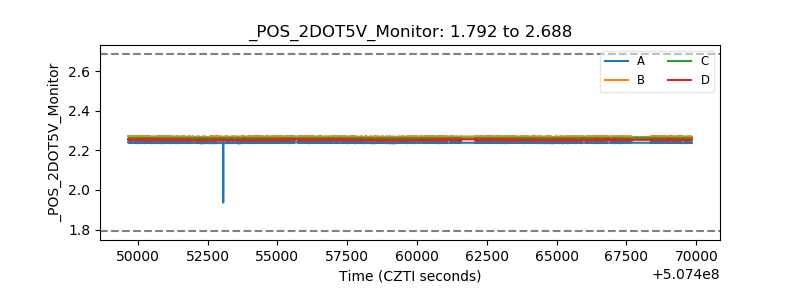 |
| +5 Volts monitor | 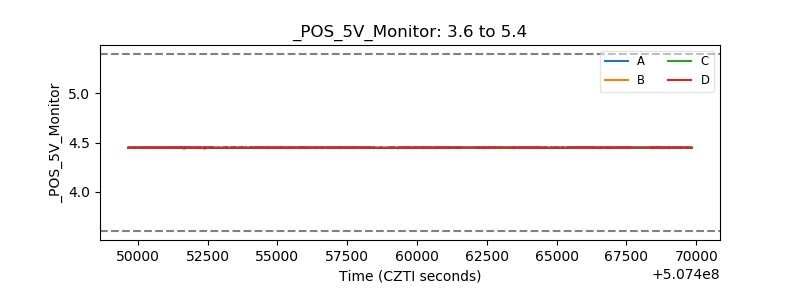 |
| _ROLL_ROT | 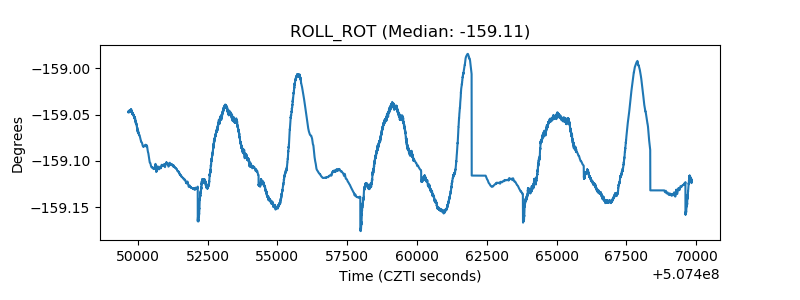 |
| _Roll_DEC | 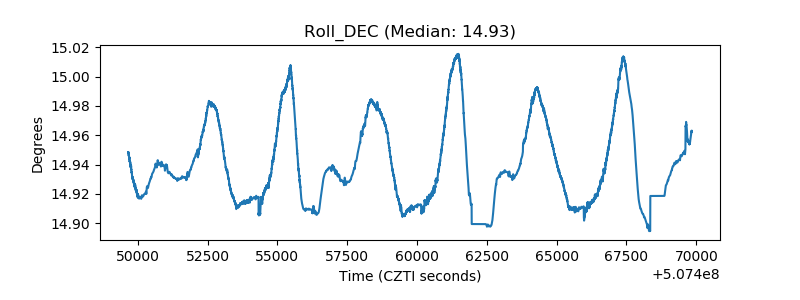 |
| _Roll_RA | 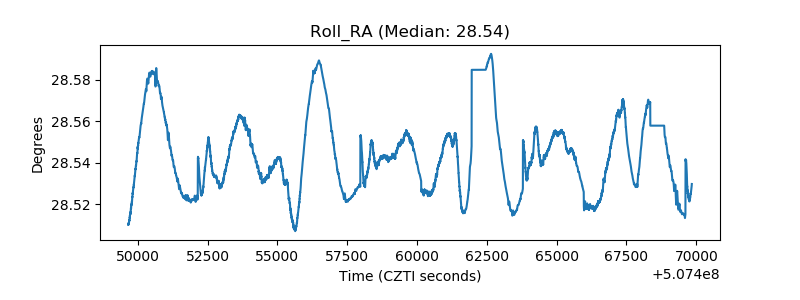 |
| Veto Counter | 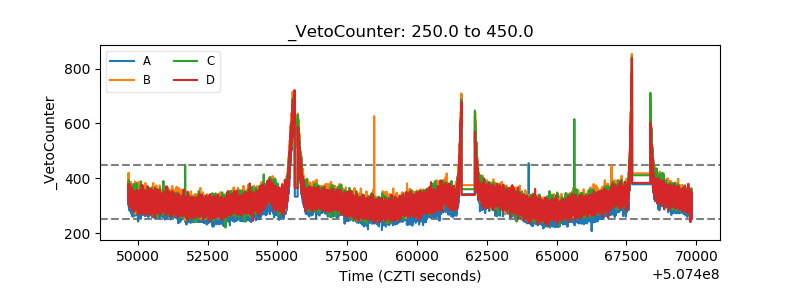 |