| Param | Original file | Final file |
|---|---|---|
| Filename | modeM0/AS1A14_066T02_9000006546_55950cztM0_level2.fits | modeM0/AS1A14_066T02_9000006546_55950cztM0_level2_quad_clean.evt |
| Size (bytes) | 505,748,160 | 90,023,040 |
| Size | 482.3 MB | 85.9 MB |
| Events in quadrant A | 6,073,157 | 556,997 |
| Events in quadrant B | 2,968,159 | 641,896 |
| Events in quadrant C | 3,982,188 | 565,443 |
| Events in quadrant D | 5,200,716 | 514,112 |
| Mode M9 | |||
|---|---|---|---|
| Quadrant | BADHDUFLAG | Total packets | Discarded packets |
| A | 0 | 8 | 0 |
| B | 0 | 8 | 0 |
| C | 0 | 8 | 0 |
| D | 0 | 8 | 0 |
| Mode M0 | |||
|---|---|---|---|
| Quadrant | BADHDUFLAG | Total packets | Discarded packets |
| A | 0 | 22369 | 1 |
| B | 0 | 13586 | 1 |
| C | 0 | 16497 | 1 |
| D | 0 | 19806 | 1 |
| Mode SS | |||
|---|---|---|---|
| Quadrant | BADHDUFLAG | Total packets | Discarded packets |
| A | 0 | 132 | 0 |
| B | 0 | 132 | 0 |
| C | 0 | 132 | 0 |
| D | 0 | 132 | 0 |
| Quadrant | Total seconds | Saturated seconds | Saturation percentage |
|---|---|---|---|
| A | 6402 | 677 | 10.574820% |
| B | 6402 | 80 | 1.249609% |
| C | 6402 | 106 | 1.655733% |
| D | 6402 | 510 | 7.966261% |
Noise dominated data is calculated using 1-second bins in cleaned event files. If a bin has >2000 counts, and if more than 50% of those come from <1% of pixels, then it is considered to be noise-dominated and hence unusable.
| Quadrant | # 1 sec bins | Bins with >0 counts | Bins with >2000 counts | High rate bins dominated by noise | Noise dominated (total time) | Noise dominated (detector-on time) | Marked lightcurve |
|---|---|---|---|---|---|---|---|
| A | 7252 | 6403 | 530 | 530 | 7.31% | 8.28% | 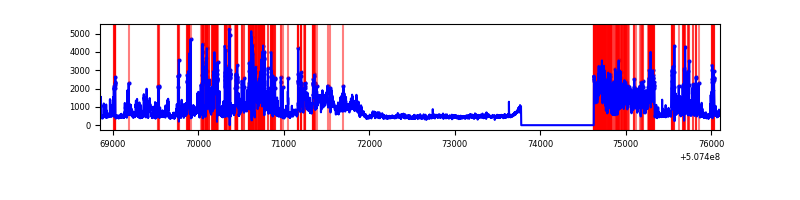 |
| B | 7252 | 6403 | 18 | 18 | 0.25% | 0.28% | 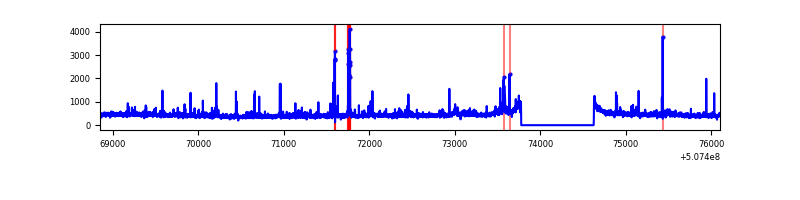 |
| C | 7252 | 6403 | 99 | 99 | 1.37% | 1.55% | 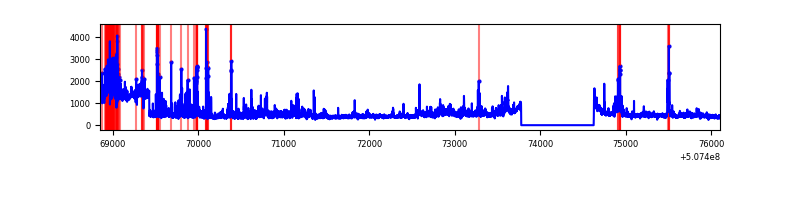 |
| D | 7252 | 6403 | 485 | 485 | 6.69% | 7.57% | 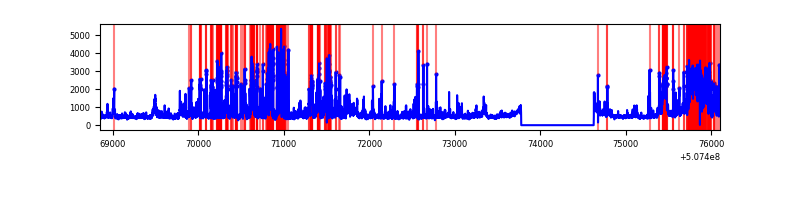 |
Top three noisy pixels from each quadrant. If the there are fewer than three noisy pixels in the level2.evt file, extra rows are filled as -1
| Pixel properties | Quadrant properties | ||||||
|---|---|---|---|---|---|---|---|
| Quadrant | DetID | PixID | Counts | Sigma | Mean | Median | Sigma |
| A | 12 | 115 | 2165445 | 13299.16 | 646 | 630 | 162.8 |
| A | 7 | 64 | 1088831 | 6685.17 | 646 | 630 | 162.8 |
| A | 3 | 14 | 145484 | 889.89 | 646 | 630 | 162.8 |
| B | 7 | 252 | 75834 | 525.62 | 663 | 640 | 143.1 |
| B | 4 | 21 | 53046 | 366.33 | 663 | 640 | 143.1 |
| B | 5 | 185 | 44762 | 308.42 | 663 | 640 | 143.1 |
| C | 6 | 9 | 732615 | 4059.54 | 648 | 640 | 180.3 |
| C | 1 | 29 | 480086 | 2659.01 | 648 | 640 | 180.3 |
| C | 12 | 252 | 76906 | 422.97 | 648 | 640 | 180.3 |
| D | 11 | 129 | 1584029 | 8569.29 | 635 | 605 | 184.8 |
| D | 15 | 94 | 694353 | 3754.48 | 635 | 605 | 184.8 |
| D | 3 | 12 | 87154 | 468.39 | 635 | 605 | 184.8 |
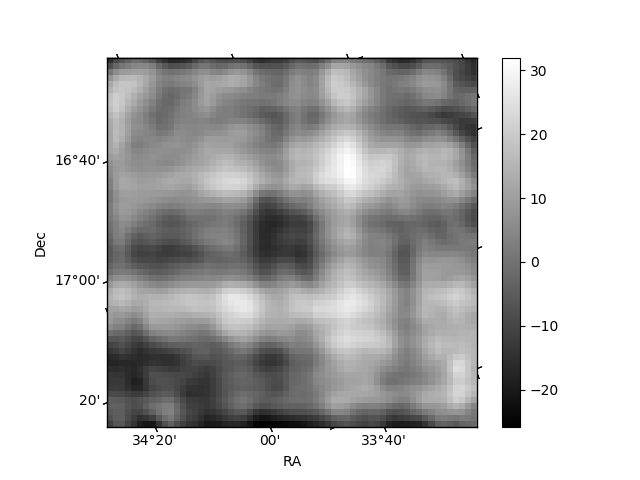
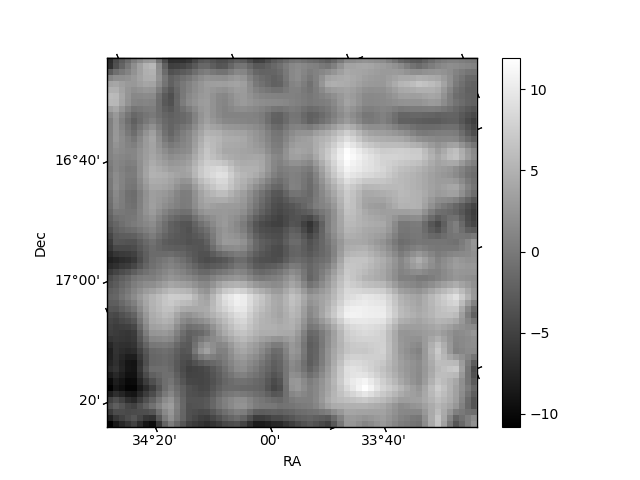
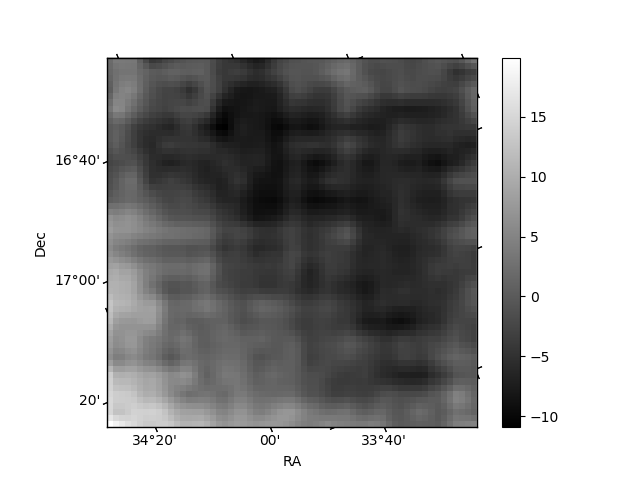
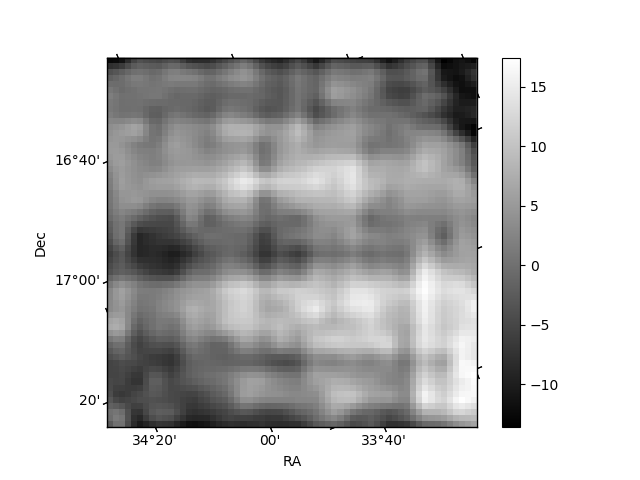
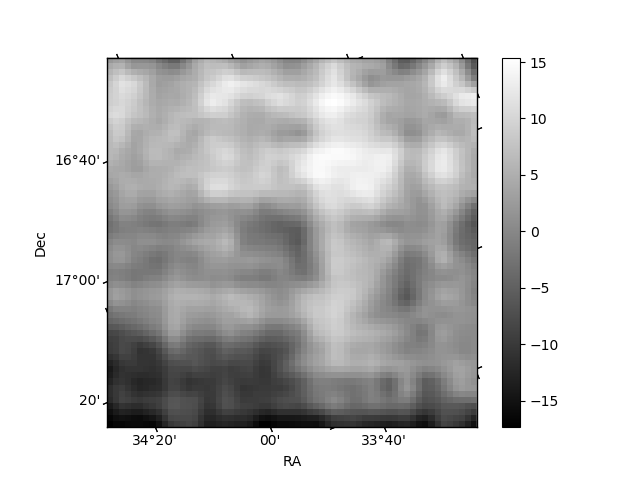
Histogram calculated using DETX and DETY for each event in the final _common_clean file
| Quadrant A | 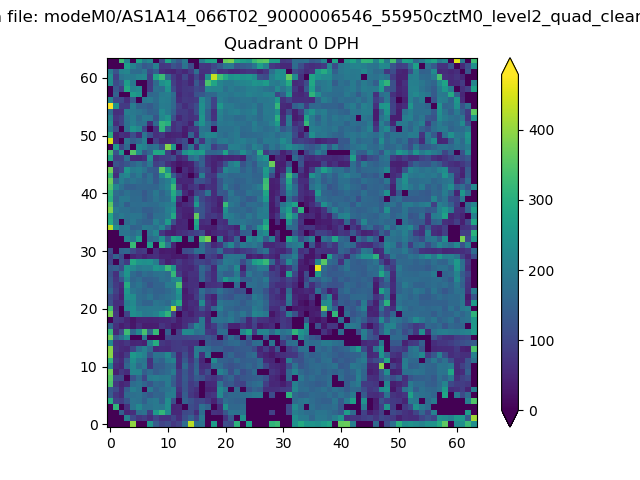 |
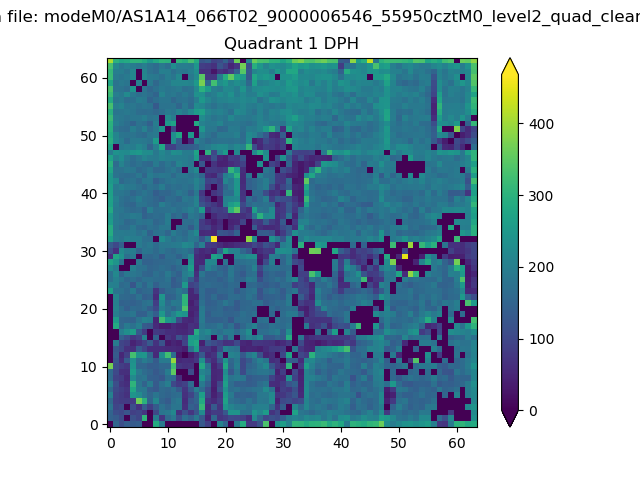 |
Quadrant B |
|---|---|---|---|
| Quadrant D | 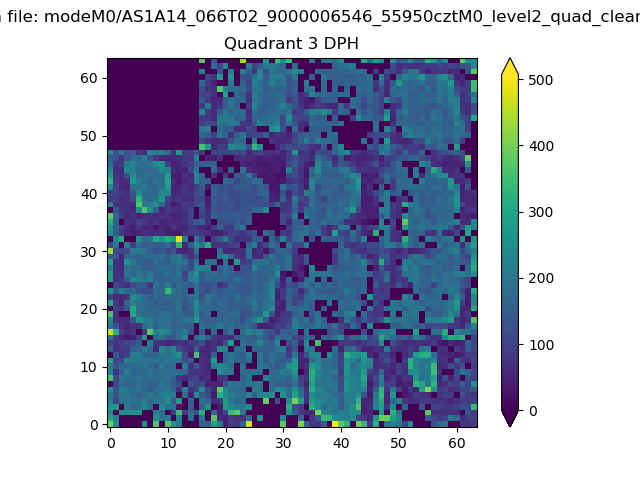 |
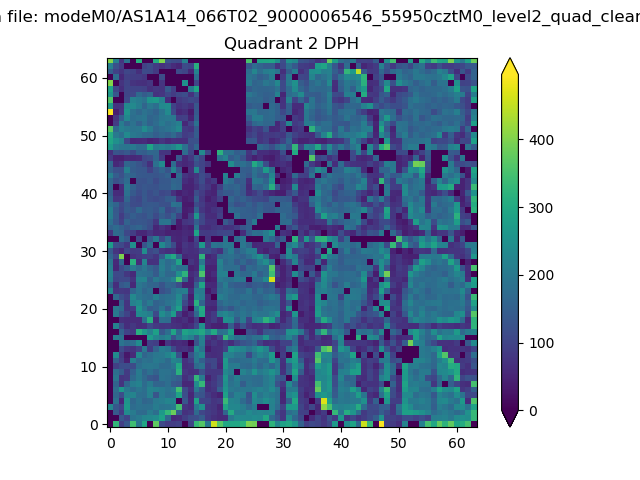 |
Quadrant C |
| Plot type | Count rate plots | Images |
|---|---|---|
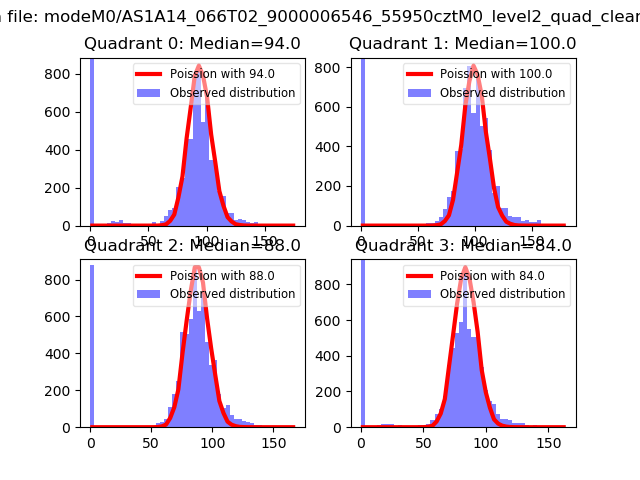
| Comparison with Poisson distribution Blue bars denote a histogram of data divided into 1 sec bins. Red curve is a Poisson curve with rate = median count rate of data. |
 |
 |
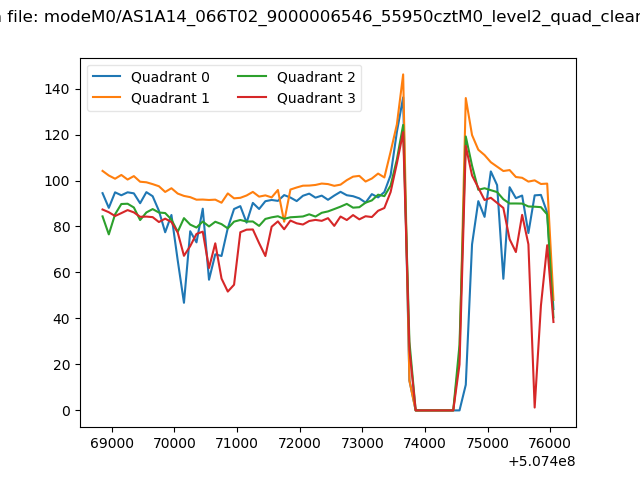
| Quadrant-wise count rates Data is divided into 100 sec bins |
 |
|
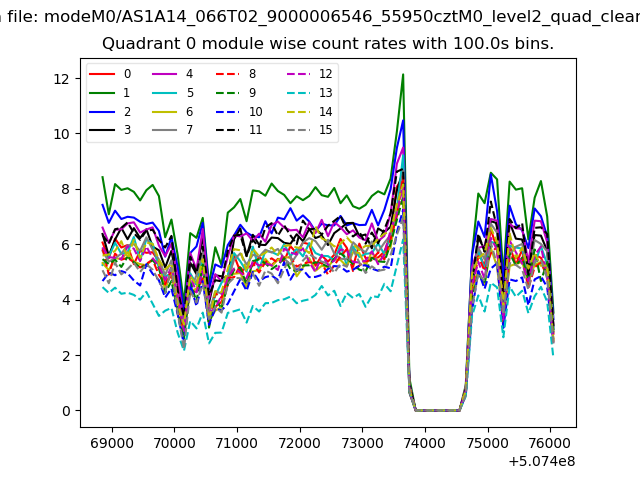
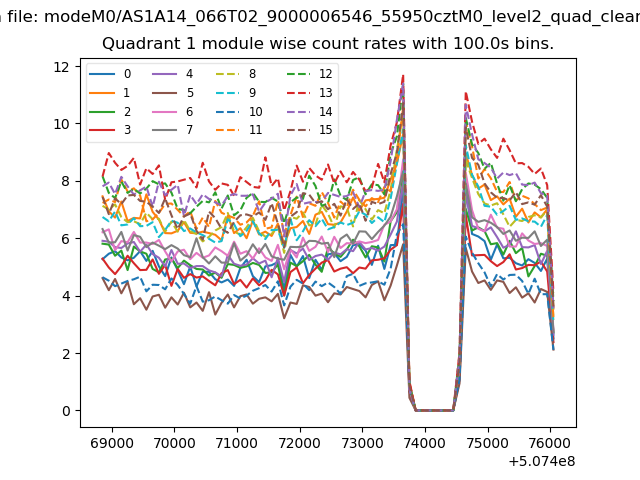
| Module-wise count rates for Quadrant A Data is divided into 100 sec bins |
 |
 |
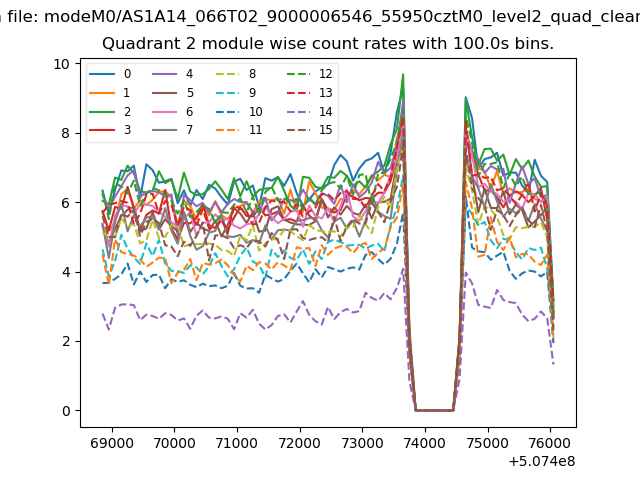
| Module-wise count rates for Quadrant B Data is divided into 100 sec bins |
 |
 |
| Module-wise count rates for Quadrant C Data is divided into 100 sec bins |
 |
 |
| Module-wise count rates for Quadrant D Data is divided into 100 sec bins |
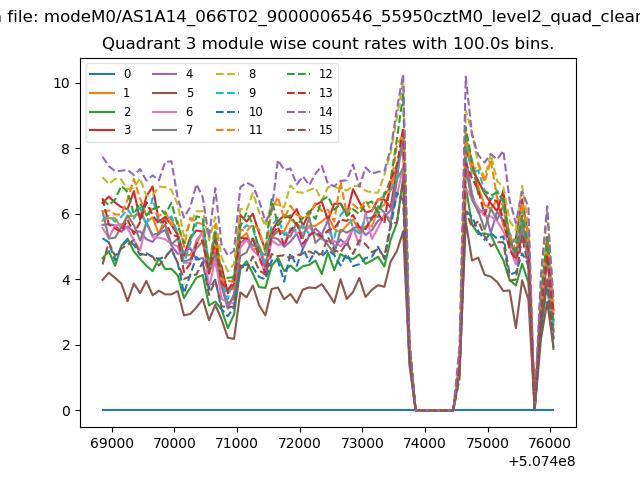 |
 |
| Parameter | Plot |
|---|---|
| CZT HV Monitor | 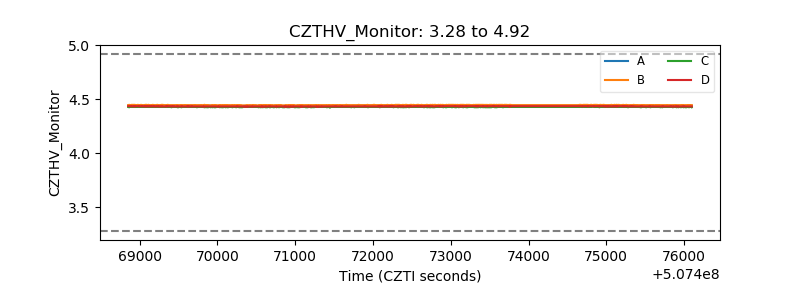 |
| D_VDD | 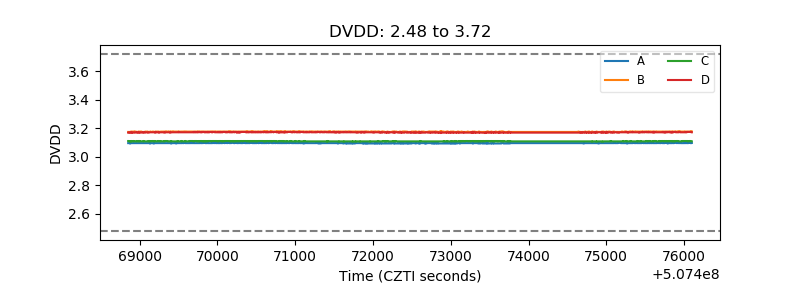 |
| Temperature 1 | 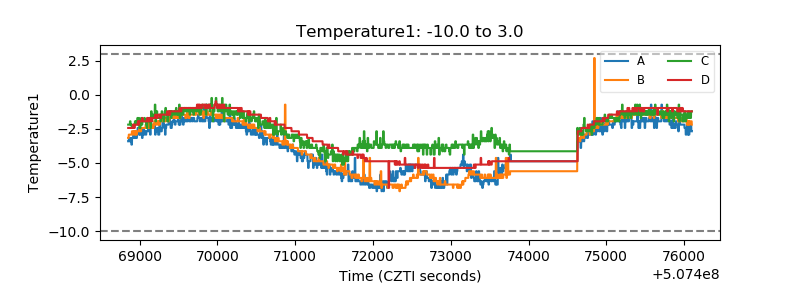 |
| Veto HV Monitor | 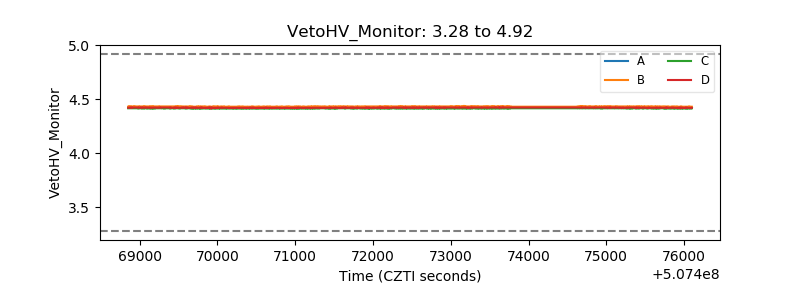 |
| Veto LLD | 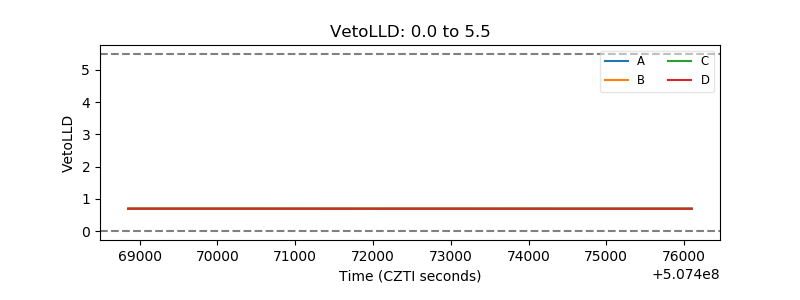 |
| Alpha Counter | 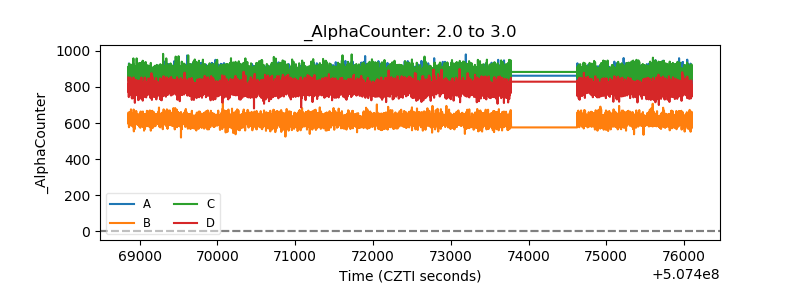 |
| _CPM_Rate | 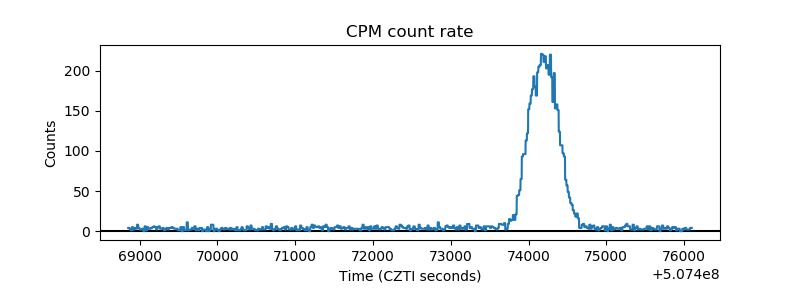 |
| CZT Counter | 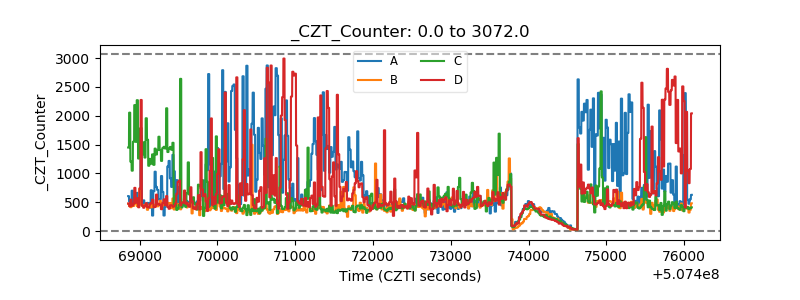 |
| +2.5 Volts monitor |  |
| +5 Volts monitor |  |
| _ROLL_ROT | 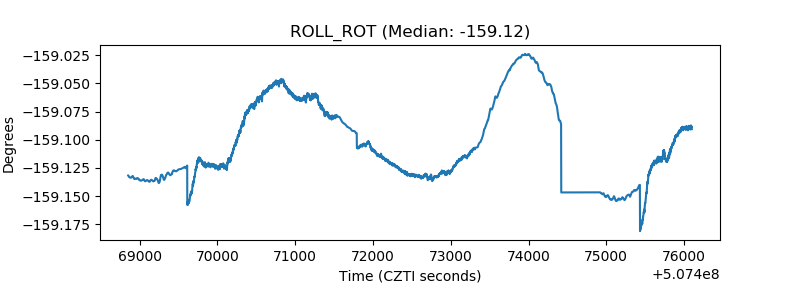 |
| _Roll_DEC | 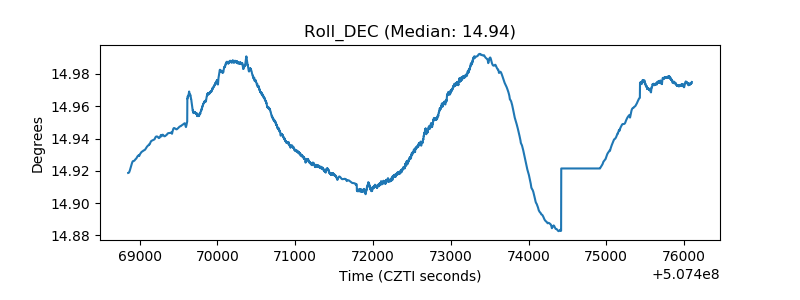 |
| _Roll_RA | 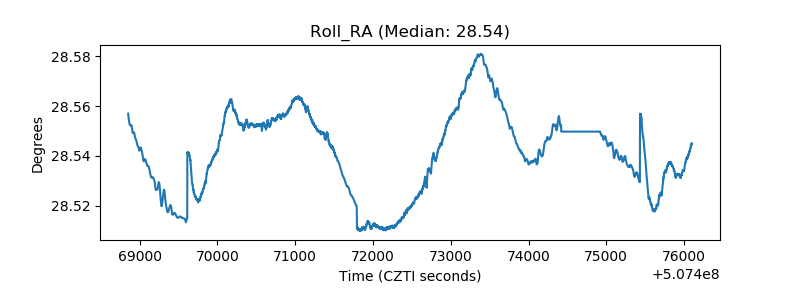 |
| Veto Counter | 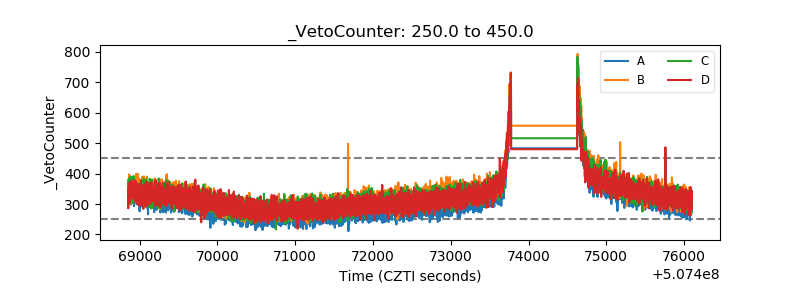 |