| Param | Original file | Final file |
|---|---|---|
| Filename | modeM0/AS1A14_066T02_9000006546_55952cztM0_level2.fits | modeM0/AS1A14_066T02_9000006546_55952cztM0_level2_quad_clean.evt |
| Size (bytes) | 511,479,360 | 90,820,800 |
| Size | 487.8 MB | 86.6 MB |
| Events in quadrant A | 4,763,860 | 600,174 |
| Events in quadrant B | 3,020,216 | 654,953 |
| Events in quadrant C | 3,656,606 | 570,919 |
| Events in quadrant D | 6,989,090 | 471,538 |
| Mode M9 | |||
|---|---|---|---|
| Quadrant | BADHDUFLAG | Total packets | Discarded packets |
| A | 0 | 10 | 0 |
| B | 0 | 10 | 0 |
| C | 0 | 10 | 0 |
| D | 0 | 10 | 0 |
| Mode M0 | |||
|---|---|---|---|
| Quadrant | BADHDUFLAG | Total packets | Discarded packets |
| A | 0 | 18774 | 2 |
| B | 0 | 13654 | 1 |
| C | 0 | 15790 | 1 |
| D | 0 | 25204 | 1 |
| Mode SS | |||
|---|---|---|---|
| Quadrant | BADHDUFLAG | Total packets | Discarded packets |
| A | 0 | 132 | 0 |
| B | 0 | 132 | 0 |
| C | 0 | 132 | 0 |
| D | 0 | 132 | 0 |
| Quadrant | Total seconds | Saturated seconds | Saturation percentage |
|---|---|---|---|
| A | 6481 | 346 | 5.338682% |
| B | 6482 | 50 | 0.771367% |
| C | 6482 | 178 | 2.746066% |
| D | 6482 | 1157 | 17.849429% |
Noise dominated data is calculated using 1-second bins in cleaned event files. If a bin has >2000 counts, and if more than 50% of those come from <1% of pixels, then it is considered to be noise-dominated and hence unusable.
| Quadrant | # 1 sec bins | Bins with >0 counts | Bins with >2000 counts | High rate bins dominated by noise | Noise dominated (total time) | Noise dominated (detector-on time) | Marked lightcurve |
|---|---|---|---|---|---|---|---|
| A | 7496 | 6482 | 255 | 255 | 3.40% | 3.93% | 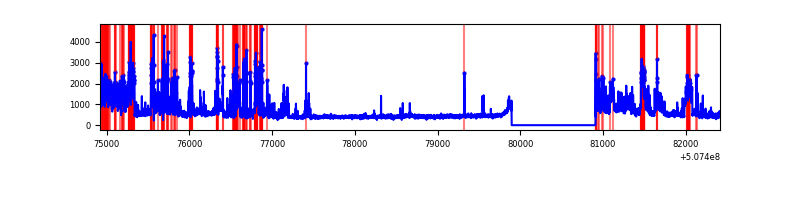 |
| B | 7497 | 6483 | 14 | 14 | 0.19% | 0.22% | 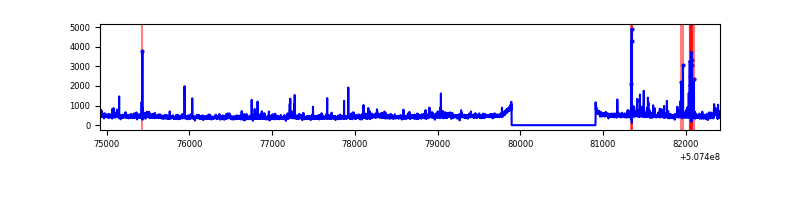 |
| C | 7497 | 6483 | 126 | 126 | 1.68% | 1.94% | 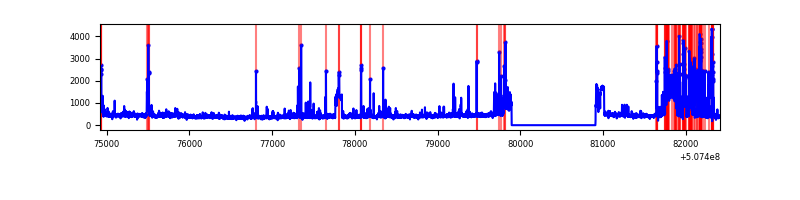 |
| D | 7497 | 6483 | 1147 | 1147 | 15.30% | 17.69% | 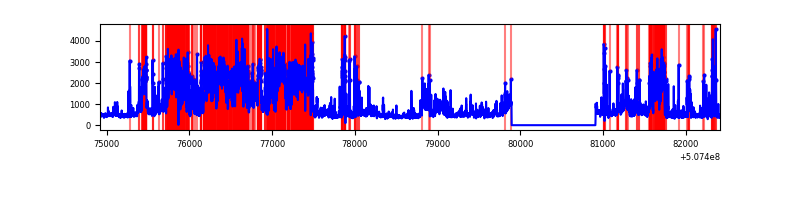 |
Top three noisy pixels from each quadrant. If the there are fewer than three noisy pixels in the level2.evt file, extra rows are filled as -1
| Pixel properties | Quadrant properties | ||||||
|---|---|---|---|---|---|---|---|
| Quadrant | DetID | PixID | Counts | Sigma | Mean | Median | Sigma |
| A | 7 | 64 | 945037 | 5624.72 | 670 | 653 | 167.9 |
| A | 12 | 115 | 766812 | 4563.22 | 670 | 653 | 167.9 |
| A | 3 | 14 | 196029 | 1163.65 | 670 | 653 | 167.9 |
| B | 0 | 171 | 117378 | 815.05 | 669 | 646 | 143.2 |
| B | 4 | 21 | 79050 | 547.43 | 669 | 646 | 143.2 |
| B | 0 | 216 | 46218 | 318.19 | 669 | 646 | 143.2 |
| C | 15 | 193 | 306055 | 1689.41 | 650 | 643 | 180.8 |
| C | 1 | 29 | 280451 | 1547.78 | 650 | 643 | 180.8 |
| C | 15 | 199 | 129095 | 710.54 | 650 | 643 | 180.8 |
| D | 11 | 129 | 4219648 | 24172.56 | 616 | 590 | 174.5 |
| D | 3 | 12 | 83234 | 473.5 | 616 | 590 | 174.5 |
| D | 7 | 129 | 50020 | 283.2 | 616 | 590 | 174.5 |
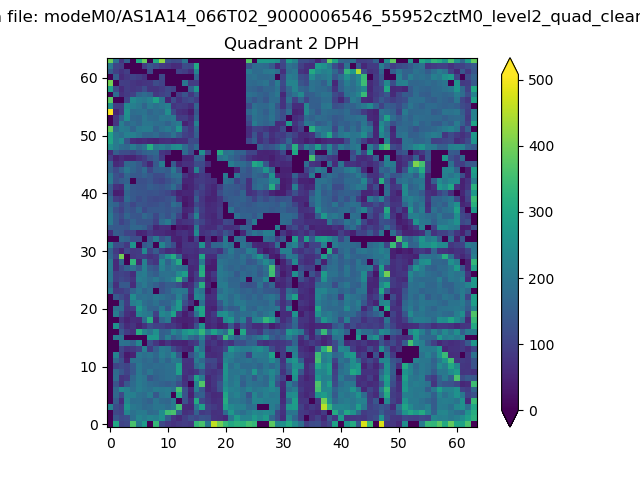
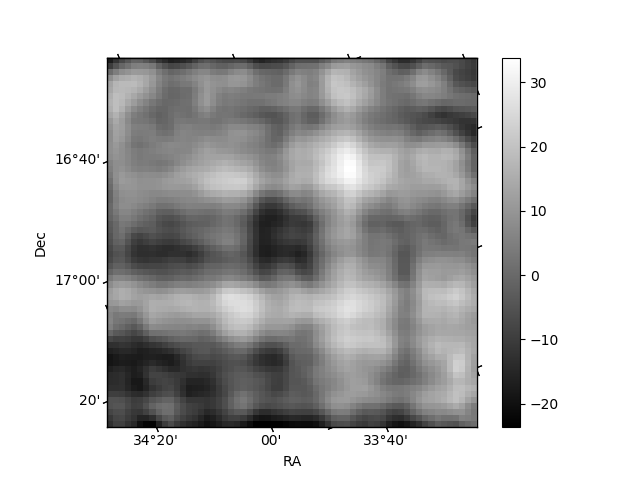
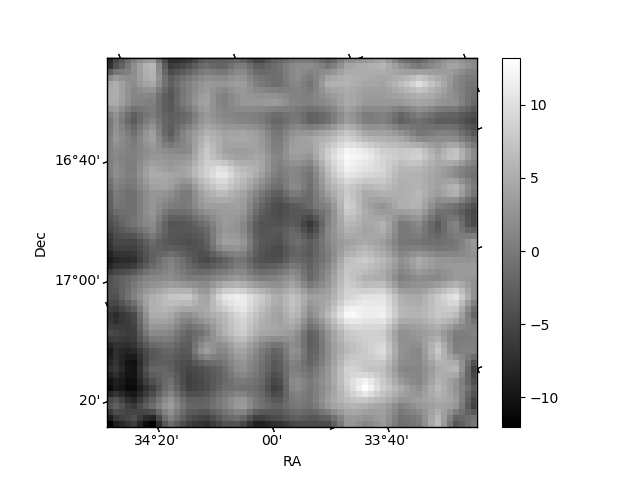
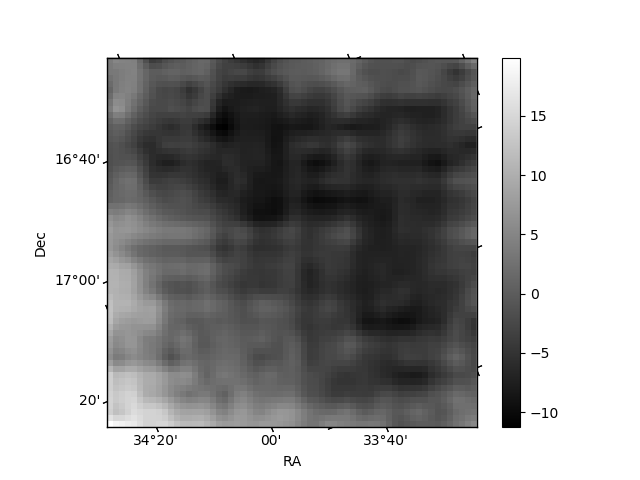
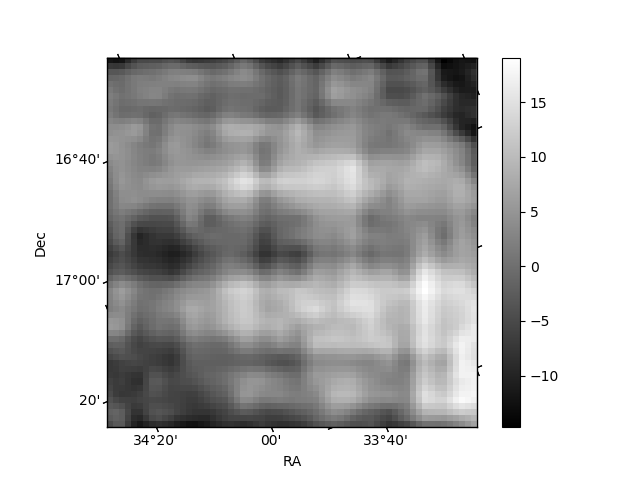
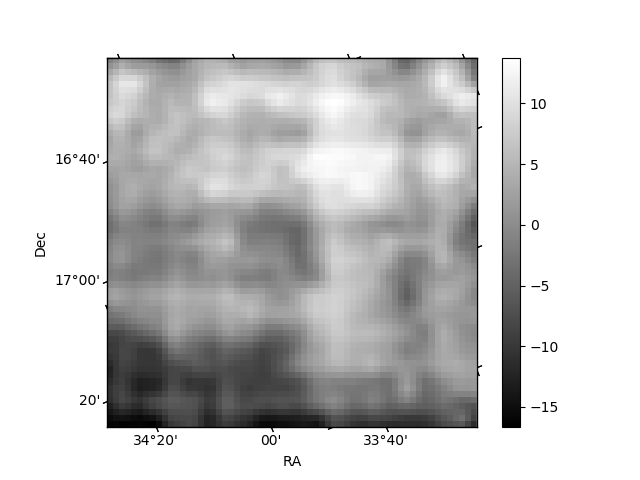
Histogram calculated using DETX and DETY for each event in the final _common_clean file
| Quadrant A | 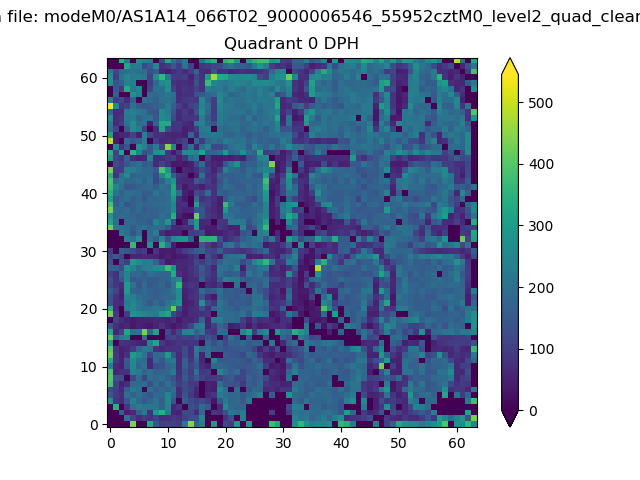 |
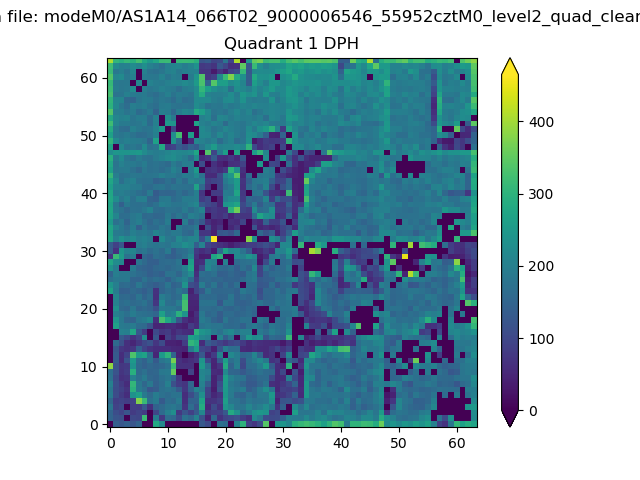 |
Quadrant B |
|---|---|---|---|
| Quadrant D | 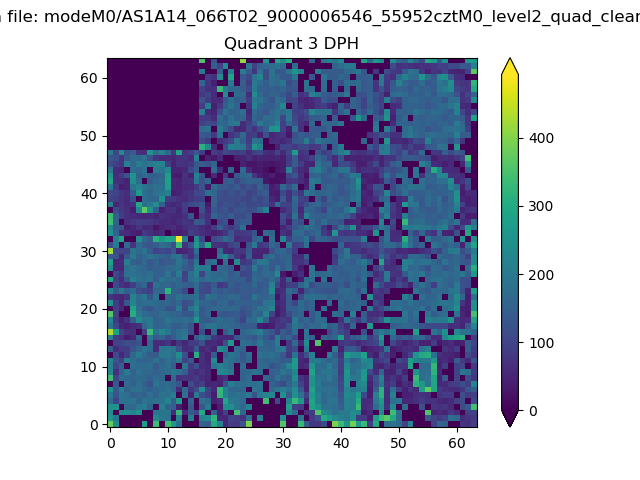 |
 |
Quadrant C |
| Plot type | Count rate plots | Images |
|---|---|---|
| Comparison with Poisson distribution Blue bars denote a histogram of data divided into 1 sec bins. Red curve is a Poisson curve with rate = median count rate of data. |
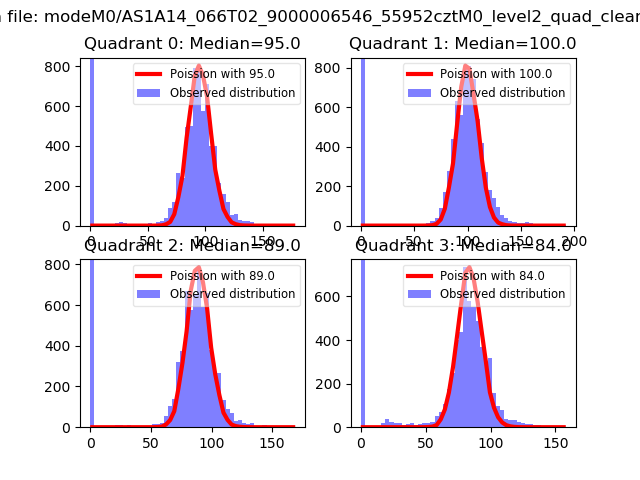 |
 |
| Quadrant-wise count rates Data is divided into 100 sec bins |
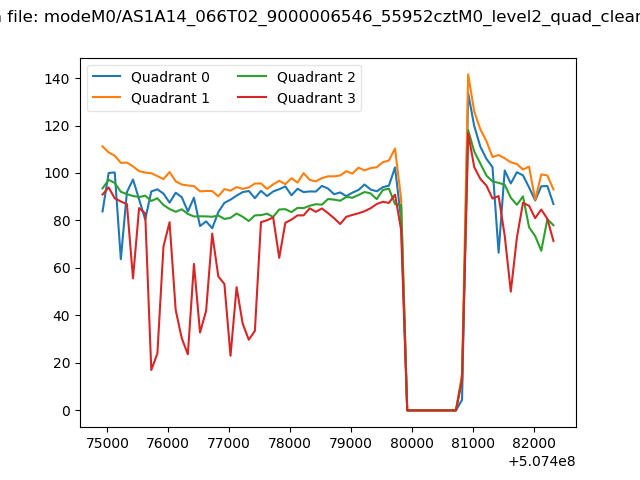 |
|
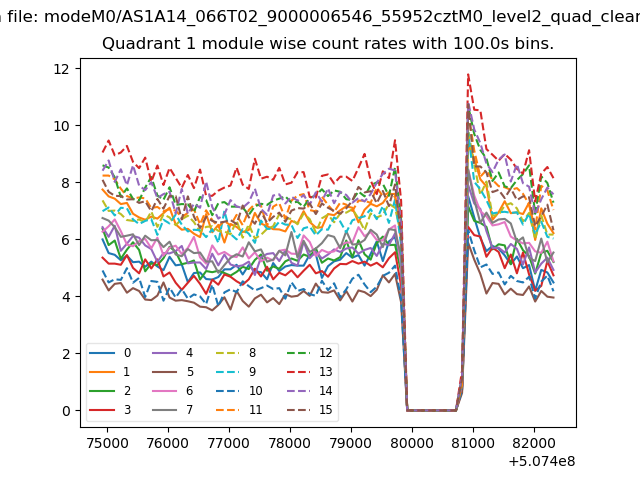
| Module-wise count rates for Quadrant A Data is divided into 100 sec bins |
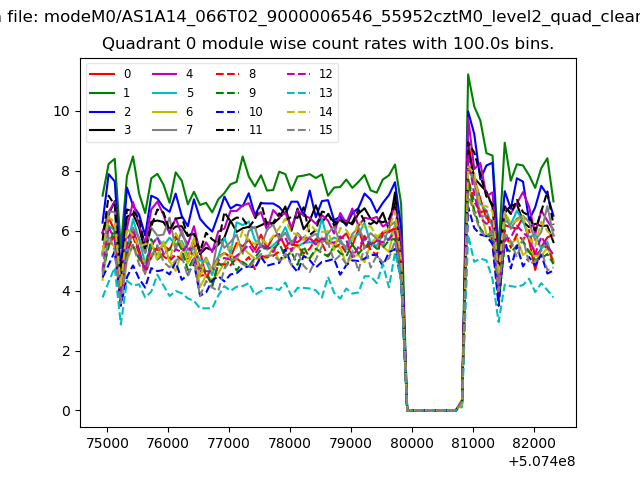 |
 |
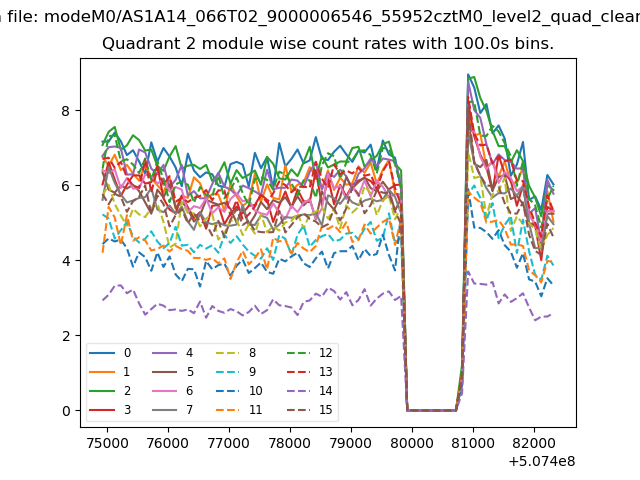
| Module-wise count rates for Quadrant B Data is divided into 100 sec bins |
 |
 |
| Module-wise count rates for Quadrant C Data is divided into 100 sec bins |
 |
 |
| Module-wise count rates for Quadrant D Data is divided into 100 sec bins |
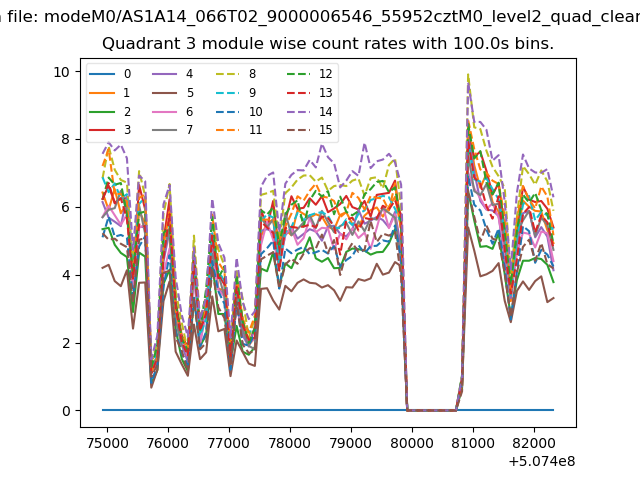 |
 |
| Parameter | Plot |
|---|---|
| CZT HV Monitor | 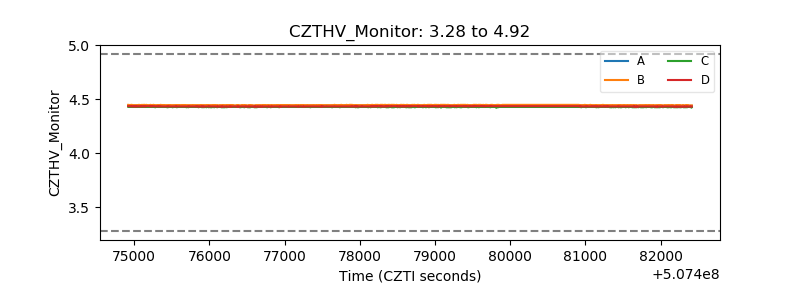 |
| D_VDD | 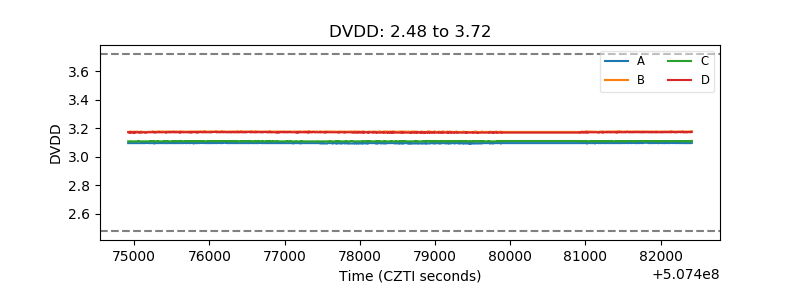 |
| Temperature 1 | 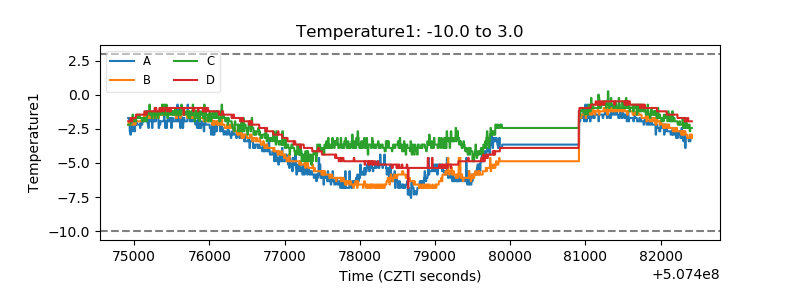 |
| Veto HV Monitor | 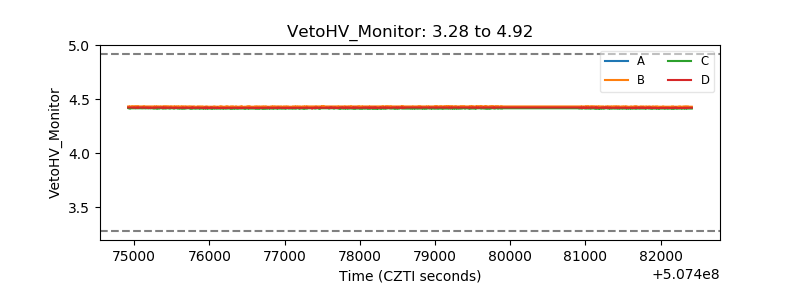 |
| Veto LLD | 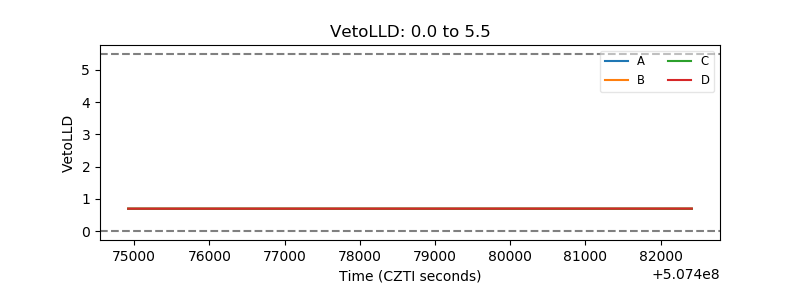 |
| Alpha Counter | 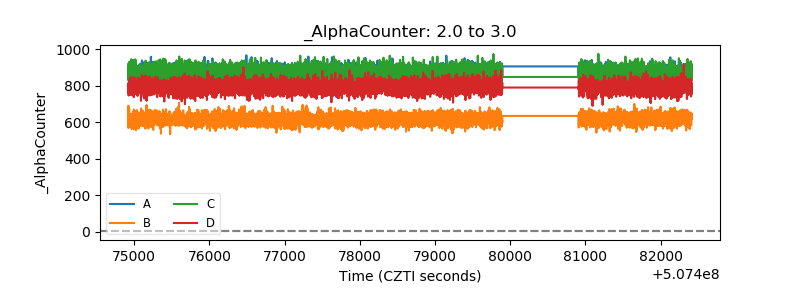 |
| _CPM_Rate | 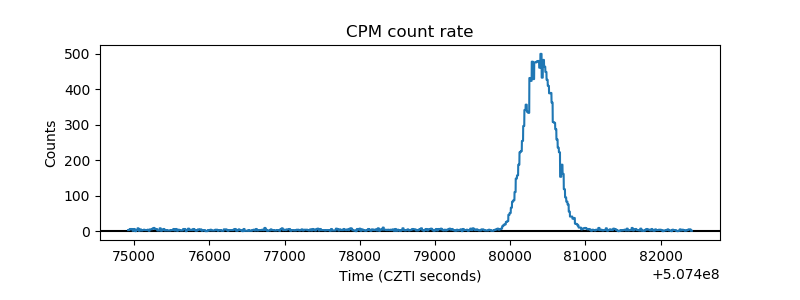 |
| CZT Counter | 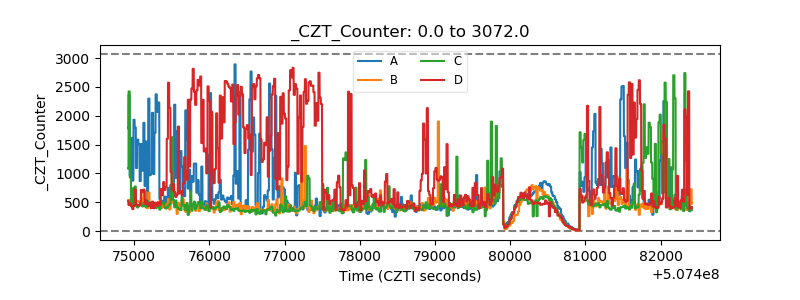 |
| +2.5 Volts monitor | 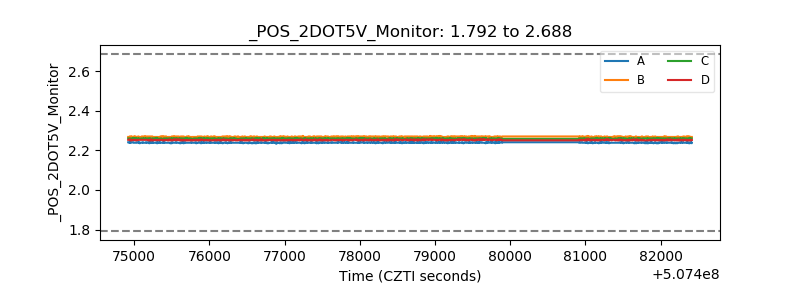 |
| +5 Volts monitor | 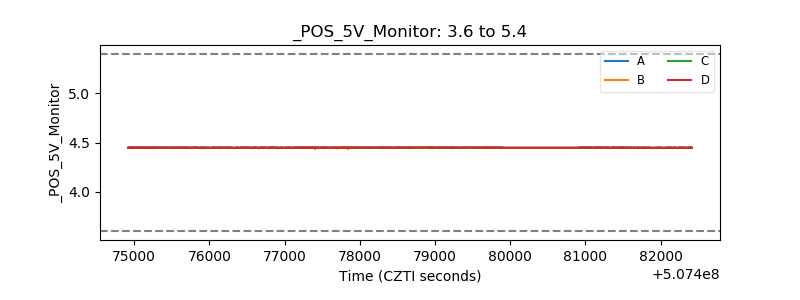 |
| _ROLL_ROT | 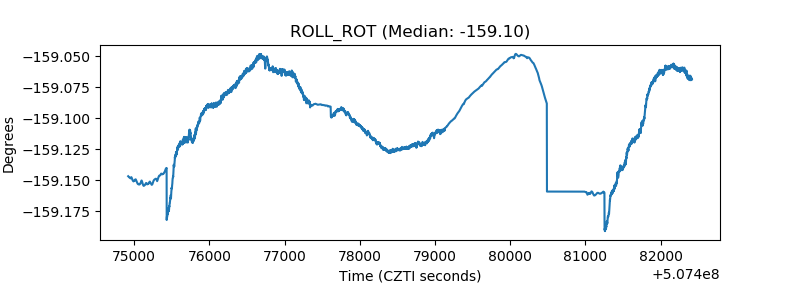 |
| _Roll_DEC | 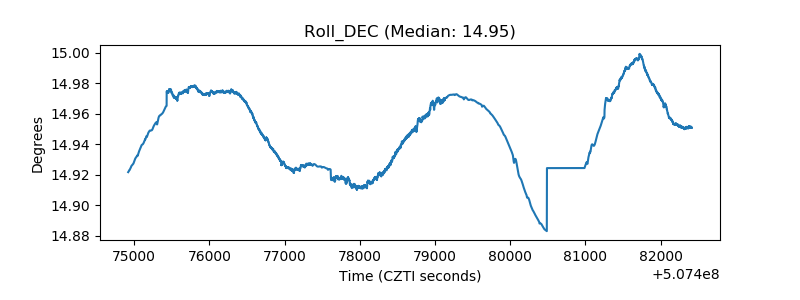 |
| _Roll_RA | 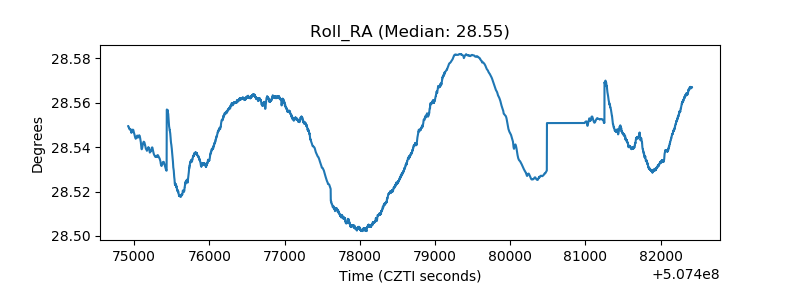 |
| Veto Counter | 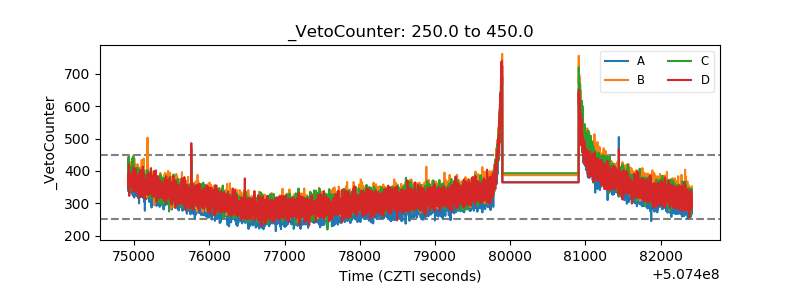 |