| Param | Original file | Final file |
|---|---|---|
| Filename | modeM0/AS1A14_066T02_9000006546_55953cztM0_level2.fits | modeM0/AS1A14_066T02_9000006546_55953cztM0_level2_quad_clean.evt |
| Size (bytes) | 547,257,600 | 91,212,480 |
| Size | 521.9 MB | 87.0 MB |
| Events in quadrant A | 4,522,828 | 619,453 |
| Events in quadrant B | 3,271,097 | 668,247 |
| Events in quadrant C | 3,964,397 | 582,211 |
| Events in quadrant D | 7,990,940 | 435,407 |
| Mode M9 | |||
|---|---|---|---|
| Quadrant | BADHDUFLAG | Total packets | Discarded packets |
| A | 0 | 11 | 0 |
| B | 0 | 11 | 0 |
| C | 0 | 11 | 0 |
| D | 0 | 11 | 0 |
| Mode M0 | |||
|---|---|---|---|
| Quadrant | BADHDUFLAG | Total packets | Discarded packets |
| A | 0 | 18262 | 1 |
| B | 0 | 14356 | 1 |
| C | 0 | 16701 | 1 |
| D | 0 | 28219 | 1 |
| Mode SS | |||
|---|---|---|---|
| Quadrant | BADHDUFLAG | Total packets | Discarded packets |
| A | 0 | 132 | 0 |
| B | 0 | 132 | 0 |
| C | 0 | 132 | 0 |
| D | 0 | 132 | 0 |
| Quadrant | Total seconds | Saturated seconds | Saturation percentage |
|---|---|---|---|
| A | 6547 | 262 | 4.001833% |
| B | 6546 | 97 | 1.481821% |
| C | 6548 | 268 | 4.092853% |
| D | 6548 | 1650 | 25.198534% |
Noise dominated data is calculated using 1-second bins in cleaned event files. If a bin has >2000 counts, and if more than 50% of those come from <1% of pixels, then it is considered to be noise-dominated and hence unusable.
| Quadrant | # 1 sec bins | Bins with >0 counts | Bins with >2000 counts | High rate bins dominated by noise | Noise dominated (total time) | Noise dominated (detector-on time) | Marked lightcurve |
|---|---|---|---|---|---|---|---|
| A | 7648 | 6548 | 179 | 179 | 2.34% | 2.73% | 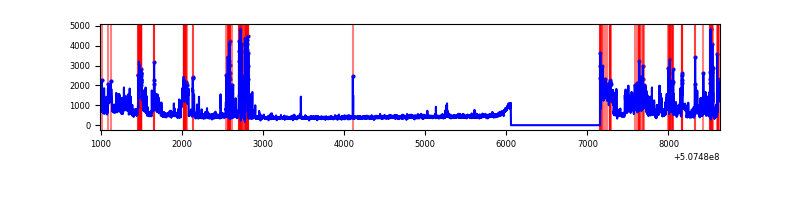 |
| B | 7648 | 6548 | 32 | 32 | 0.42% | 0.49% |  |
| C | 7649 | 6549 | 201 | 201 | 2.63% | 3.07% |  |
| D | 7649 | 6549 | 1600 | 1600 | 20.92% | 24.43% | 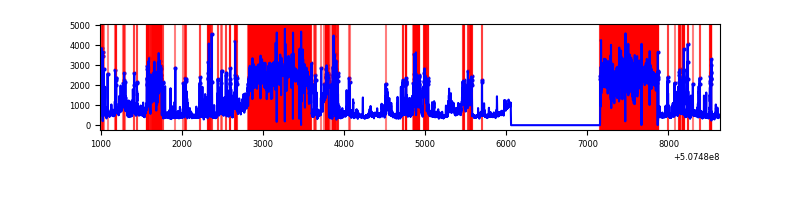 |
Top three noisy pixels from each quadrant. If the there are fewer than three noisy pixels in the level2.evt file, extra rows are filled as -1
| Pixel properties | Quadrant properties | ||||||
|---|---|---|---|---|---|---|---|
| Quadrant | DetID | PixID | Counts | Sigma | Mean | Median | Sigma |
| A | 7 | 64 | 802350 | 4659.66 | 689 | 672 | 172.0 |
| A | 12 | 115 | 668811 | 3883.48 | 689 | 672 | 172.0 |
| A | 3 | 14 | 227194 | 1316.63 | 689 | 672 | 172.0 |
| B | 0 | 171 | 151176 | 1034.79 | 684 | 660 | 145.5 |
| B | 4 | 21 | 78806 | 537.25 | 684 | 660 | 145.5 |
| B | 2 | 249 | 58440 | 397.23 | 684 | 660 | 145.5 |
| C | 15 | 193 | 517034 | 2807.14 | 666 | 660 | 184.0 |
| C | 1 | 29 | 272008 | 1475.12 | 666 | 660 | 184.0 |
| C | 15 | 199 | 243471 | 1319.98 | 666 | 660 | 184.0 |
| D | 11 | 129 | 5453553 | 32251.73 | 590 | 564 | 169.1 |
| D | 5 | 173 | 46710 | 272.93 | 590 | 564 | 169.1 |
| D | 2 | 31 | 41520 | 242.23 | 590 | 564 | 169.1 |
Histogram calculated using DETX and DETY for each event in the final _common_clean file
| Quadrant A |  |
 |
Quadrant B |
|---|---|---|---|
| Quadrant D |  |
 |
Quadrant C |
| Plot type | Count rate plots | Images |
|---|---|---|
| Comparison with Poisson distribution Blue bars denote a histogram of data divided into 1 sec bins. Red curve is a Poisson curve with rate = median count rate of data. |
 |
 |
| Quadrant-wise count rates Data is divided into 100 sec bins |
 |
|
| Module-wise count rates for Quadrant A Data is divided into 100 sec bins |
 |
 |
| Module-wise count rates for Quadrant B Data is divided into 100 sec bins |
 |
 |
| Module-wise count rates for Quadrant C Data is divided into 100 sec bins |
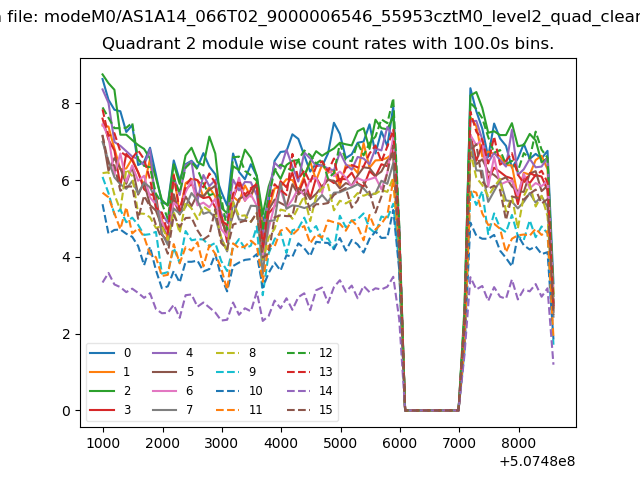 |
 |
| Module-wise count rates for Quadrant D Data is divided into 100 sec bins |
 |
 |
| Parameter | Plot |
|---|---|
| CZT HV Monitor | 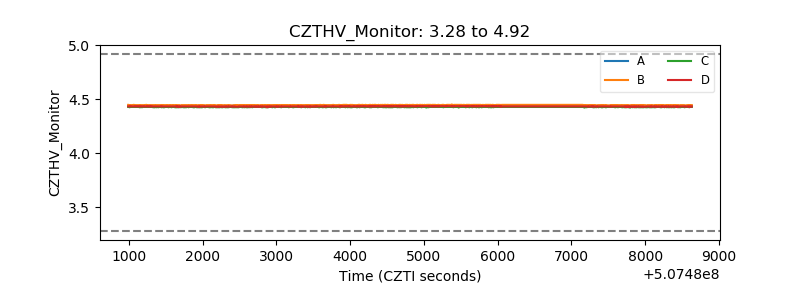 |
| D_VDD |  |
| Temperature 1 | 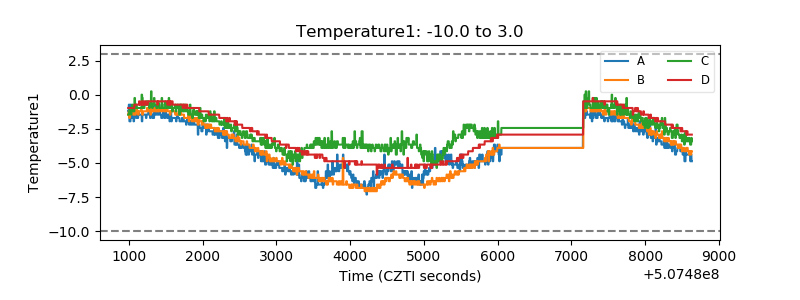 |
| Veto HV Monitor | 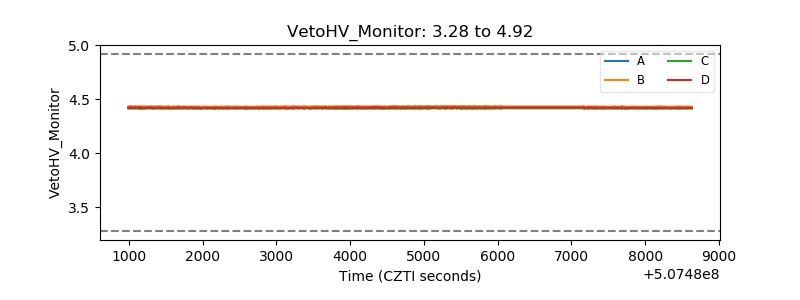 |
| Veto LLD |  |
| Alpha Counter |  |
| _CPM_Rate |  |
| CZT Counter | 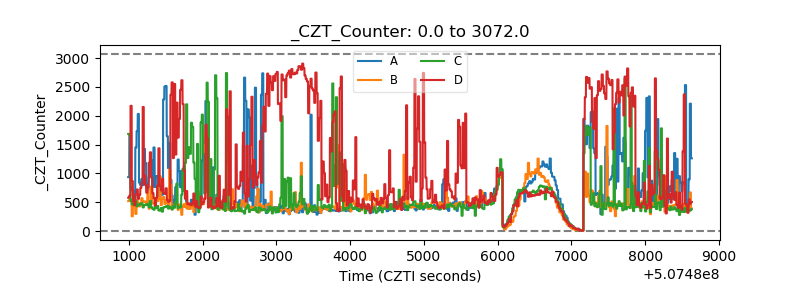 |
| +2.5 Volts monitor |  |
| +5 Volts monitor |  |
| _ROLL_ROT | 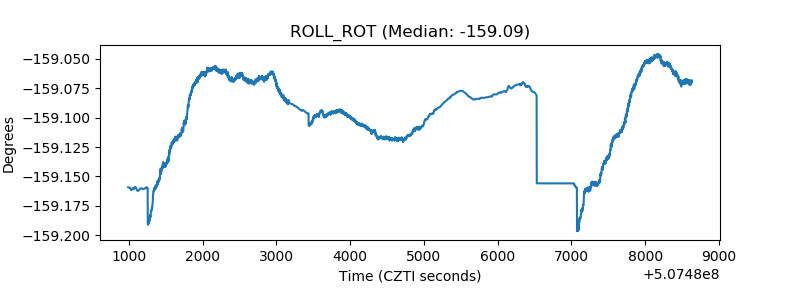 |
| _Roll_DEC | 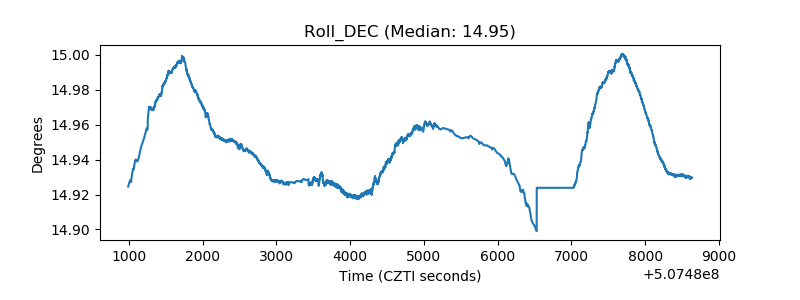 |
| _Roll_RA |  |
| Veto Counter | 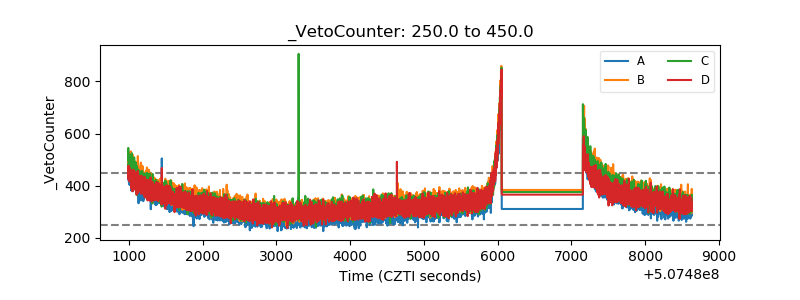 |