| Param | Original file | Final file |
|---|---|---|
| Filename | modeM0/AS1A14_066T02_9000006546_55954cztM0_level2.fits | modeM0/AS1A14_066T02_9000006546_55954cztM0_level2_quad_clean.evt |
| Size (bytes) | 482,437,440 | 92,632,320 |
| Size | 460.1 MB | 88.3 MB |
| Events in quadrant A | 4,207,085 | 619,463 |
| Events in quadrant B | 3,423,769 | 673,241 |
| Events in quadrant C | 3,213,563 | 583,673 |
| Events in quadrant D | 6,511,869 | 477,197 |
| Mode M9 | |||
|---|---|---|---|
| Quadrant | BADHDUFLAG | Total packets | Discarded packets |
| A | 0 | 11 | 0 |
| B | 0 | 12 | 0 |
| C | 0 | 12 | 0 |
| D | 0 | 12 | 0 |
| Mode M0 | |||
|---|---|---|---|
| Quadrant | BADHDUFLAG | Total packets | Discarded packets |
| A | 0 | 17220 | 2 |
| B | 0 | 14619 | 2 |
| C | 0 | 14609 | 3 |
| D | 0 | 23874 | 2 |
| Mode SS | |||
|---|---|---|---|
| Quadrant | BADHDUFLAG | Total packets | Discarded packets |
| A | 0 | 134 | 0 |
| B | 0 | 134 | 0 |
| C | 0 | 134 | 0 |
| D | 0 | 134 | 0 |
| Quadrant | Total seconds | Saturated seconds | Saturation percentage |
|---|---|---|---|
| A | 6460 | 204 | 3.157895% |
| B | 6460 | 81 | 1.253870% |
| C | 6459 | 138 | 2.136554% |
| D | 6459 | 1066 | 16.504103% |
Noise dominated data is calculated using 1-second bins in cleaned event files. If a bin has >2000 counts, and if more than 50% of those come from <1% of pixels, then it is considered to be noise-dominated and hence unusable.
| Quadrant | # 1 sec bins | Bins with >0 counts | Bins with >2000 counts | High rate bins dominated by noise | Noise dominated (total time) | Noise dominated (detector-on time) | Marked lightcurve |
|---|---|---|---|---|---|---|---|
| A | 7630 | 6461 | 161 | 161 | 2.11% | 2.49% | 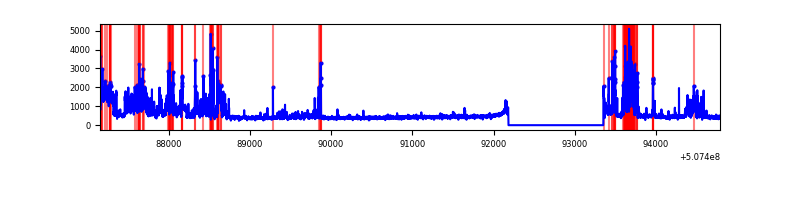 |
| B | 7630 | 6461 | 45 | 45 | 0.59% | 0.70% | 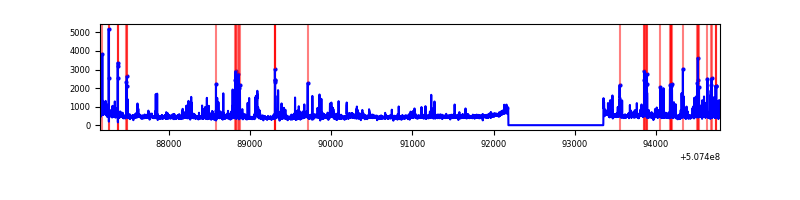 |
| C | 7629 | 6460 | 84 | 84 | 1.10% | 1.30% | 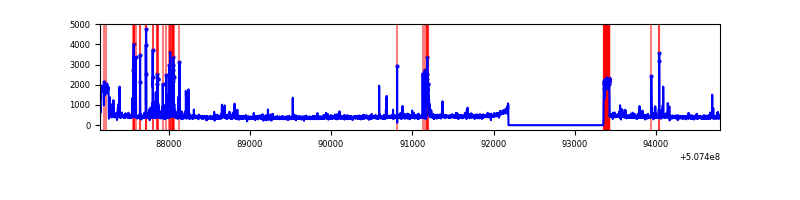 |
| D | 7629 | 6460 | 975 | 975 | 12.78% | 15.09% | 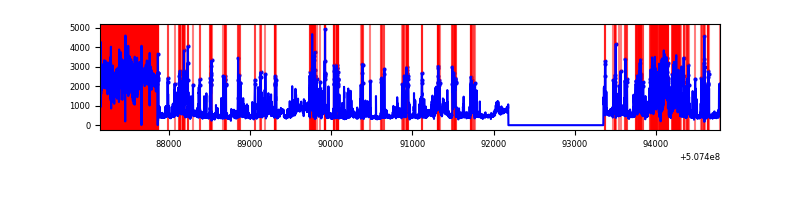 |
Top three noisy pixels from each quadrant. If the there are fewer than three noisy pixels in the level2.evt file, extra rows are filled as -1
| Pixel properties | Quadrant properties | ||||||
|---|---|---|---|---|---|---|---|
| Quadrant | DetID | PixID | Counts | Sigma | Mean | Median | Sigma |
| A | 7 | 64 | 603090 | 3551.16 | 680 | 664 | 169.6 |
| A | 12 | 115 | 501260 | 2950.89 | 680 | 664 | 169.6 |
| A | 3 | 14 | 263141 | 1547.24 | 680 | 664 | 169.6 |
| B | 0 | 231 | 170469 | 1181.33 | 681 | 659 | 143.7 |
| B | 0 | 171 | 135535 | 938.3 | 681 | 659 | 143.7 |
| B | 4 | 21 | 106478 | 736.16 | 681 | 659 | 143.7 |
| C | 1 | 29 | 225816 | 1218.0 | 666 | 659 | 184.9 |
| C | 15 | 193 | 218922 | 1180.71 | 666 | 659 | 184.9 |
| C | 15 | 219 | 50329 | 268.69 | 666 | 659 | 184.9 |
| D | 11 | 129 | 3896349 | 22388.83 | 606 | 580 | 174.0 |
| D | 3 | 12 | 49968 | 283.83 | 606 | 580 | 174.0 |
| D | 5 | 173 | 45874 | 260.3 | 606 | 580 | 174.0 |
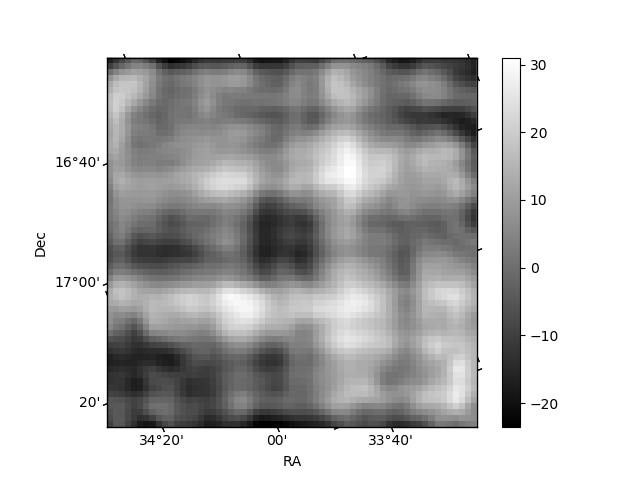
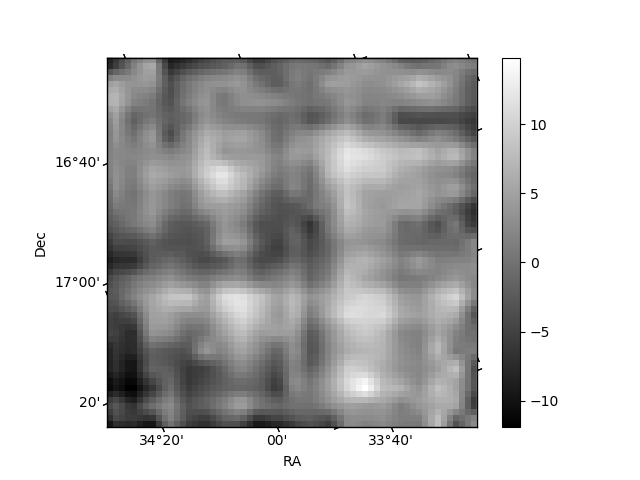
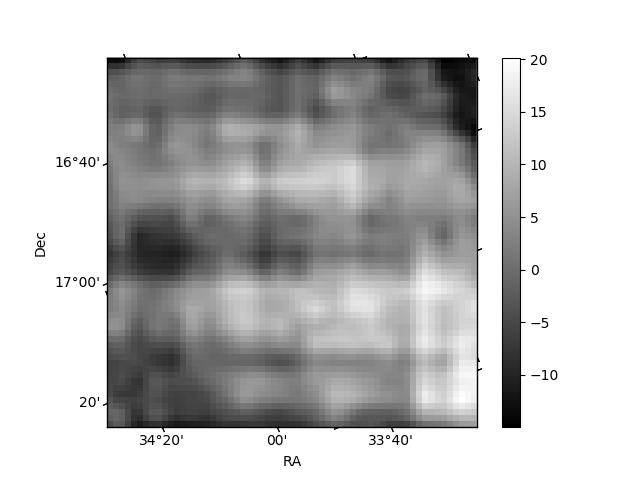
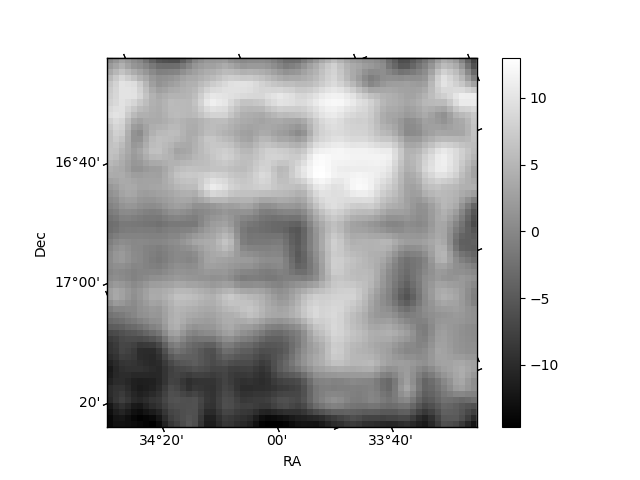
Histogram calculated using DETX and DETY for each event in the final _common_clean file
| Quadrant A | 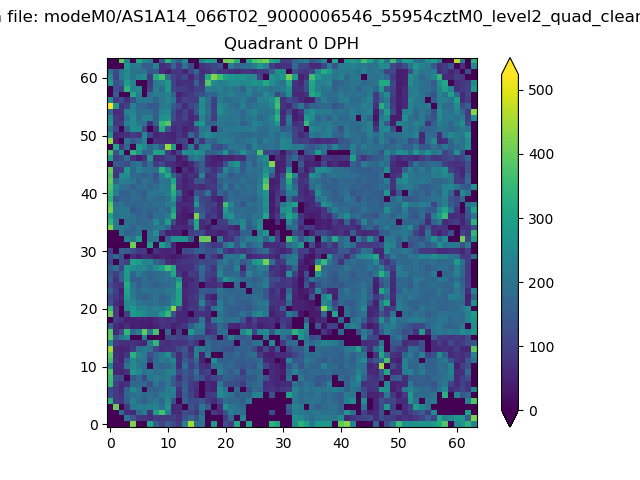 |
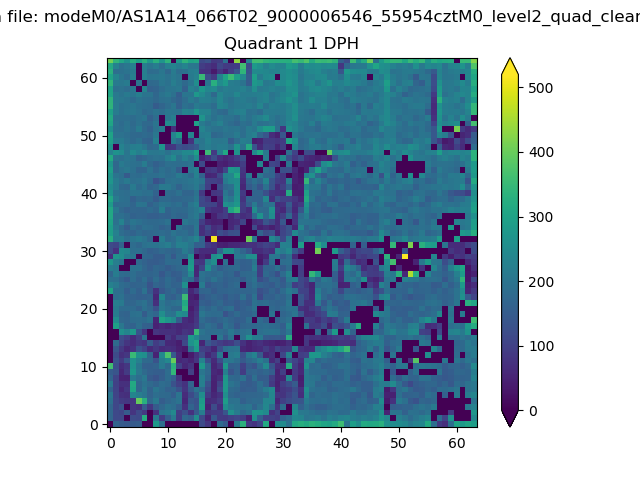 |
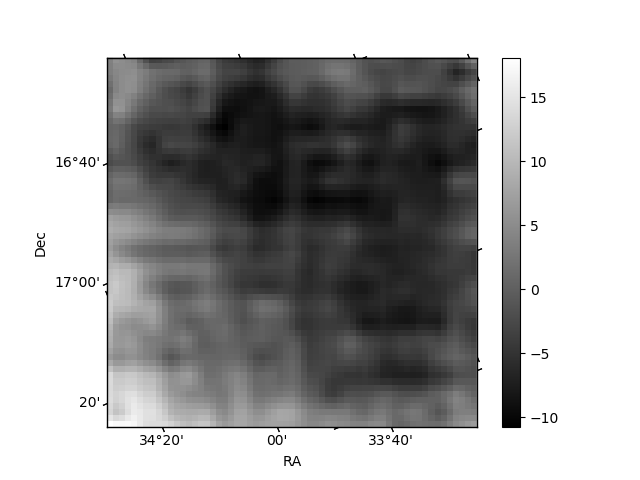
Quadrant B |
|---|---|---|---|
| Quadrant D | 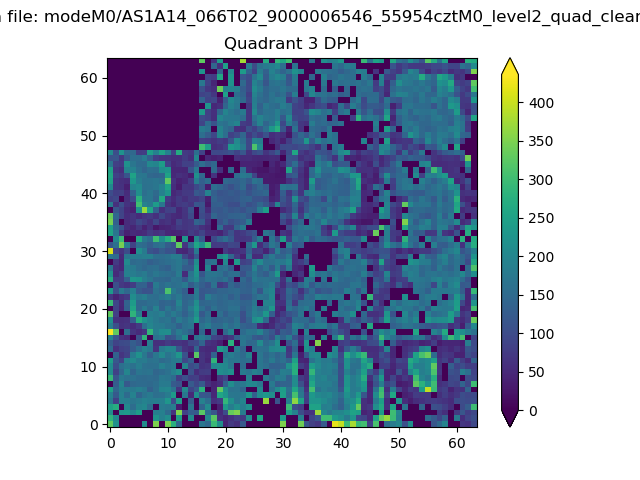 |
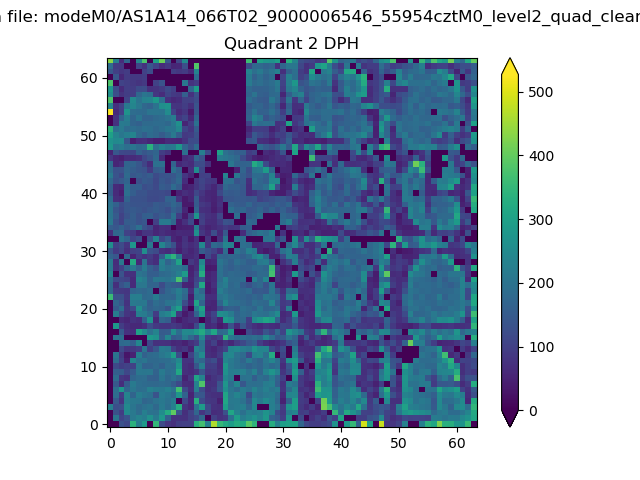 |
Quadrant C |
| Plot type | Count rate plots | Images |
|---|---|---|
| Comparison with Poisson distribution Blue bars denote a histogram of data divided into 1 sec bins. Red curve is a Poisson curve with rate = median count rate of data. |
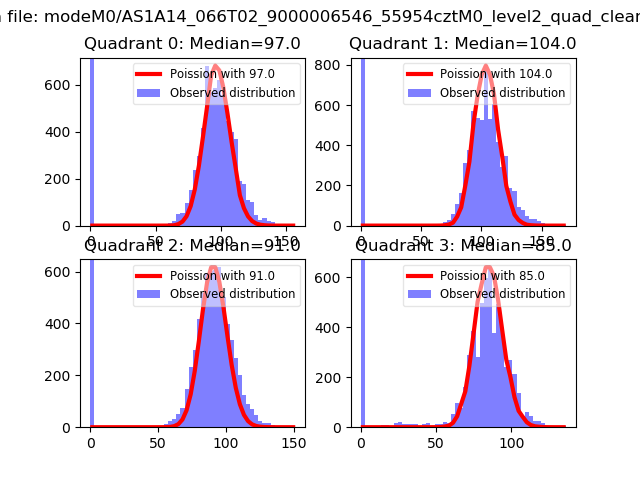 |
 |
| Quadrant-wise count rates Data is divided into 100 sec bins |
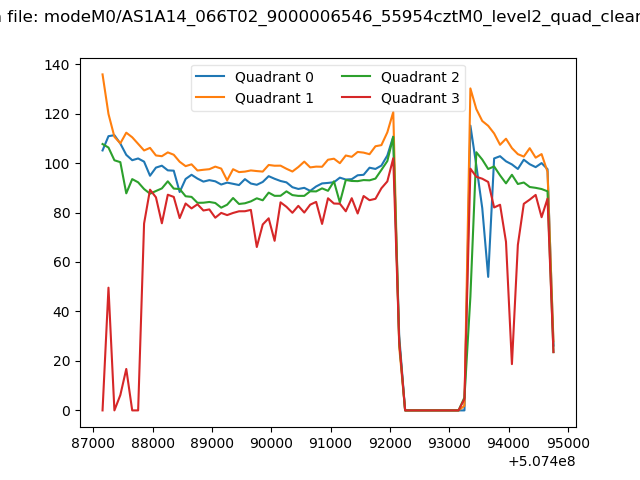 |
|
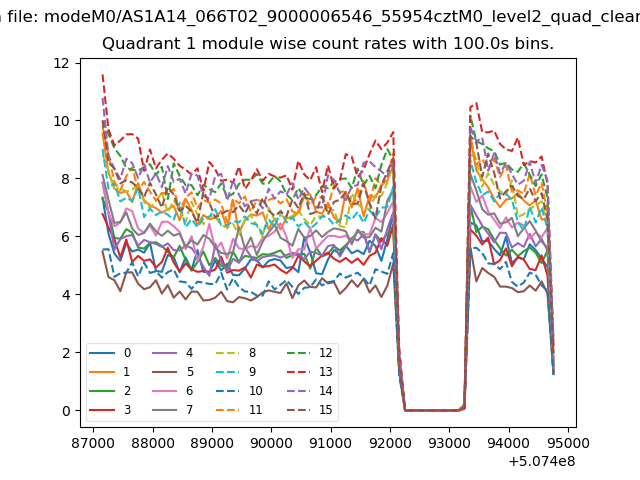
| Module-wise count rates for Quadrant A Data is divided into 100 sec bins |
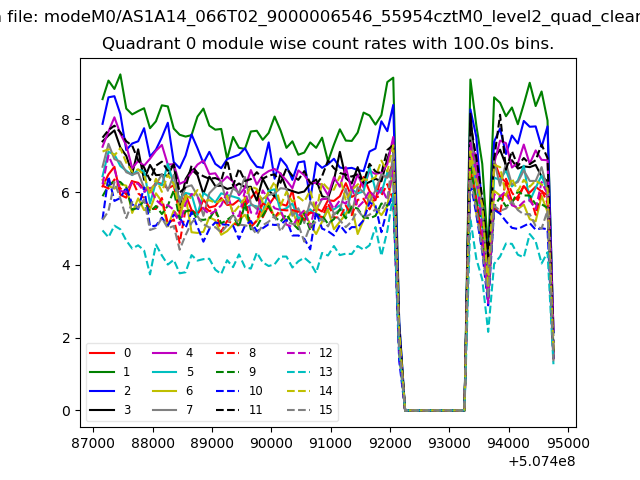 |
 |
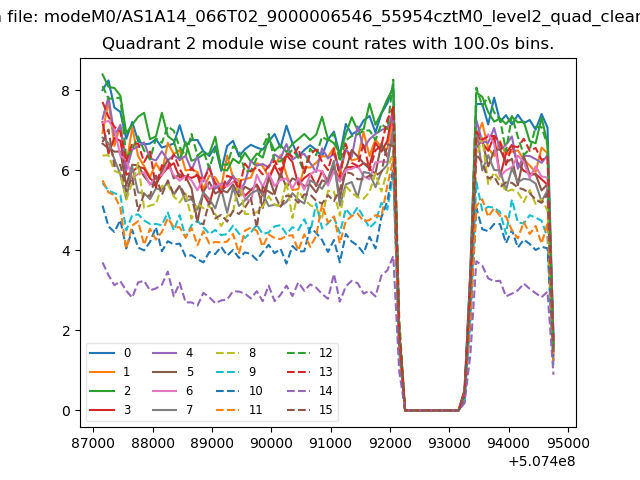
| Module-wise count rates for Quadrant B Data is divided into 100 sec bins |
 |
 |
| Module-wise count rates for Quadrant C Data is divided into 100 sec bins |
 |
 |
| Module-wise count rates for Quadrant D Data is divided into 100 sec bins |
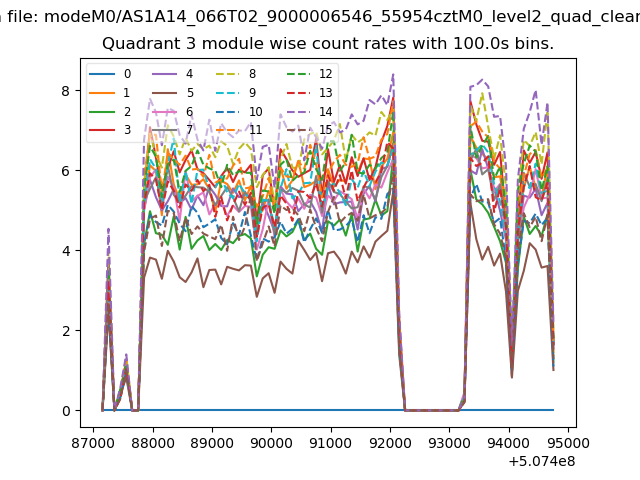 |
 |
| Parameter | Plot |
|---|---|
| CZT HV Monitor | 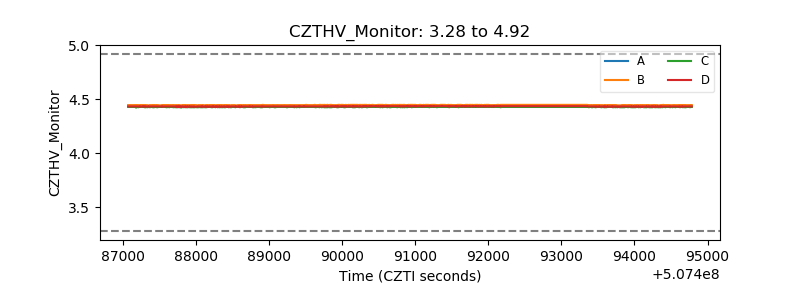 |
| D_VDD | 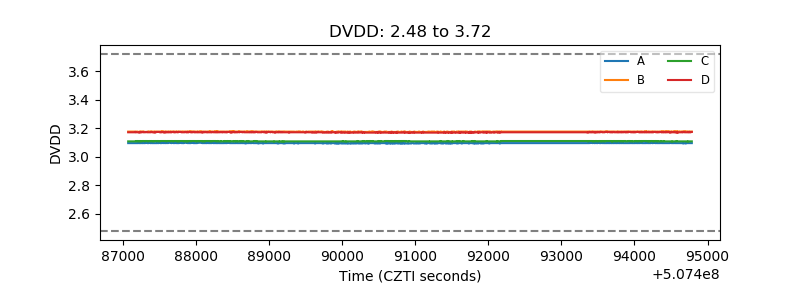 |
| Temperature 1 | 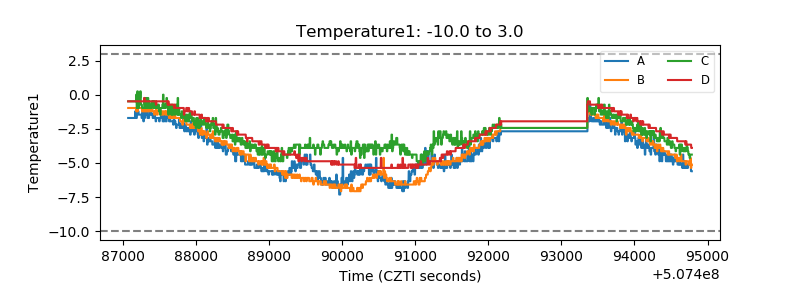 |
| Veto HV Monitor | 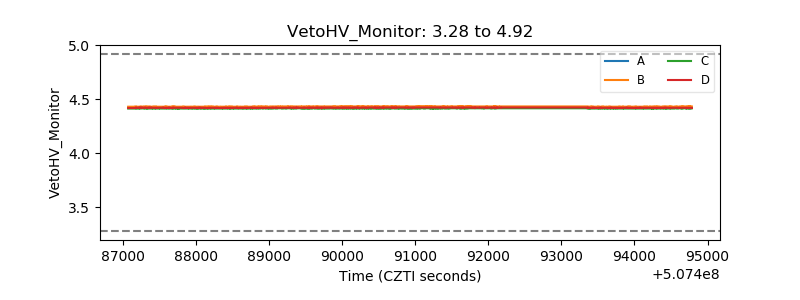 |
| Veto LLD | 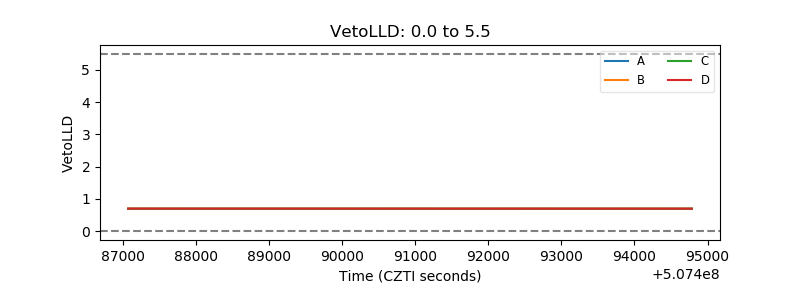 |
| Alpha Counter | 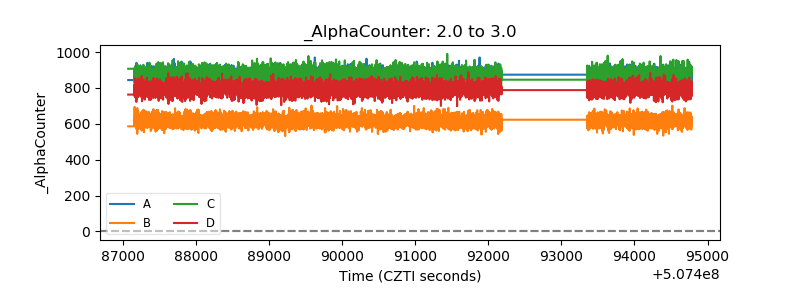 |
| _CPM_Rate | 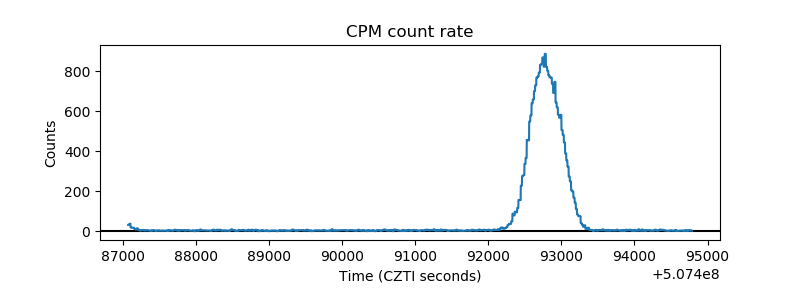 |
| CZT Counter | 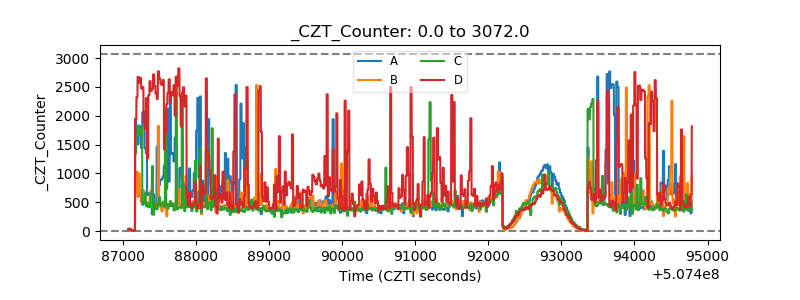 |
| +2.5 Volts monitor |  |
| +5 Volts monitor |  |
| _ROLL_ROT | 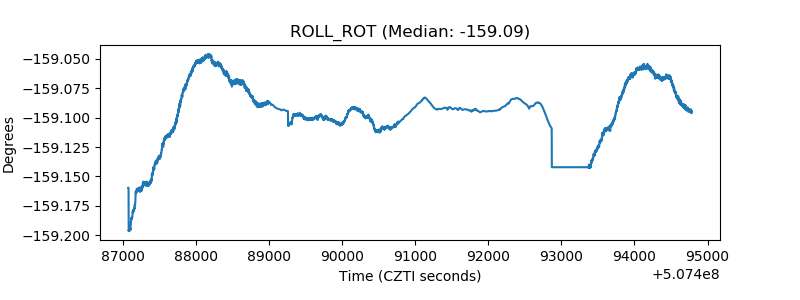 |
| _Roll_DEC | 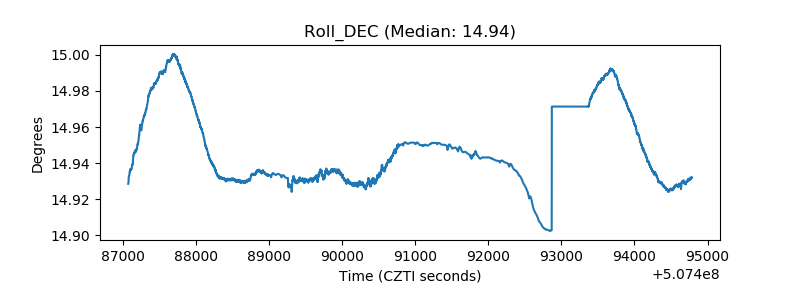 |
| _Roll_RA | 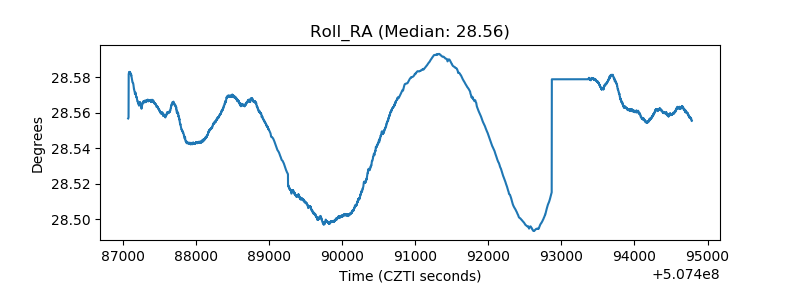 |
| Veto Counter | 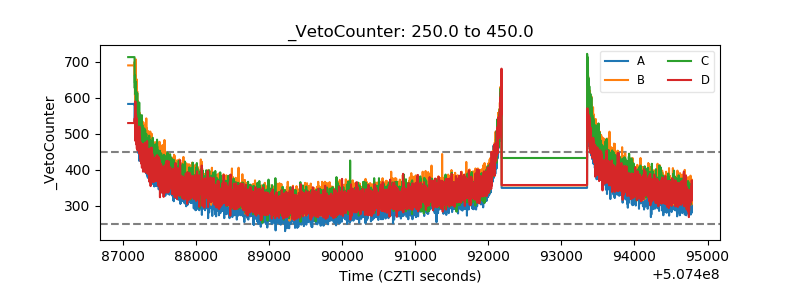 |