| Param | Original file | Final file |
|---|---|---|
| Filename | modeM0/AS1A14_066T02_9000006546_55955cztM0_level2.fits | modeM0/AS1A14_066T02_9000006546_55955cztM0_level2_quad_clean.evt |
| Size (bytes) | 470,787,840 | 92,738,880 |
| Size | 449.0 MB | 88.4 MB |
| Events in quadrant A | 4,497,715 | 595,444 |
| Events in quadrant B | 3,698,744 | 670,265 |
| Events in quadrant C | 3,747,235 | 562,453 |
| Events in quadrant D | 4,981,800 | 529,531 |
| Mode M9 | |||
|---|---|---|---|
| Quadrant | BADHDUFLAG | Total packets | Discarded packets |
| A | 0 | 12 | 0 |
| B | 0 | 12 | 0 |
| C | 0 | 12 | 0 |
| D | 0 | 12 | 0 |
| Mode M0 | |||
|---|---|---|---|
| Quadrant | BADHDUFLAG | Total packets | Discarded packets |
| A | 0 | 18177 | 2 |
| B | 0 | 15477 | 2 |
| C | 0 | 16136 | 3 |
| D | 0 | 19349 | 2 |
| Mode SS | |||
|---|---|---|---|
| Quadrant | BADHDUFLAG | Total packets | Discarded packets |
| A | 0 | 132 | 0 |
| B | 0 | 132 | 0 |
| C | 0 | 132 | 0 |
| D | 0 | 132 | 0 |
| Quadrant | Total seconds | Saturated seconds | Saturation percentage |
|---|---|---|---|
| A | 6453 | 381 | 5.904231% |
| B | 6454 | 94 | 1.456461% |
| C | 6453 | 389 | 6.028204% |
| D | 6453 | 473 | 7.329924% |
Noise dominated data is calculated using 1-second bins in cleaned event files. If a bin has >2000 counts, and if more than 50% of those come from <1% of pixels, then it is considered to be noise-dominated and hence unusable.
| Quadrant | # 1 sec bins | Bins with >0 counts | Bins with >2000 counts | High rate bins dominated by noise | Noise dominated (total time) | Noise dominated (detector-on time) | Marked lightcurve |
|---|---|---|---|---|---|---|---|
| A | 7653 | 6454 | 385 | 385 | 5.03% | 5.97% | 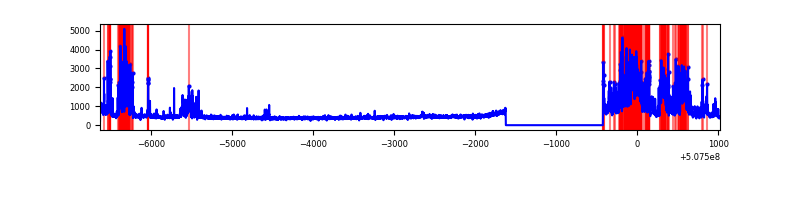 |
| B | 7654 | 6455 | 71 | 71 | 0.93% | 1.10% | 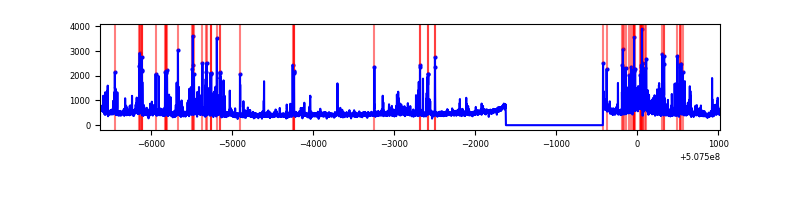 |
| C | 7652 | 6453 | 318 | 318 | 4.16% | 4.93% | 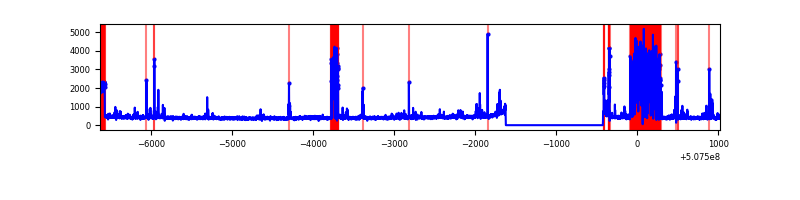 |
| D | 7652 | 6453 | 442 | 442 | 5.78% | 6.85% | 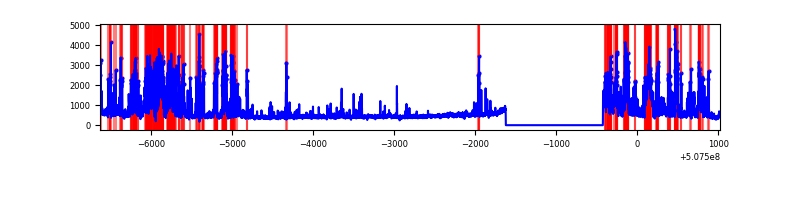 |
Top three noisy pixels from each quadrant. If the there are fewer than three noisy pixels in the level2.evt file, extra rows are filled as -1
| Pixel properties | Quadrant properties | ||||||
|---|---|---|---|---|---|---|---|
| Quadrant | DetID | PixID | Counts | Sigma | Mean | Median | Sigma |
| A | 12 | 115 | 1301812 | 7860.78 | 668 | 652 | 165.5 |
| A | 7 | 64 | 364737 | 2199.57 | 668 | 652 | 165.5 |
| A | 3 | 14 | 107279 | 644.17 | 668 | 652 | 165.5 |
| B | 0 | 231 | 303605 | 2081.82 | 679 | 656 | 145.5 |
| B | 0 | 171 | 212113 | 1453.1 | 679 | 656 | 145.5 |
| B | 9 | 251 | 152044 | 1040.31 | 679 | 656 | 145.5 |
| C | 13 | 3 | 1005056 | 5614.68 | 650 | 643 | 178.9 |
| C | 1 | 29 | 93546 | 519.33 | 650 | 643 | 178.9 |
| C | 15 | 248 | 24431 | 132.97 | 650 | 643 | 178.9 |
| D | 11 | 129 | 1983369 | 10735.97 | 645 | 618 | 184.7 |
| D | 2 | 62 | 119877 | 645.75 | 645 | 618 | 184.7 |
| D | 3 | 12 | 58494 | 313.38 | 645 | 618 | 184.7 |
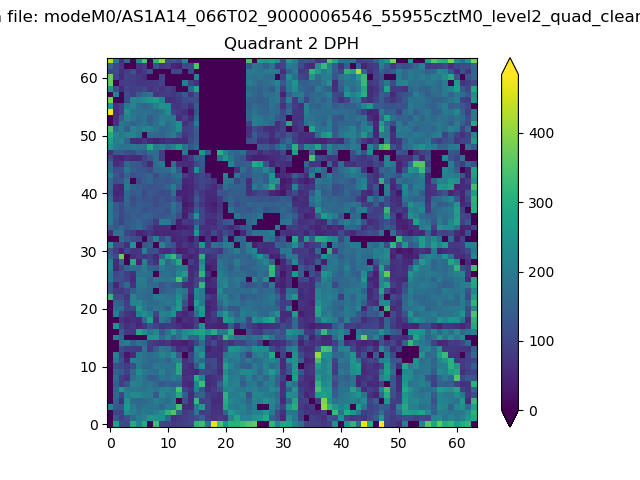
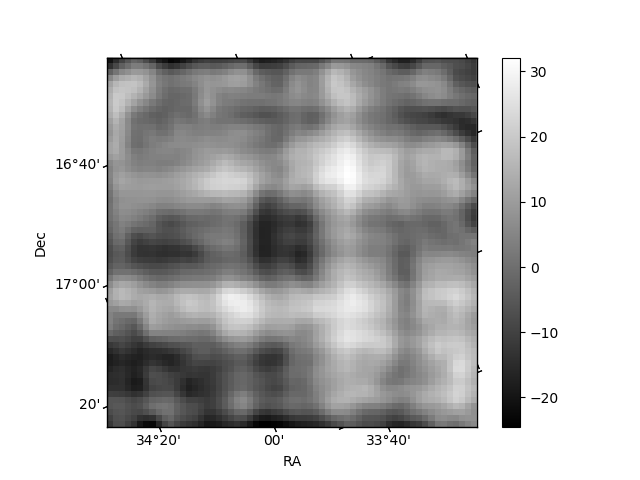
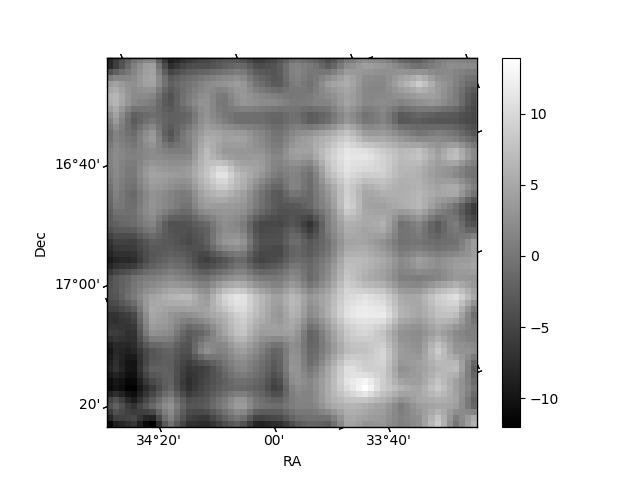
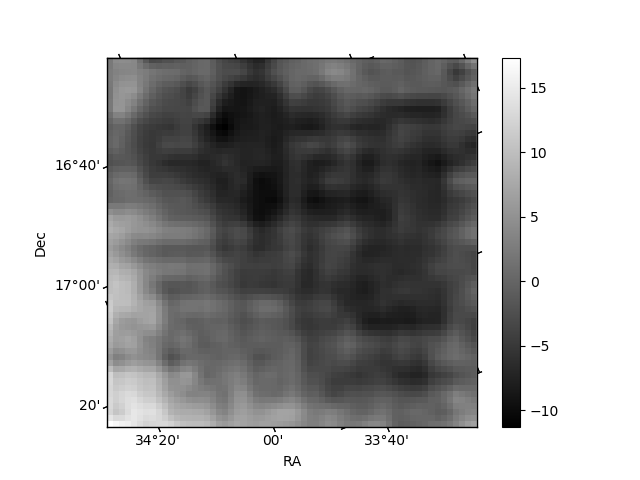
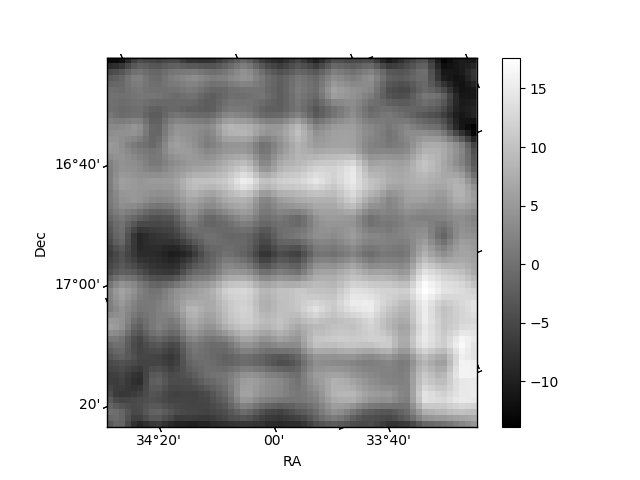
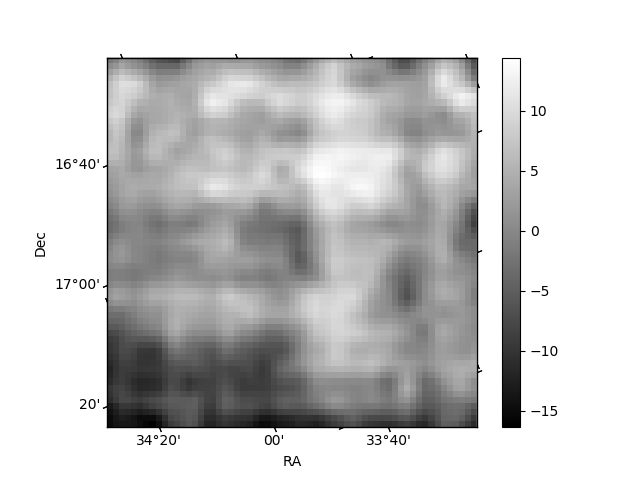
Histogram calculated using DETX and DETY for each event in the final _common_clean file
| Quadrant A | 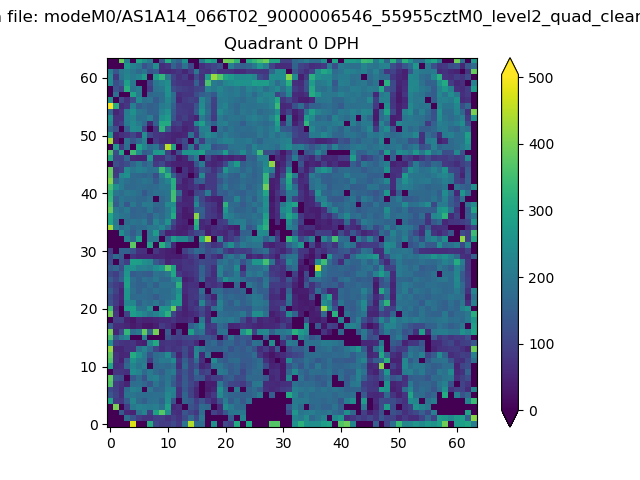 |
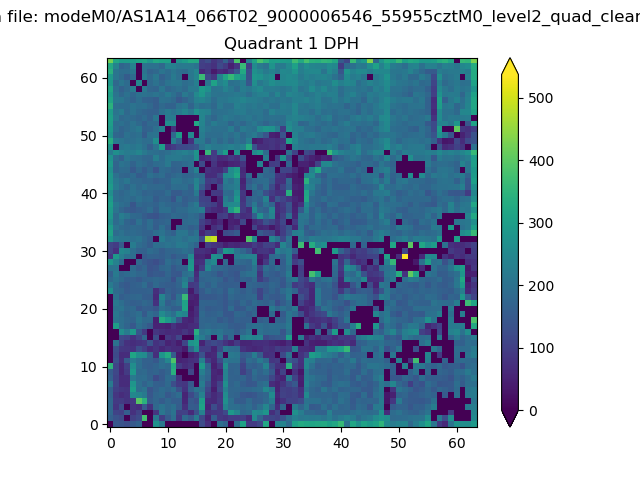 |
Quadrant B |
|---|---|---|---|
| Quadrant D | 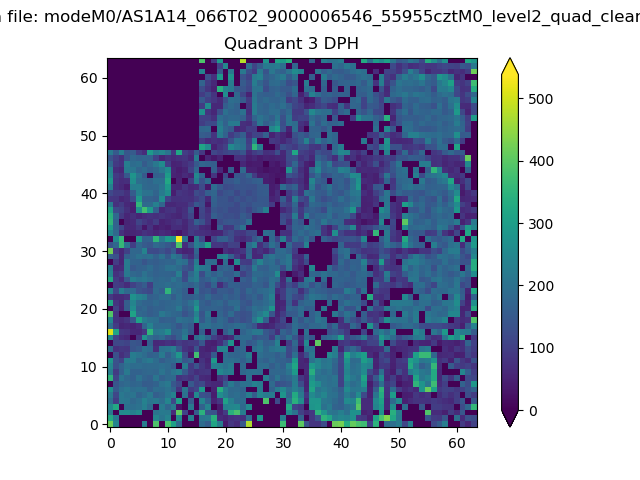 |
 |
Quadrant C |
| Plot type | Count rate plots | Images |
|---|---|---|
| Comparison with Poisson distribution Blue bars denote a histogram of data divided into 1 sec bins. Red curve is a Poisson curve with rate = median count rate of data. |
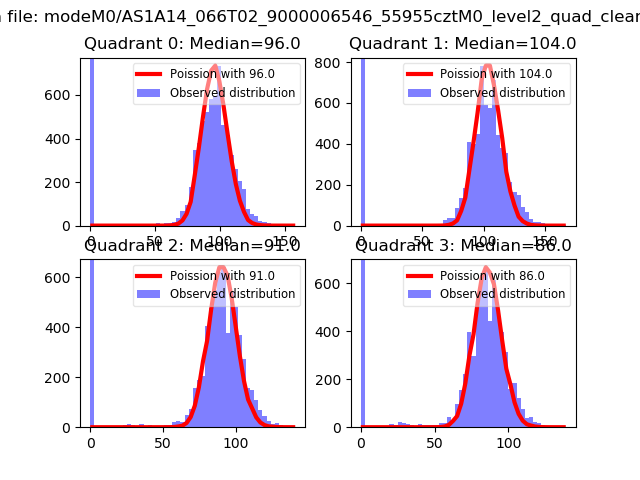 |
 |
| Quadrant-wise count rates Data is divided into 100 sec bins |
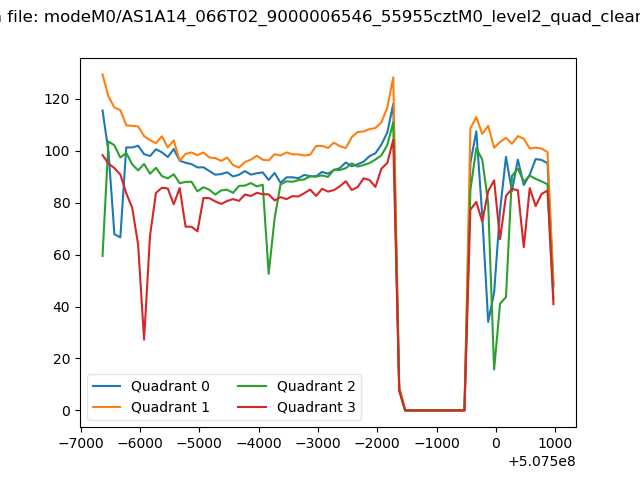 |
|
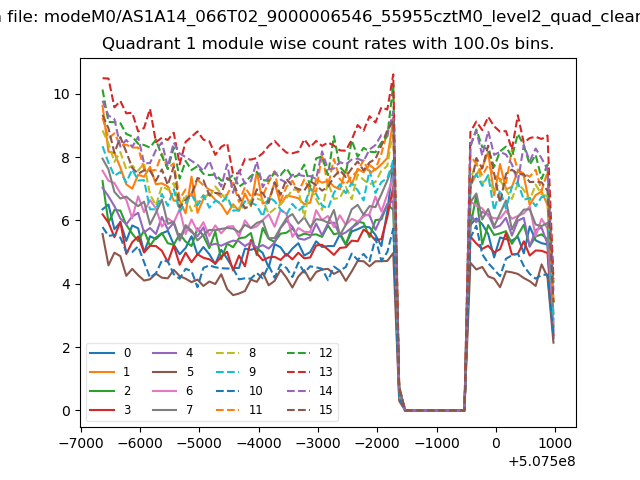
| Module-wise count rates for Quadrant A Data is divided into 100 sec bins |
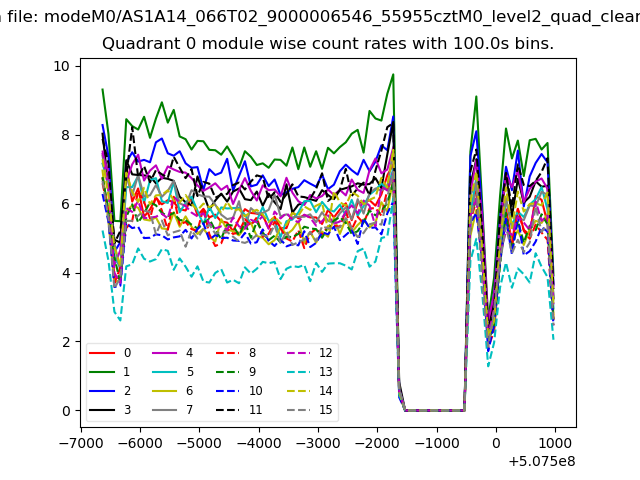 |
 |
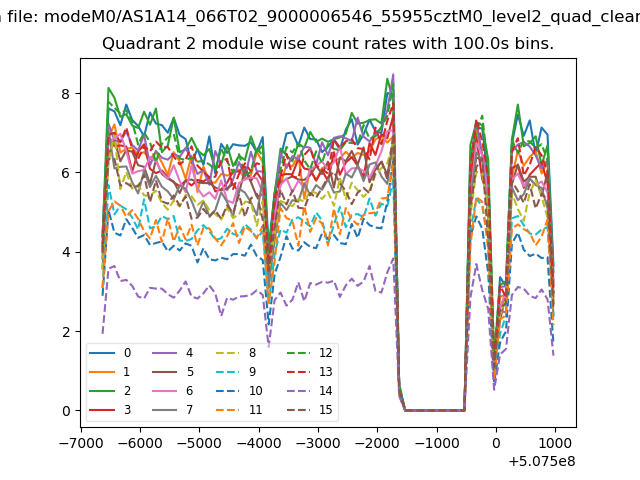
| Module-wise count rates for Quadrant B Data is divided into 100 sec bins |
 |
 |
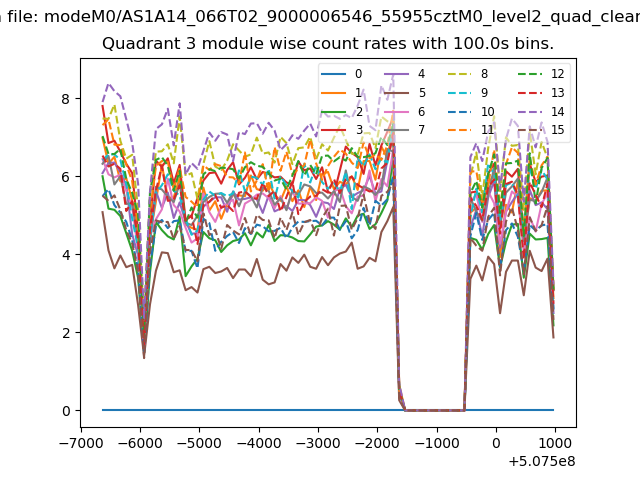
| Module-wise count rates for Quadrant C Data is divided into 100 sec bins |
 |
 |
| Module-wise count rates for Quadrant D Data is divided into 100 sec bins |
 |
 |
| Parameter | Plot |
|---|---|
| CZT HV Monitor | 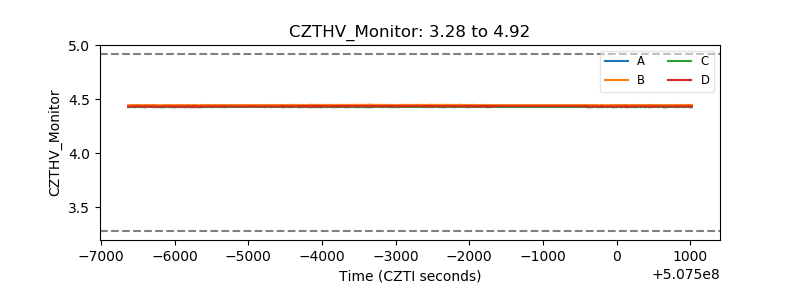 |
| D_VDD | 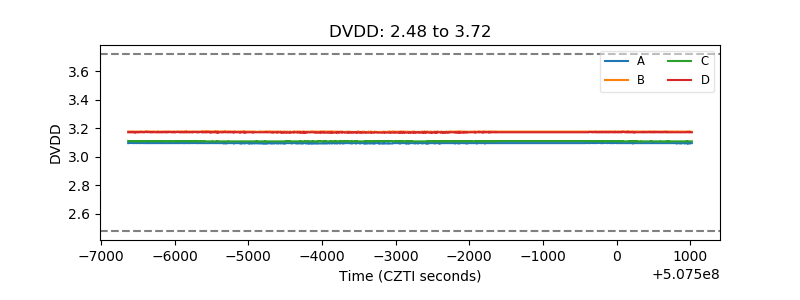 |
| Temperature 1 | 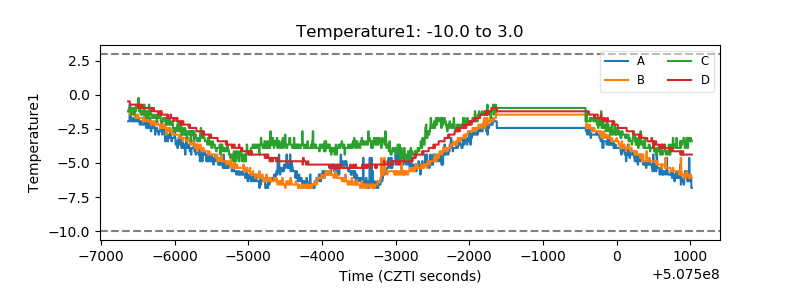 |
| Veto HV Monitor | 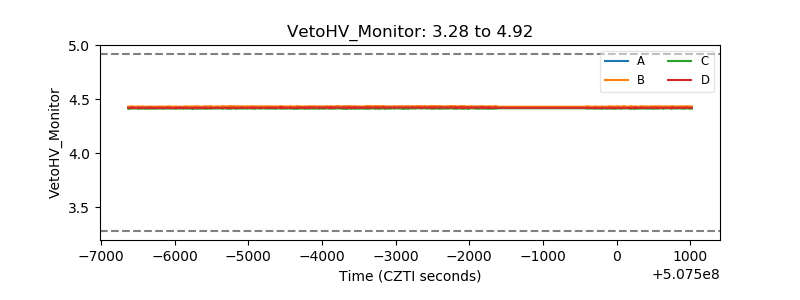 |
| Veto LLD | 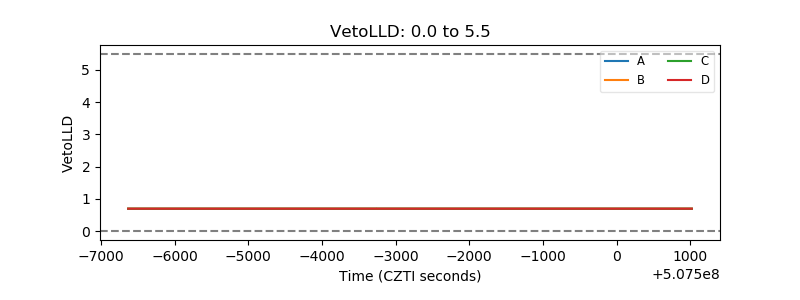 |
| Alpha Counter | 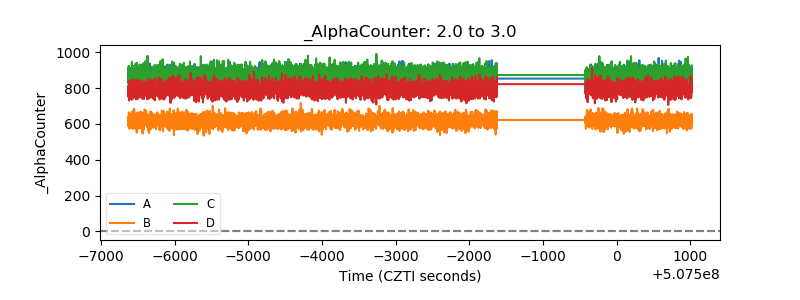 |
| _CPM_Rate | 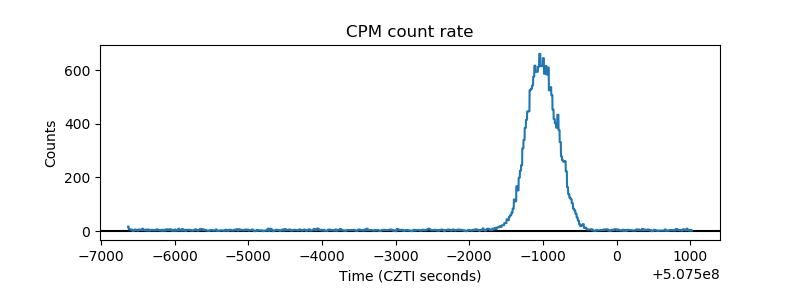 |
| CZT Counter | 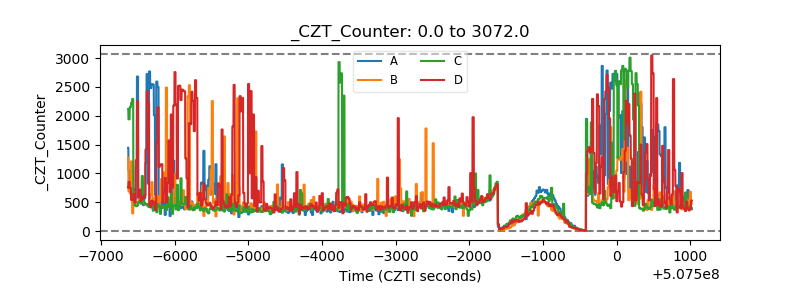 |
| +2.5 Volts monitor |  |
| +5 Volts monitor | 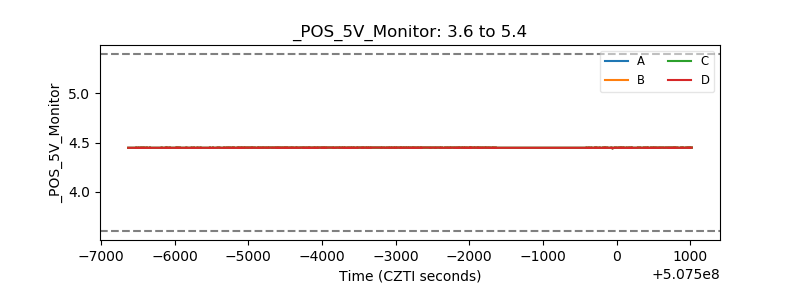 |
| _ROLL_ROT | 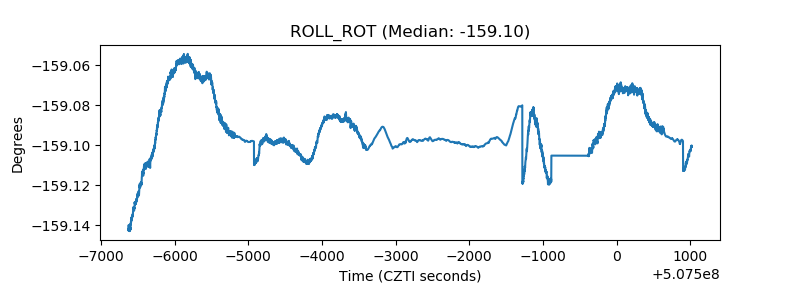 |
| _Roll_DEC | 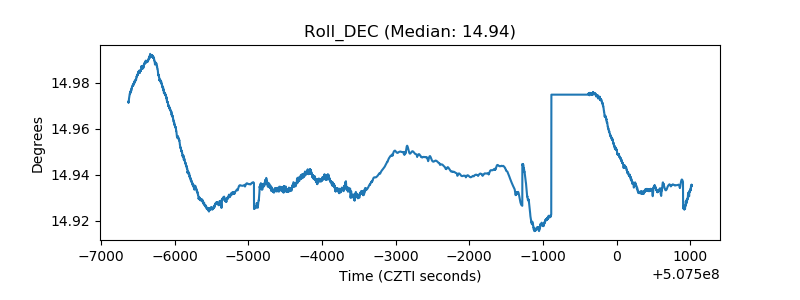 |
| _Roll_RA | 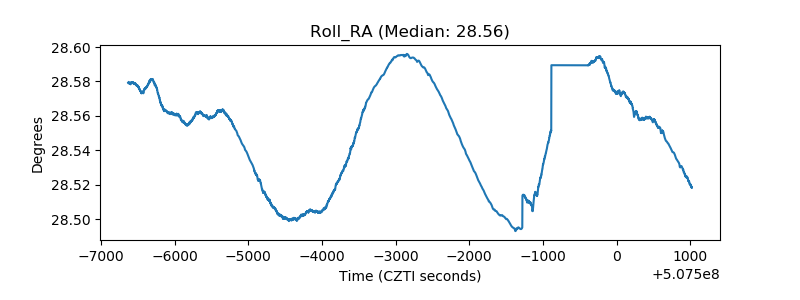 |
| Veto Counter | 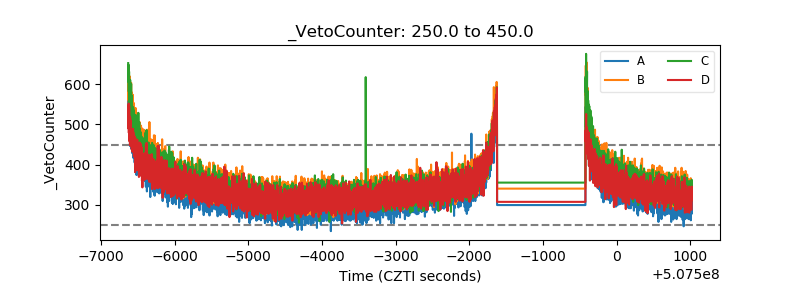 |