| Param | Original file | Final file |
|---|---|---|
| Filename | modeM0/AS1A14_066T02_9000006546_55958cztM0_level2.fits | modeM0/AS1A14_066T02_9000006546_55958cztM0_level2_quad_clean.evt |
| Size (bytes) | 1,318,662,720 | 163,906,560 |
| Size | 1.2 GB | 156.3 MB |
| Events in quadrant A | 10,524,169 | 1,113,665 |
| Events in quadrant B | 7,952,051 | 1,239,895 |
| Events in quadrant C | 8,689,404 | 1,066,836 |
| Events in quadrant D | 20,649,148 | 649,407 |
| Mode M9 | |||
|---|---|---|---|
| Quadrant | BADHDUFLAG | Total packets | Discarded packets |
| A | 0 | 15 | 0 |
| B | 0 | 16 | 0 |
| C | 0 | 16 | 0 |
| D | 0 | 16 | 0 |
| Mode M0 | |||
|---|---|---|---|
| Quadrant | BADHDUFLAG | Total packets | Discarded packets |
| A | 0 | 40452 | 3 |
| B | 0 | 32811 | 3 |
| C | 0 | 35833 | 3 |
| D | 0 | 70290 | 3 |
| Mode SS | |||
|---|---|---|---|
| Quadrant | BADHDUFLAG | Total packets | Discarded packets |
| A | 0 | 262 | 0 |
| B | 0 | 262 | 0 |
| C | 0 | 262 | 0 |
| D | 0 | 262 | 0 |
| Quadrant | Total seconds | Saturated seconds | Saturation percentage |
|---|---|---|---|
| A | 12916 | 916 | 7.091979% |
| B | 12916 | 559 | 4.327965% |
| C | 12916 | 950 | 7.355218% |
| D | 12916 | 5422 | 41.978941% |
Noise dominated data is calculated using 1-second bins in cleaned event files. If a bin has >2000 counts, and if more than 50% of those come from <1% of pixels, then it is considered to be noise-dominated and hence unusable.
| Quadrant | # 1 sec bins | Bins with >0 counts | Bins with >2000 counts | High rate bins dominated by noise | Noise dominated (total time) | Noise dominated (detector-on time) | Marked lightcurve |
|---|---|---|---|---|---|---|---|
| A | 14176 | 12918 | 827 | 827 | 5.83% | 6.40% |  |
| B | 14176 | 12918 | 326 | 326 | 2.30% | 2.52% |  |
| C | 14176 | 12918 | 842 | 842 | 5.94% | 6.52% |  |
| D | 14176 | 12918 | 5046 | 5046 | 35.60% | 39.06% |  |
Top three noisy pixels from each quadrant. If the there are fewer than three noisy pixels in the level2.evt file, extra rows are filled as -1
| Pixel properties | Quadrant properties | ||||||
|---|---|---|---|---|---|---|---|
| Quadrant | DetID | PixID | Counts | Sigma | Mean | Median | Sigma |
| A | 12 | 115 | 4706464 | 14397.26 | 1328 | 1292 | 326.8 |
| A | 3 | 14 | 234185 | 712.62 | 1328 | 1292 | 326.8 |
| A | 0 | 8 | 173550 | 527.09 | 1328 | 1292 | 326.8 |
| B | 2 | 249 | 1039199 | 3606.37 | 1346 | 1296 | 287.8 |
| B | 9 | 251 | 816453 | 2832.4 | 1346 | 1296 | 287.8 |
| B | 0 | 199 | 263209 | 910.06 | 1346 | 1296 | 287.8 |
| C | 13 | 3 | 2321137 | 6592.81 | 1281 | 1269 | 351.9 |
| C | 1 | 29 | 724212 | 2054.52 | 1281 | 1269 | 351.9 |
| C | 12 | 249 | 303349 | 858.48 | 1281 | 1269 | 351.9 |
| D | 11 | 129 | 12494151 | 39695.77 | 1095 | 1046 | 314.7 |
| D | 2 | 62 | 3212031 | 10202.63 | 1095 | 1046 | 314.7 |
| D | 3 | 12 | 341661 | 1082.27 | 1095 | 1046 | 314.7 |
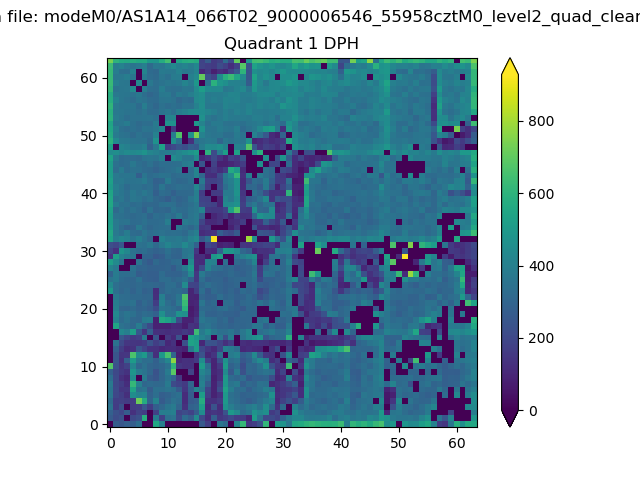
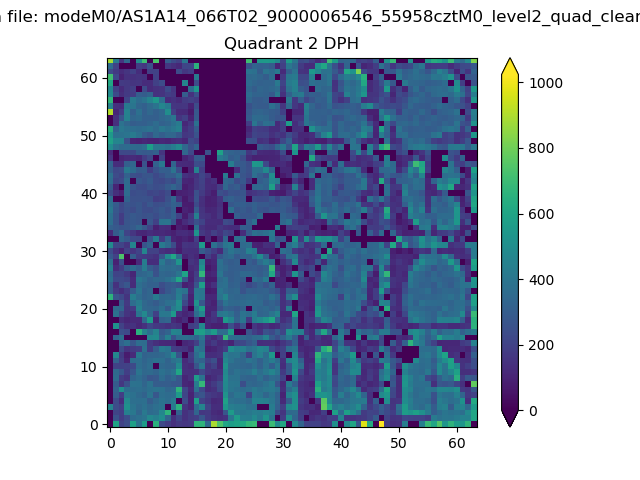
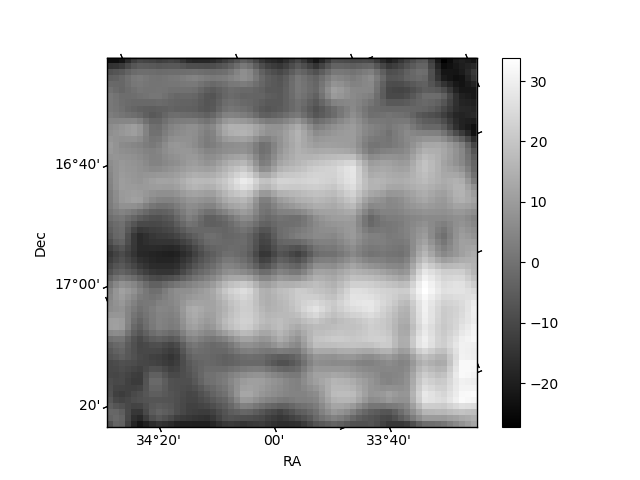
Histogram calculated using DETX and DETY for each event in the final _common_clean file
| Quadrant A |  |
 |
Quadrant B |
|---|---|---|---|
| Quadrant D |  |
 |
Quadrant C |
| Plot type | Count rate plots | Images |
|---|---|---|
| Comparison with Poisson distribution Blue bars denote a histogram of data divided into 1 sec bins. Red curve is a Poisson curve with rate = median count rate of data. |
 |
 |
| Quadrant-wise count rates Data is divided into 100 sec bins |
 |
|
| Module-wise count rates for Quadrant A Data is divided into 100 sec bins |
 |
 |
| Module-wise count rates for Quadrant B Data is divided into 100 sec bins |
 |
 |
| Module-wise count rates for Quadrant C Data is divided into 100 sec bins |
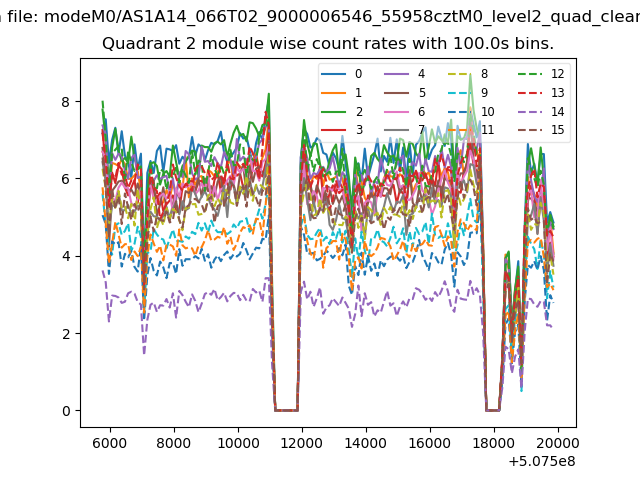 |
 |
| Module-wise count rates for Quadrant D Data is divided into 100 sec bins |
 |
 |
| Parameter | Plot |
|---|---|
| CZT HV Monitor |  |
| D_VDD |  |
| Temperature 1 |  |
| Veto HV Monitor |  |
| Veto LLD |  |
| Alpha Counter | 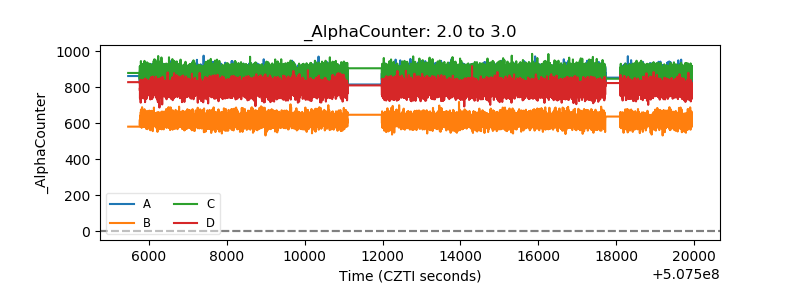 |
| _CPM_Rate |  |
| CZT Counter |  |
| +2.5 Volts monitor |  |
| +5 Volts monitor |  |
| _ROLL_ROT |  |
| _Roll_DEC |  |
| _Roll_RA |  |
| Veto Counter |  |