| Param | Original file | Final file |
|---|---|---|
| Filename | modeM0/AS1A14_066T02_9000006546_55959cztM0_level2.fits | modeM0/AS1A14_066T02_9000006546_55959cztM0_level2_quad_clean.evt |
| Size (bytes) | 3,463,960,320 | 572,734,080 |
| Size | 3.2 GB | 546.2 MB |
| Events in quadrant A | 29,418,380 | 3,812,295 |
| Events in quadrant B | 22,480,787 | 4,176,637 |
| Events in quadrant C | 24,057,671 | 3,627,189 |
| Events in quadrant D | 49,035,681 | 2,848,310 |
| Mode M9 | |||
|---|---|---|---|
| Quadrant | BADHDUFLAG | Total packets | Discarded packets |
| A | 0 | 68 | 0 |
| B | 0 | 68 | 0 |
| C | 0 | 68 | 0 |
| D | 0 | 68 | 0 |
| Mode M0 | |||
|---|---|---|---|
| Quadrant | BADHDUFLAG | Total packets | Discarded packets |
| A | 0 | 117722 | 13 |
| B | 0 | 96897 | 7 |
| C | 0 | 104064 | 7 |
| D | 0 | 174872 | 7 |
| Mode SS | |||
|---|---|---|---|
| Quadrant | BADHDUFLAG | Total packets | Discarded packets |
| A | 0 | 854 | 0 |
| B | 0 | 854 | 0 |
| C | 0 | 854 | 0 |
| D | 0 | 854 | 0 |
| Quadrant | Total seconds | Saturated seconds | Saturation percentage |
|---|---|---|---|
| A | 41882 | 1732 | 4.135428% |
| B | 41883 | 872 | 2.081990% |
| C | 41884 | 1818 | 4.340560% |
| D | 41884 | 9320 | 22.251934% |
Noise dominated data is calculated using 1-second bins in cleaned event files. If a bin has >2000 counts, and if more than 50% of those come from <1% of pixels, then it is considered to be noise-dominated and hence unusable.
| Quadrant | # 1 sec bins | Bins with >0 counts | Bins with >2000 counts | High rate bins dominated by noise | Noise dominated (total time) | Noise dominated (detector-on time) | Marked lightcurve |
|---|---|---|---|---|---|---|---|
| A | 48729 | 41890 | 1538 | 1538 | 3.16% | 3.67% | 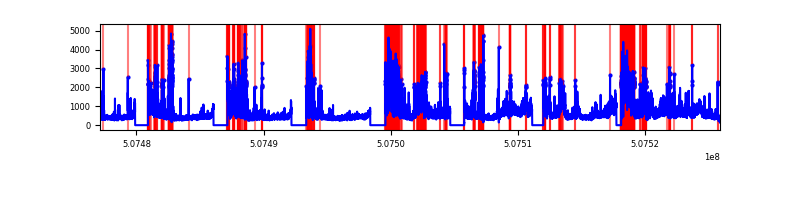 |
| B | 48730 | 41891 | 457 | 457 | 0.94% | 1.09% | 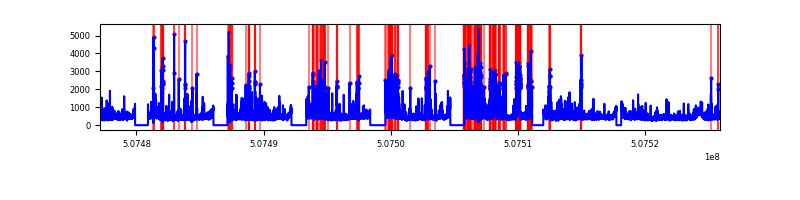 |
| C | 48730 | 41891 | 1495 | 1495 | 3.07% | 3.57% | 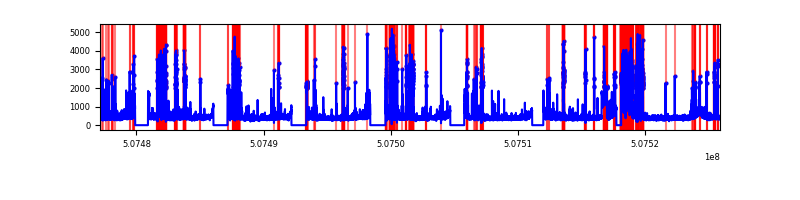 |
| D | 48730 | 41891 | 8895 | 8895 | 18.25% | 21.23% | 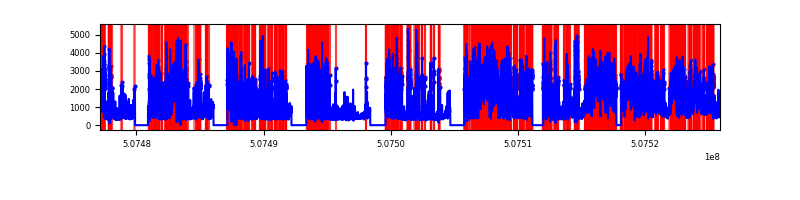 |
Top three noisy pixels from each quadrant. If the there are fewer than three noisy pixels in the level2.evt file, extra rows are filled as -1
| Pixel properties | Quadrant properties | ||||||
|---|---|---|---|---|---|---|---|
| Quadrant | DetID | PixID | Counts | Sigma | Mean | Median | Sigma |
| A | 12 | 115 | 9340462 | 8687.8 | 4377 | 4256 | 1074.6 |
| A | 7 | 64 | 1247898 | 1157.27 | 4377 | 4256 | 1074.6 |
| A | 3 | 14 | 667205 | 616.91 | 4377 | 4256 | 1074.6 |
| B | 2 | 249 | 1185330 | 1278.28 | 4391 | 4231 | 924.0 |
| B | 9 | 251 | 1094167 | 1179.61 | 4391 | 4231 | 924.0 |
| B | 0 | 171 | 652764 | 701.89 | 4391 | 4231 | 924.0 |
| C | 13 | 3 | 3769508 | 3245.97 | 4247 | 4214 | 1160.0 |
| C | 1 | 29 | 1232451 | 1058.83 | 4247 | 4214 | 1160.0 |
| C | 15 | 193 | 543183 | 464.63 | 4247 | 4214 | 1160.0 |
| D | 11 | 129 | 28473491 | 25614.46 | 3921 | 3751 | 1111.5 |
| D | 2 | 62 | 3406299 | 3061.3 | 3921 | 3751 | 1111.5 |
| D | 3 | 12 | 621201 | 555.52 | 3921 | 3751 | 1111.5 |
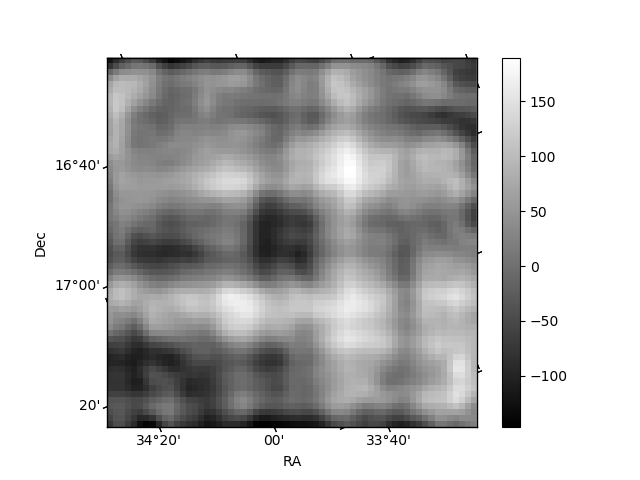
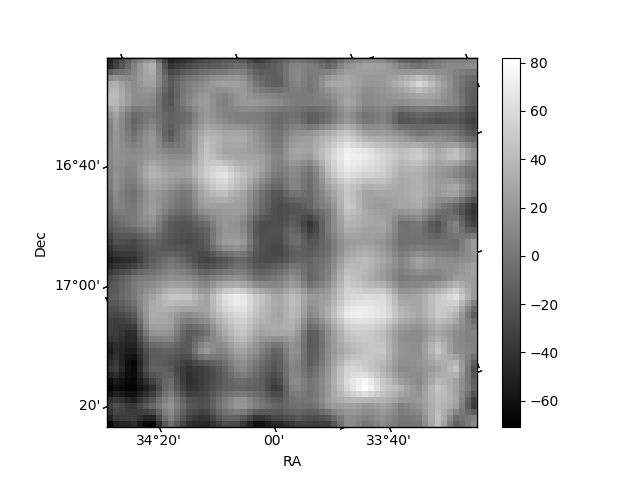
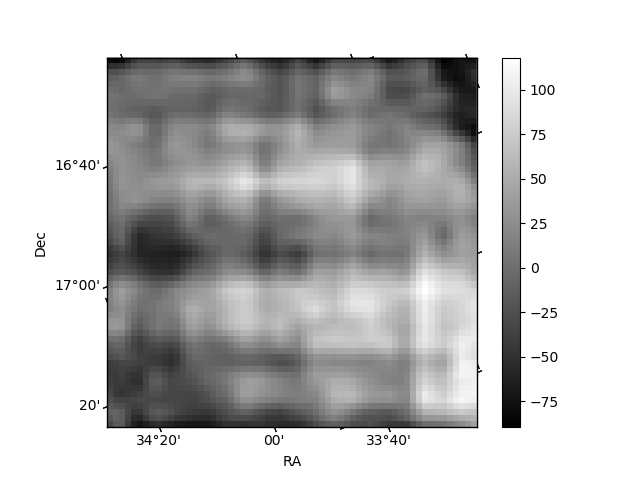
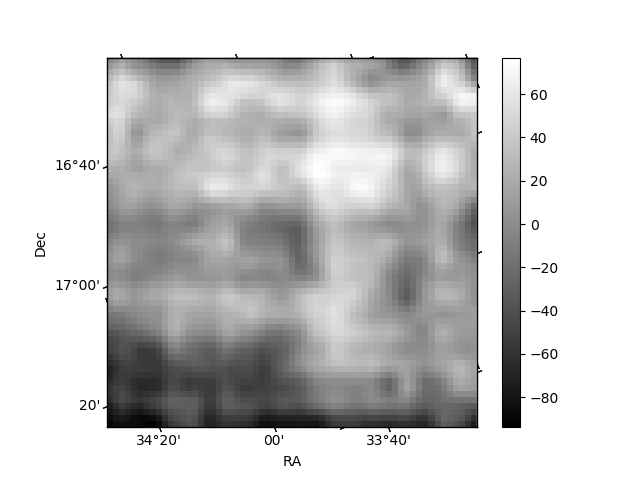
Histogram calculated using DETX and DETY for each event in the final _common_clean file
| Quadrant A | 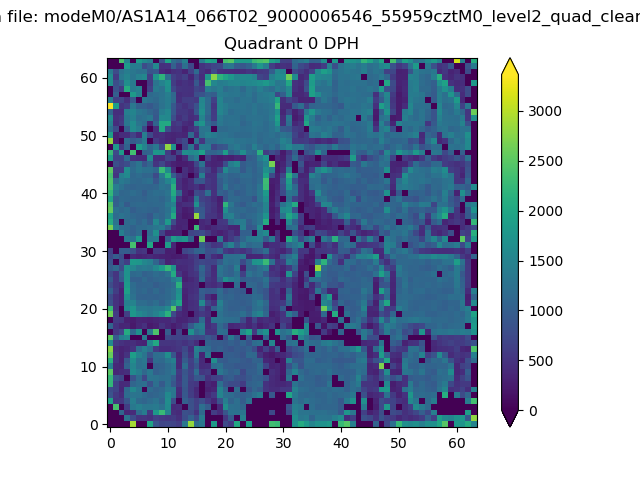 |
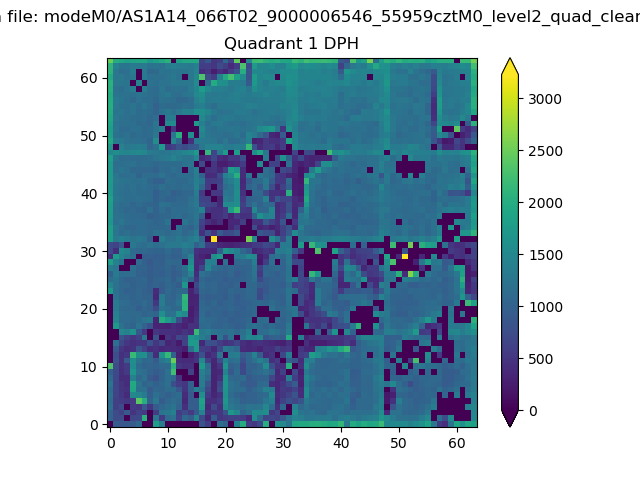 |
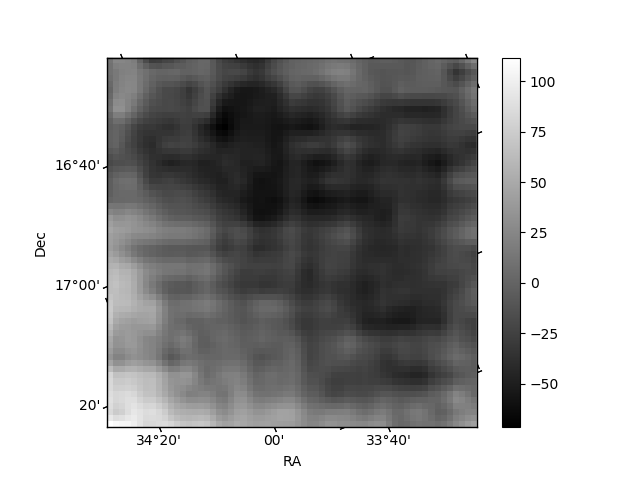
Quadrant B |
|---|---|---|---|
| Quadrant D | 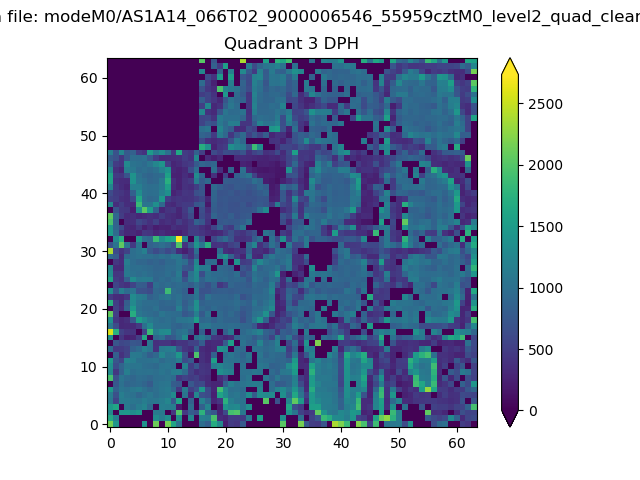 |
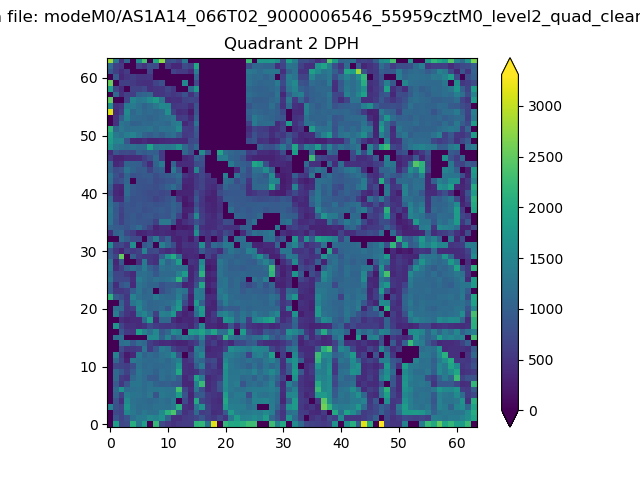 |
Quadrant C |
| Plot type | Count rate plots | Images |
|---|---|---|
| Comparison with Poisson distribution Blue bars denote a histogram of data divided into 1 sec bins. Red curve is a Poisson curve with rate = median count rate of data. |
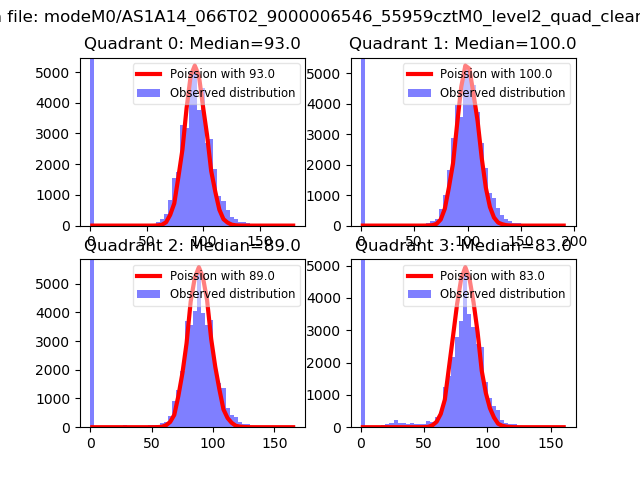 |
 |
| Quadrant-wise count rates Data is divided into 100 sec bins |
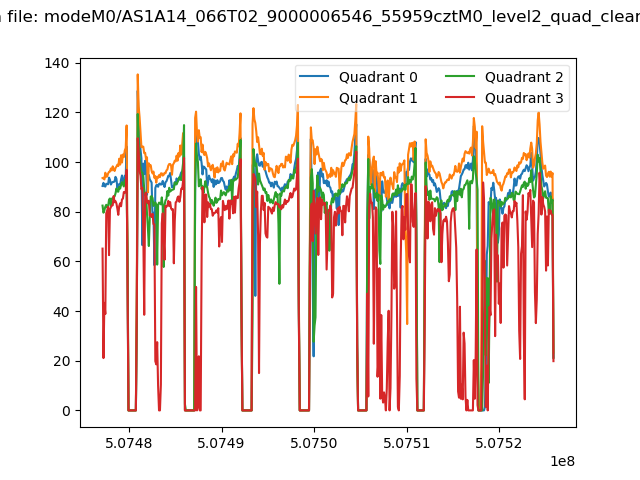 |
|
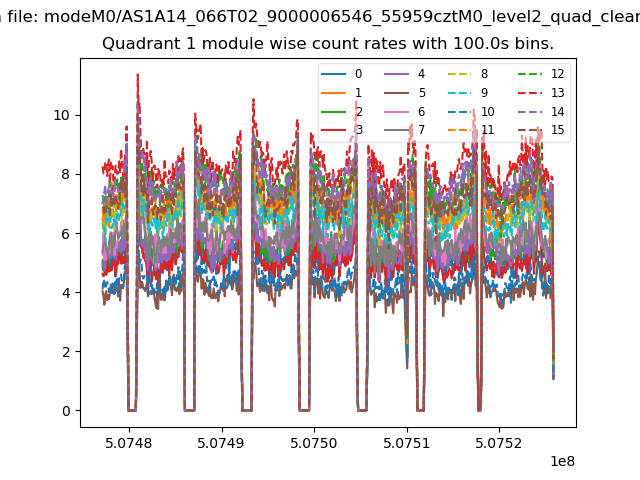
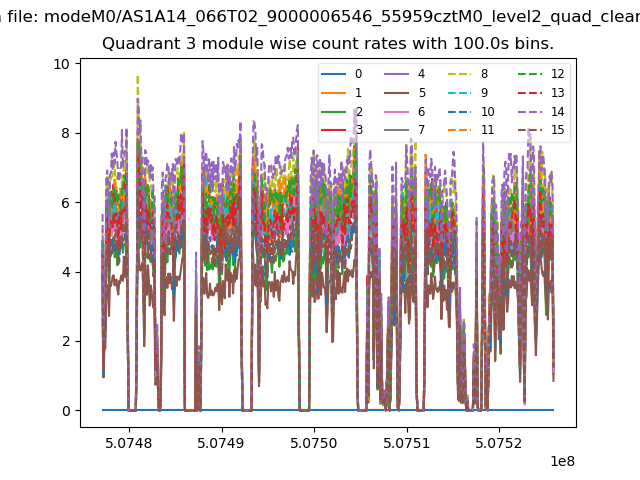
| Module-wise count rates for Quadrant A Data is divided into 100 sec bins |
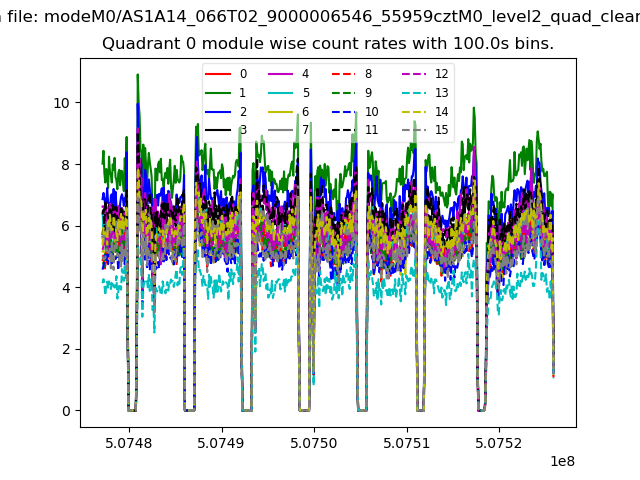 |
 |
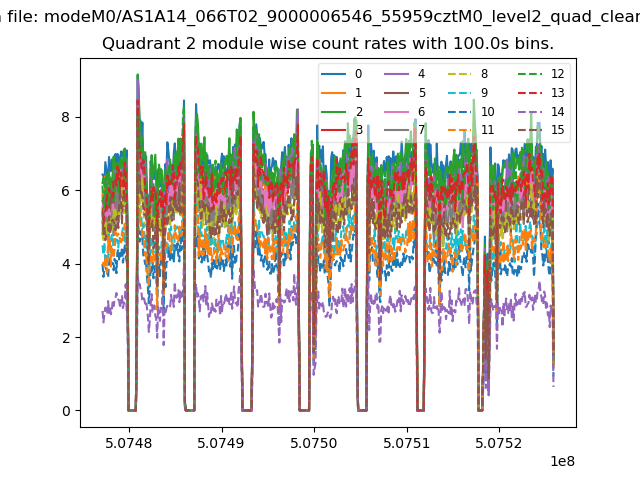
| Module-wise count rates for Quadrant B Data is divided into 100 sec bins |
 |
 |
| Module-wise count rates for Quadrant C Data is divided into 100 sec bins |
 |
 |
| Module-wise count rates for Quadrant D Data is divided into 100 sec bins |
 |
 |
| Parameter | Plot |
|---|---|
| CZT HV Monitor | 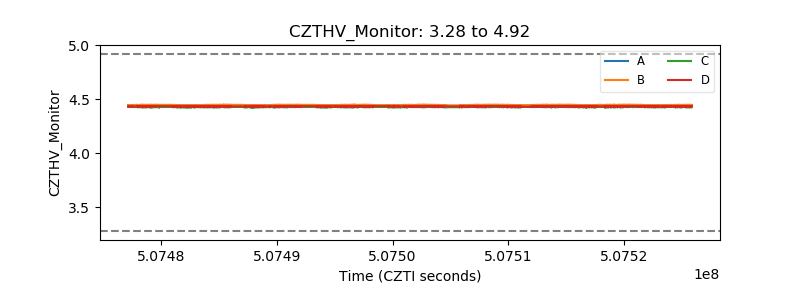 |
| D_VDD | 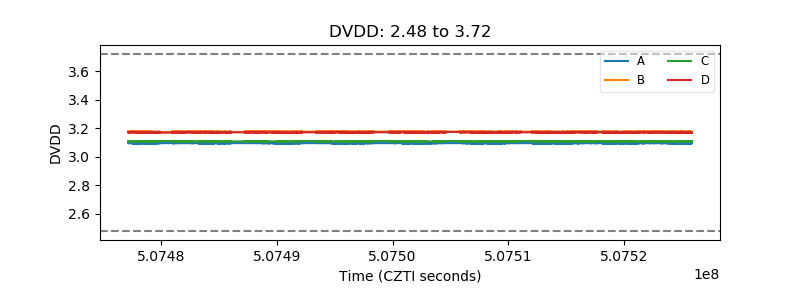 |
| Temperature 1 | 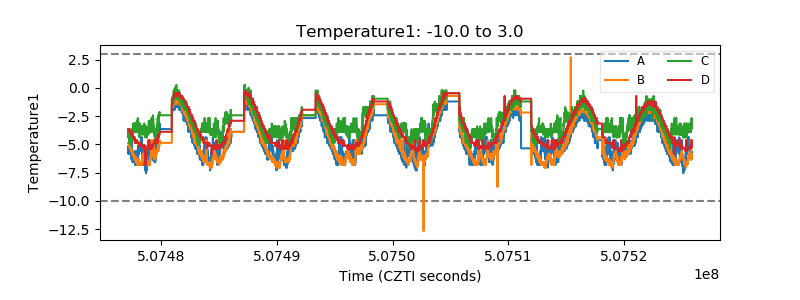 |
| Veto HV Monitor | 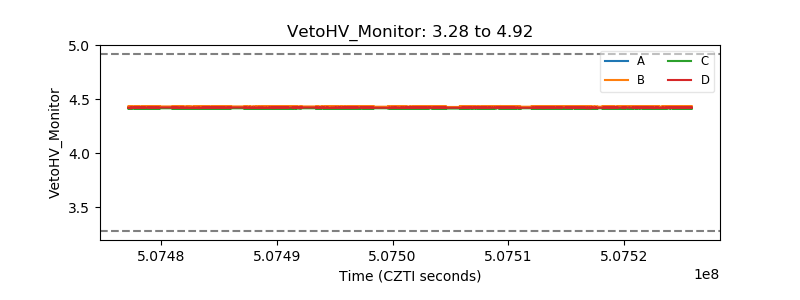 |
| Veto LLD | 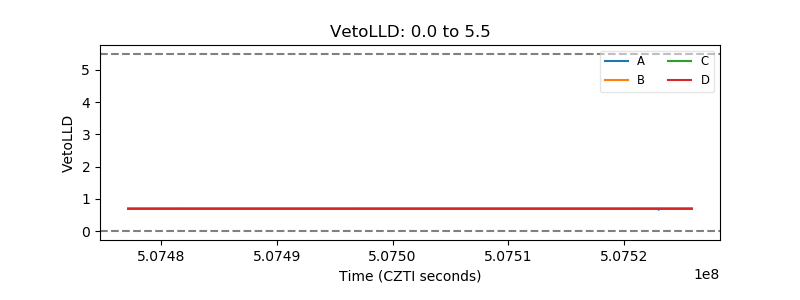 |
| Alpha Counter | 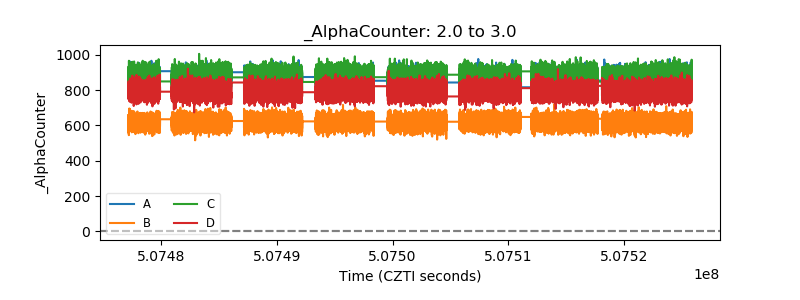 |
| _CPM_Rate | 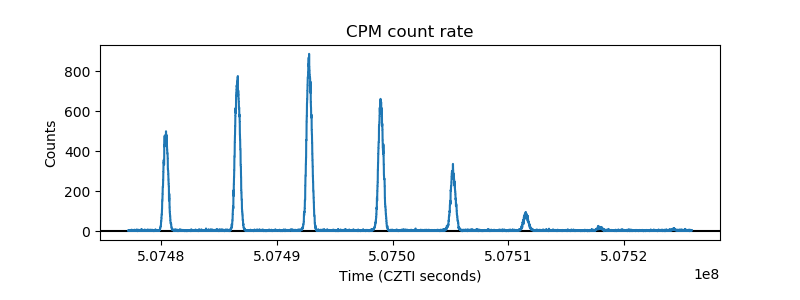 |
| CZT Counter | 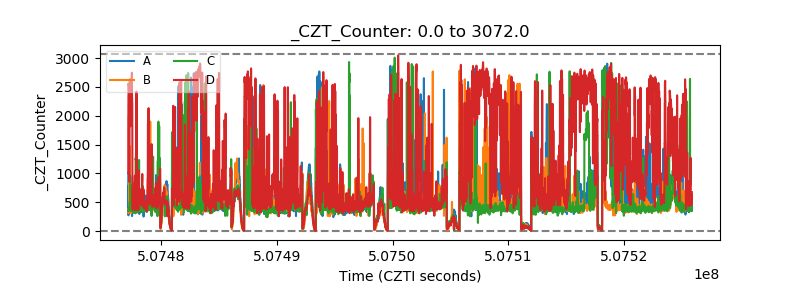 |
| +2.5 Volts monitor | 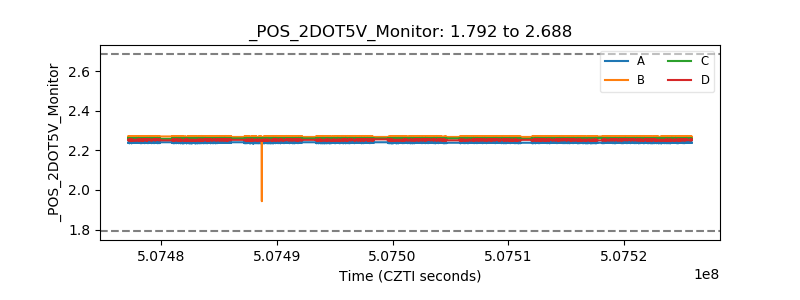 |
| +5 Volts monitor |  |
| _ROLL_ROT | 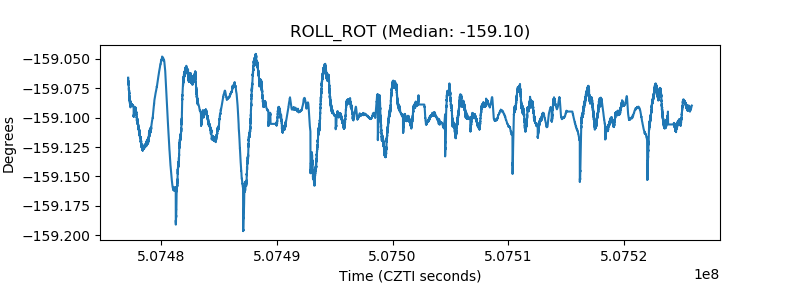 |
| _Roll_DEC | 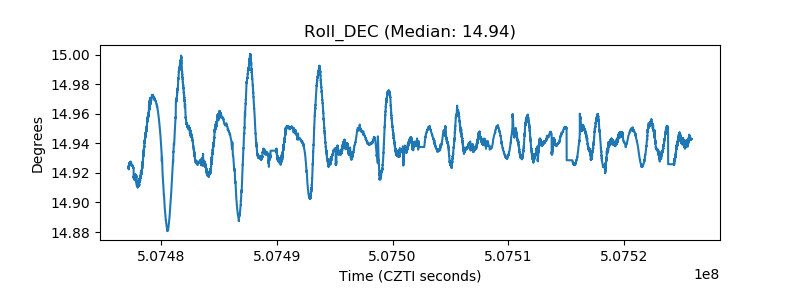 |
| _Roll_RA | 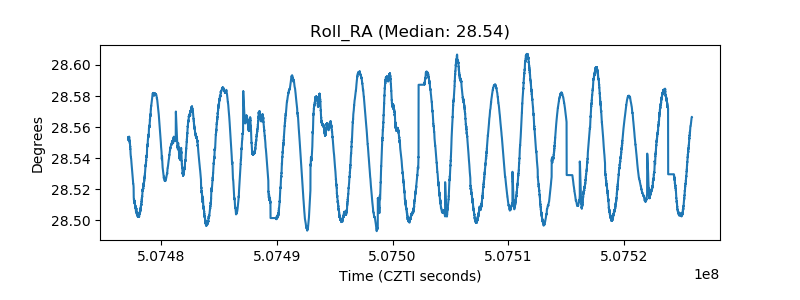 |
| Veto Counter | 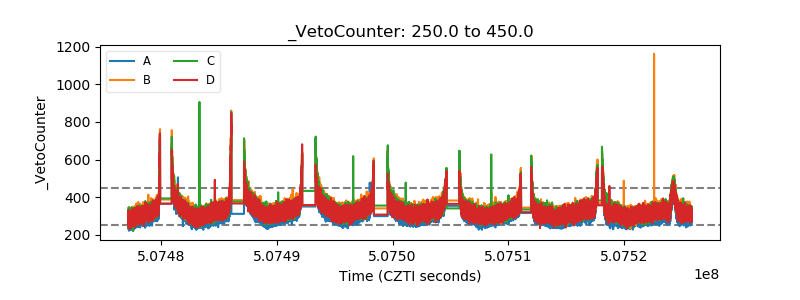 |