| Param | Original file | Final file |
|---|---|---|
| Filename | modeM0/AS1A14_066T02_9000006546_55960cztM0_level2.fits | modeM0/AS1A14_066T02_9000006546_55960cztM0_level2_quad_clean.evt |
| Size (bytes) | 651,761,280 | 109,748,160 |
| Size | 621.6 MB | 104.7 MB |
| Events in quadrant A | 4,000,933 | 742,404 |
| Events in quadrant B | 4,122,791 | 792,742 |
| Events in quadrant C | 4,803,691 | 700,792 |
| Events in quadrant D | 10,567,268 | 521,598 |
| Mode M0 | |||
|---|---|---|---|
| Quadrant | BADHDUFLAG | Total packets | Discarded packets |
| A | 0 | 17805 | 0 |
| B | 0 | 18248 | 0 |
| C | 0 | 20555 | 0 |
| D | 0 | 37039 | 6 |
| Mode SS | |||
|---|---|---|---|
| Quadrant | BADHDUFLAG | Total packets | Discarded packets |
| A | 0 | 162 | 0 |
| B | 0 | 162 | 0 |
| C | 0 | 162 | 0 |
| D | 0 | 162 | 0 |
| Quadrant | Total seconds | Saturated seconds | Saturation percentage |
|---|---|---|---|
| A | 8138 | 62 | 0.761858% |
| B | 8138 | 145 | 1.781765% |
| C | 8139 | 273 | 3.354220% |
| D | 8138 | 2014 | 24.748095% |
Noise dominated data is calculated using 1-second bins in cleaned event files. If a bin has >2000 counts, and if more than 50% of those come from <1% of pixels, then it is considered to be noise-dominated and hence unusable.
| Quadrant | # 1 sec bins | Bins with >0 counts | Bins with >2000 counts | High rate bins dominated by noise | Noise dominated (total time) | Noise dominated (detector-on time) | Marked lightcurve |
|---|---|---|---|---|---|---|---|
| A | 8138 | 8138 | 60 | 60 | 0.74% | 0.74% |  |
| B | 8138 | 8138 | 95 | 95 | 1.17% | 1.17% |  |
| C | 8139 | 8139 | 236 | 236 | 2.90% | 2.90% |  |
| D | 8139 | 8139 | 2022 | 2022 | 24.84% | 24.84% |  |
Top three noisy pixels from each quadrant. If the there are fewer than three noisy pixels in the level2.evt file, extra rows are filled as -1
| Pixel properties | Quadrant properties | ||||||
|---|---|---|---|---|---|---|---|
| Quadrant | DetID | PixID | Counts | Sigma | Mean | Median | Sigma |
| A | 0 | 8 | 199904 | 923.71 | 866 | 843 | 215.5 |
| A | 7 | 64 | 190711 | 881.05 | 866 | 843 | 215.5 |
| A | 12 | 115 | 173129 | 799.46 | 866 | 843 | 215.5 |
| B | 2 | 249 | 393240 | 2126.58 | 857 | 824 | 184.5 |
| B | 0 | 199 | 121351 | 653.16 | 857 | 824 | 184.5 |
| B | 7 | 252 | 75280 | 403.49 | 857 | 824 | 184.5 |
| C | 1 | 29 | 537065 | 2334.91 | 841 | 833 | 229.7 |
| C | 2 | 12 | 422461 | 1835.89 | 841 | 833 | 229.7 |
| C | 15 | 199 | 219081 | 950.32 | 841 | 833 | 229.7 |
| D | 11 | 129 | 7415069 | 34537.74 | 760 | 728 | 214.7 |
| D | 5 | 173 | 58254 | 267.97 | 760 | 728 | 214.7 |
| D | 2 | 120 | 42167 | 193.03 | 760 | 728 | 214.7 |
Histogram calculated using DETX and DETY for each event in the final _common_clean file
| Quadrant A | 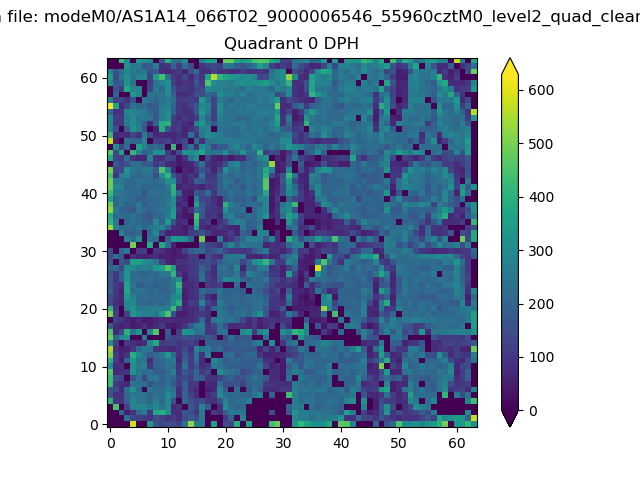 |
 |
Quadrant B |
|---|---|---|---|
| Quadrant D | 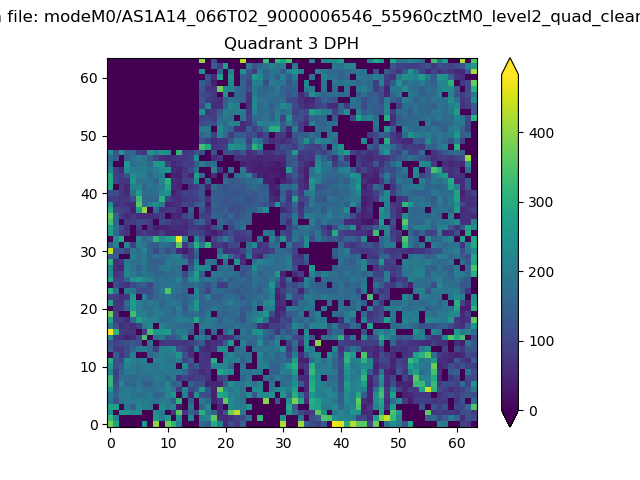 |
 |
Quadrant C |
| Plot type | Count rate plots | Images |
|---|---|---|
| Comparison with Poisson distribution Blue bars denote a histogram of data divided into 1 sec bins. Red curve is a Poisson curve with rate = median count rate of data. |
 |
 |
| Quadrant-wise count rates Data is divided into 100 sec bins |
 |
|
| Module-wise count rates for Quadrant A Data is divided into 100 sec bins |
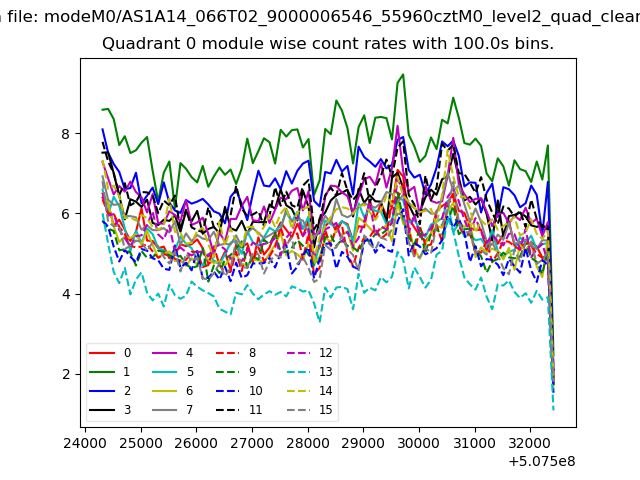 |
 |
| Module-wise count rates for Quadrant B Data is divided into 100 sec bins |
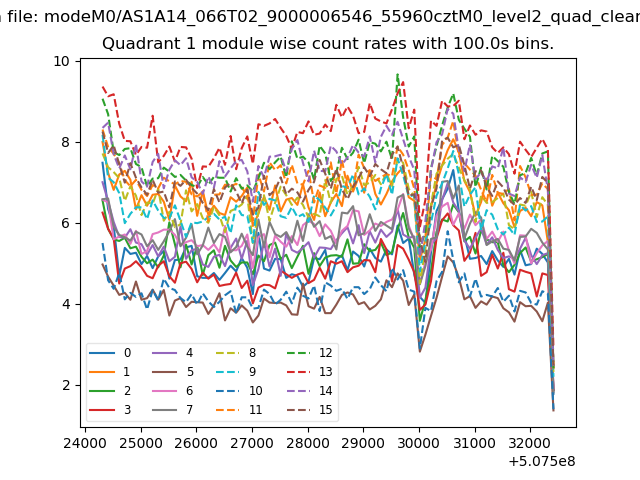 |
 |
| Module-wise count rates for Quadrant C Data is divided into 100 sec bins |
 |
 |
| Module-wise count rates for Quadrant D Data is divided into 100 sec bins |
 |
 |
| Parameter | Plot |
|---|---|
| CZT HV Monitor | 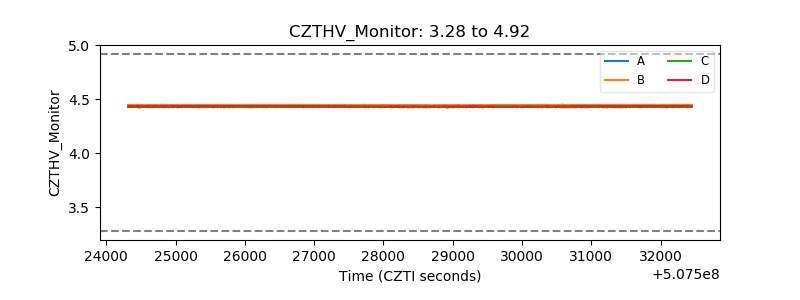 |
| D_VDD |  |
| Temperature 1 | 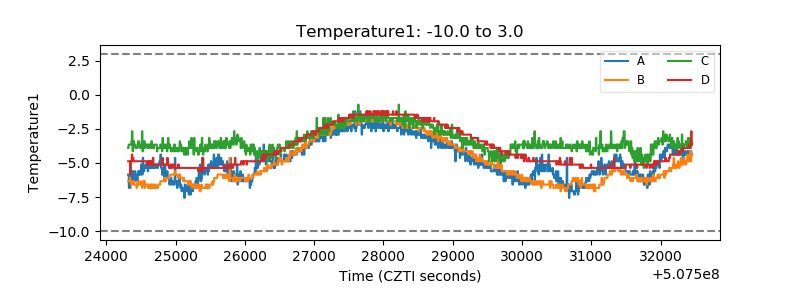 |
| Veto HV Monitor |  |
| Veto LLD |  |
| Alpha Counter | 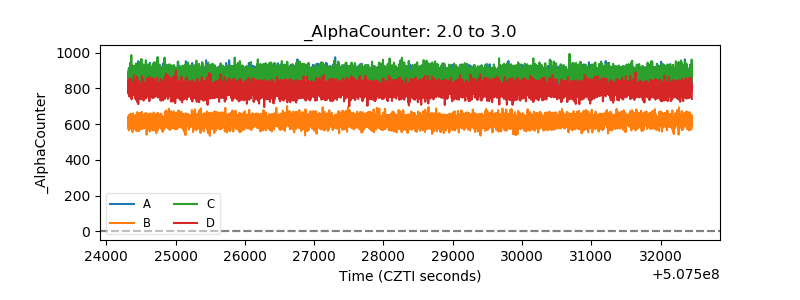 |
| _CPM_Rate | 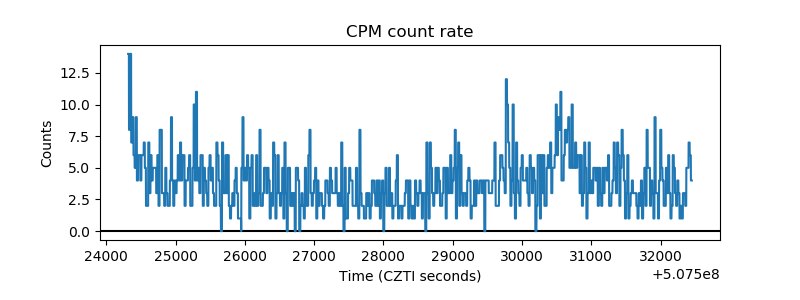 |
| CZT Counter | 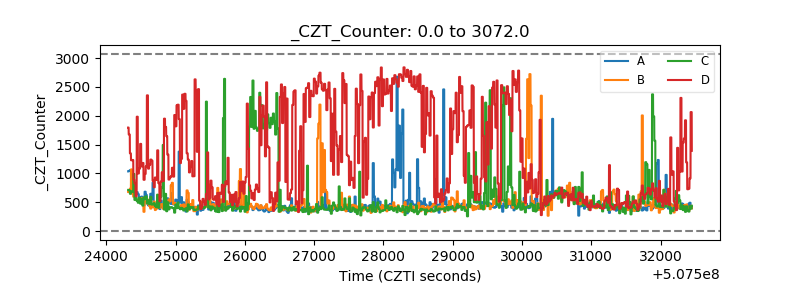 |
| +2.5 Volts monitor | 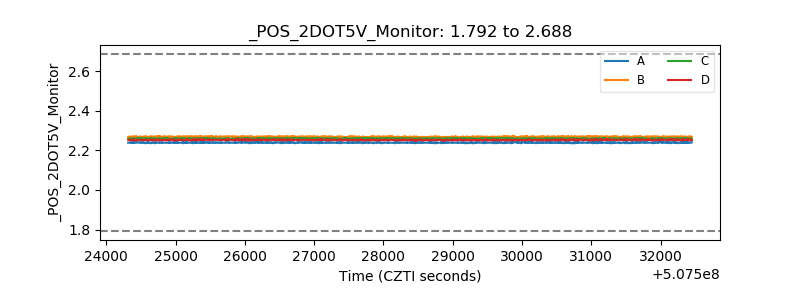 |
| +5 Volts monitor |  |
| _ROLL_ROT |  |
| _Roll_DEC |  |
| _Roll_RA |  |
| Veto Counter |  |