| Param | Original file | Final file |
|---|---|---|
| Filename | modeM0/AS1A14_066T02_9000006546_55963cztM0_level2.fits | modeM0/AS1A14_066T02_9000006546_55963cztM0_level2_quad_clean.evt |
| Size (bytes) | 1,352,393,280 | 258,845,760 |
| Size | 1.3 GB | 246.9 MB |
| Events in quadrant A | 10,399,194 | 1,722,820 |
| Events in quadrant B | 9,964,267 | 1,828,298 |
| Events in quadrant C | 10,166,910 | 1,666,240 |
| Events in quadrant D | 18,039,143 | 1,293,210 |
| Mode M9 | |||
|---|---|---|---|
| Quadrant | BADHDUFLAG | Total packets | Discarded packets |
| A | 0 | 10 | 0 |
| B | 0 | 10 | 0 |
| C | 0 | 10 | 0 |
| D | 0 | 10 | 0 |
| Mode M0 | |||
|---|---|---|---|
| Quadrant | BADHDUFLAG | Total packets | Discarded packets |
| A | 0 | 44851 | 2 |
| B | 0 | 43767 | 2 |
| C | 0 | 45444 | 3 |
| D | 0 | 67015 | 2 |
| Mode SS | |||
|---|---|---|---|
| Quadrant | BADHDUFLAG | Total packets | Discarded packets |
| A | 0 | 386 | 0 |
| B | 0 | 386 | 0 |
| C | 0 | 386 | 0 |
| D | 0 | 386 | 0 |
| Quadrant | Total seconds | Saturated seconds | Saturation percentage |
|---|---|---|---|
| A | 19261 | 620 | 3.218940% |
| B | 19261 | 676 | 3.509683% |
| C | 19261 | 445 | 2.310368% |
| D | 19261 | 3316 | 17.216136% |
Noise dominated data is calculated using 1-second bins in cleaned event files. If a bin has >2000 counts, and if more than 50% of those come from <1% of pixels, then it is considered to be noise-dominated and hence unusable.
| Quadrant | # 1 sec bins | Bins with >0 counts | Bins with >2000 counts | High rate bins dominated by noise | Noise dominated (total time) | Noise dominated (detector-on time) | Marked lightcurve |
|---|---|---|---|---|---|---|---|
| A | 20161 | 19263 | 284 | 284 | 1.41% | 1.47% | 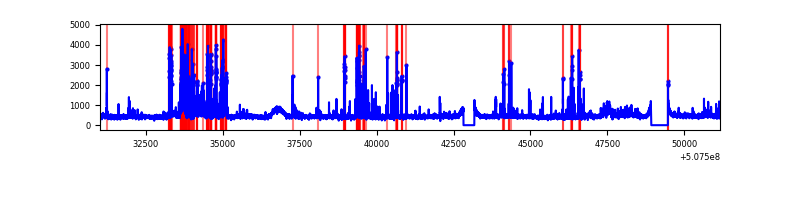 |
| B | 20161 | 19263 | 207 | 207 | 1.03% | 1.07% | 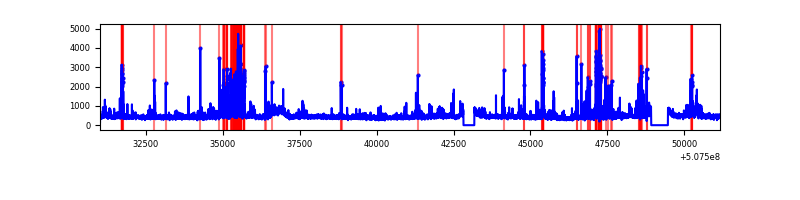 |
| C | 20161 | 19263 | 316 | 316 | 1.57% | 1.64% | 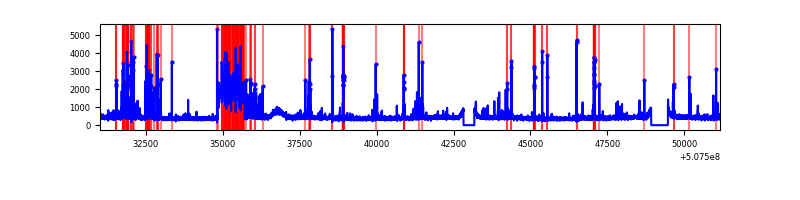 |
| D | 20161 | 19263 | 3143 | 3143 | 15.59% | 16.32% | 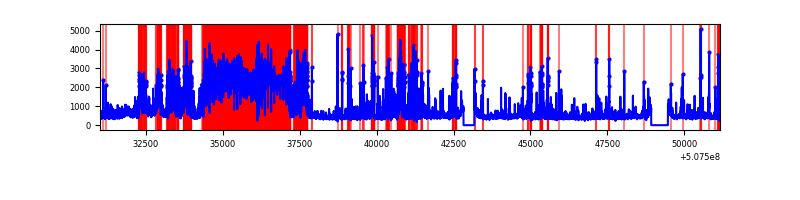 |
Top three noisy pixels from each quadrant. If the there are fewer than three noisy pixels in the level2.evt file, extra rows are filled as -1
| Pixel properties | Quadrant properties | ||||||
|---|---|---|---|---|---|---|---|
| Quadrant | DetID | PixID | Counts | Sigma | Mean | Median | Sigma |
| A | 7 | 64 | 1620184 | 3208.55 | 2047 | 1993 | 504.3 |
| A | 0 | 8 | 513748 | 1014.71 | 2047 | 1993 | 504.3 |
| A | 4 | 3 | 147590 | 288.69 | 2047 | 1993 | 504.3 |
| B | 2 | 249 | 1123851 | 2605.44 | 2017 | 1941 | 430.6 |
| B | 0 | 199 | 342104 | 789.97 | 2017 | 1941 | 430.6 |
| B | 0 | 213 | 109769 | 250.41 | 2017 | 1941 | 430.6 |
| C | 1 | 29 | 1138843 | 2108.87 | 1987 | 1967 | 539.1 |
| C | 2 | 12 | 503019 | 929.43 | 1987 | 1967 | 539.1 |
| C | 15 | 199 | 219788 | 404.05 | 1987 | 1967 | 539.1 |
| D | 11 | 129 | 10001511 | 19604.49 | 1811 | 1735 | 510.1 |
| D | 7 | 129 | 176986 | 343.58 | 1811 | 1735 | 510.1 |
| D | 2 | 172 | 174030 | 337.78 | 1811 | 1735 | 510.1 |
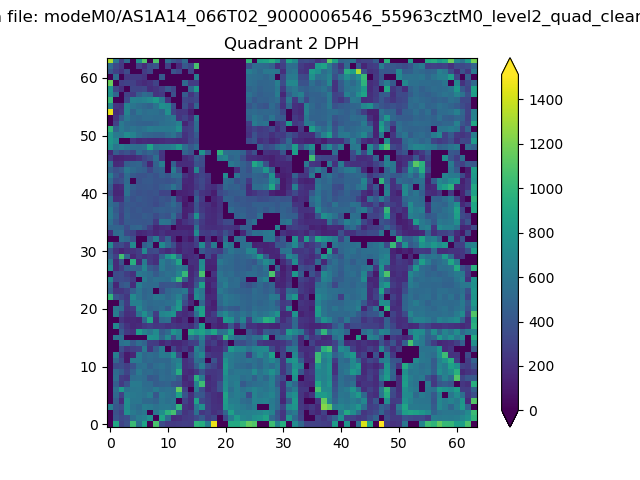
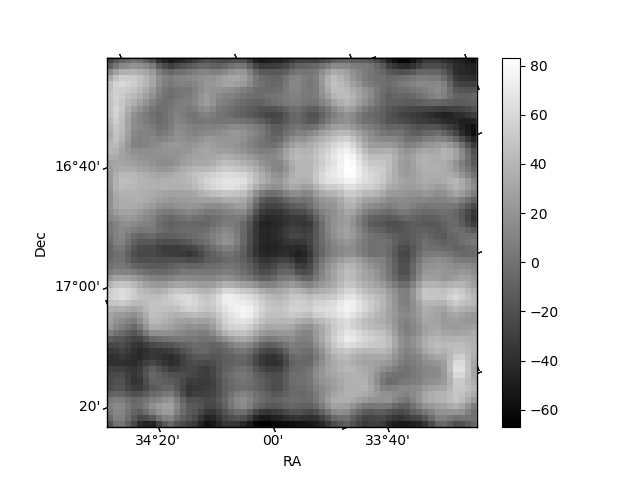
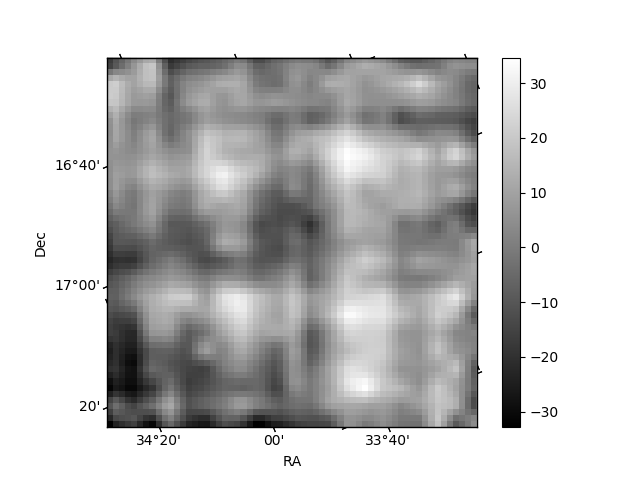
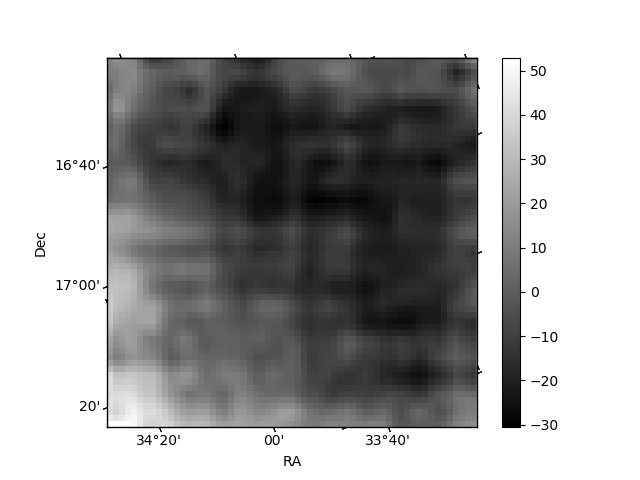
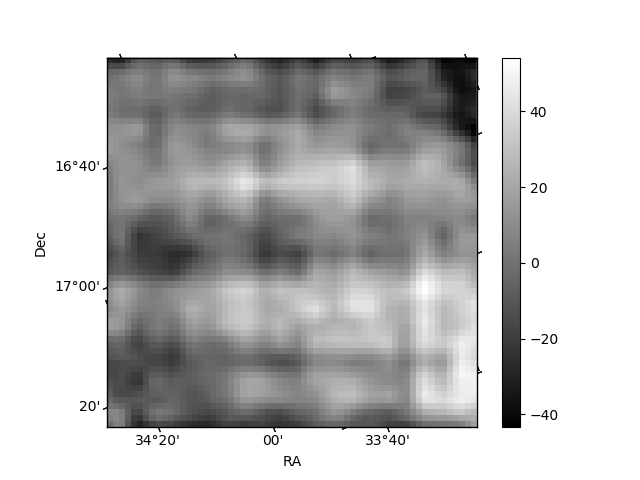
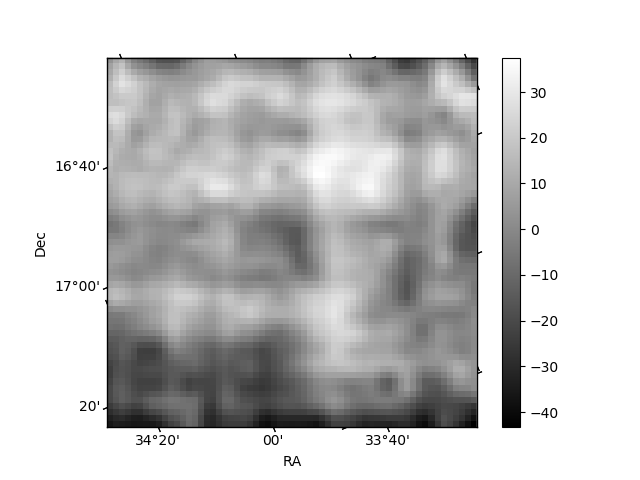
Histogram calculated using DETX and DETY for each event in the final _common_clean file
| Quadrant A | 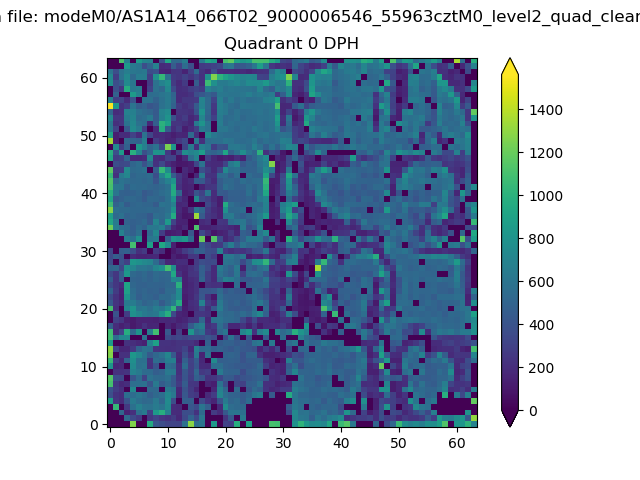 |
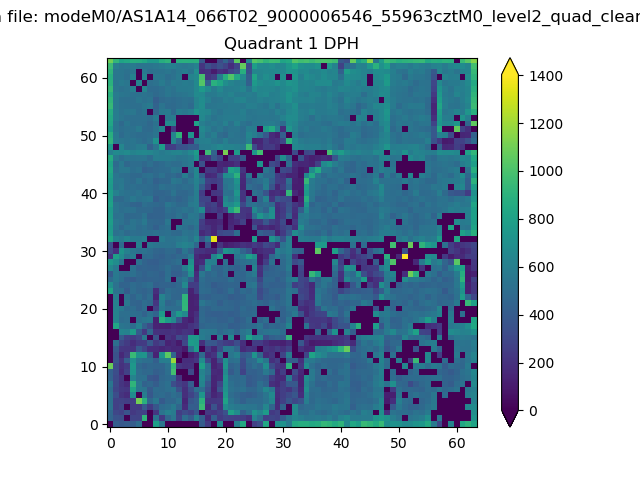 |
Quadrant B |
|---|---|---|---|
| Quadrant D | 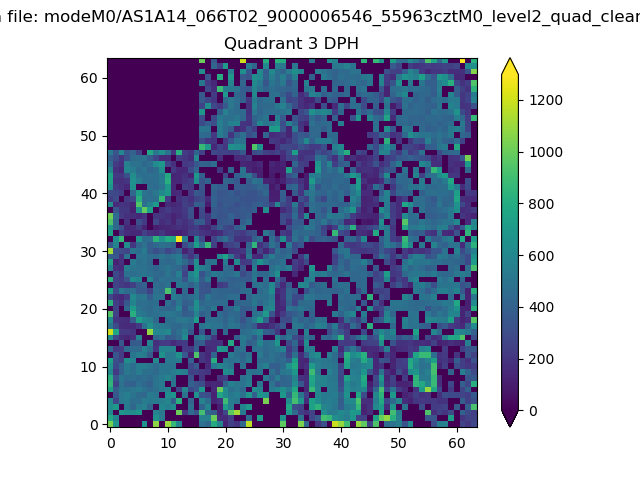 |
 |
Quadrant C |
| Plot type | Count rate plots | Images |
|---|---|---|
| Comparison with Poisson distribution Blue bars denote a histogram of data divided into 1 sec bins. Red curve is a Poisson curve with rate = median count rate of data. |
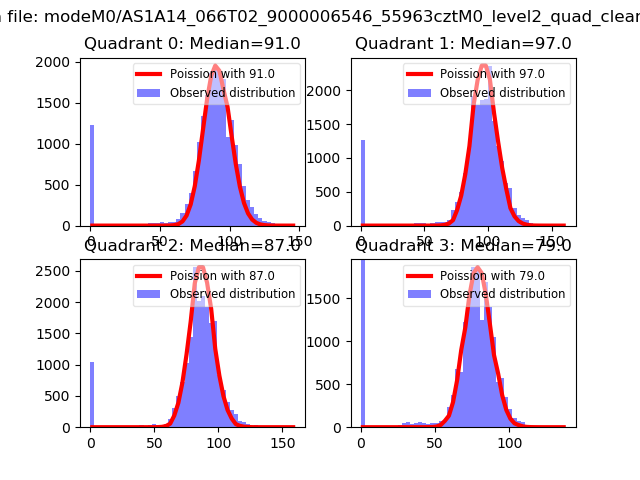 |
 |
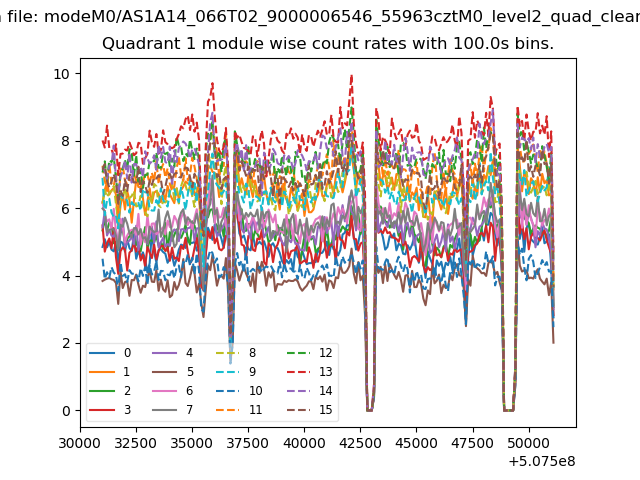
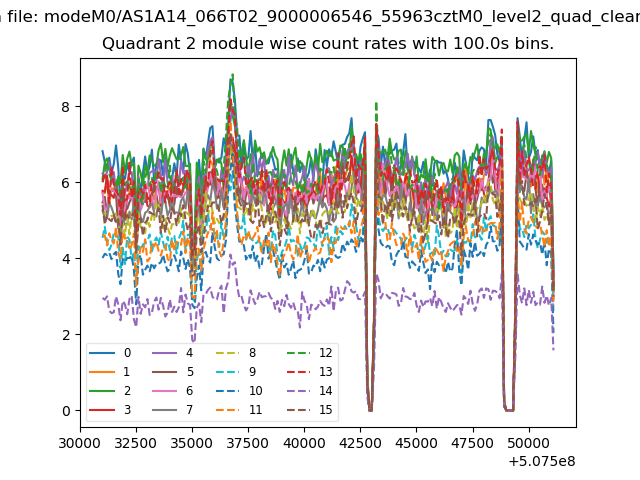
| Quadrant-wise count rates Data is divided into 100 sec bins |
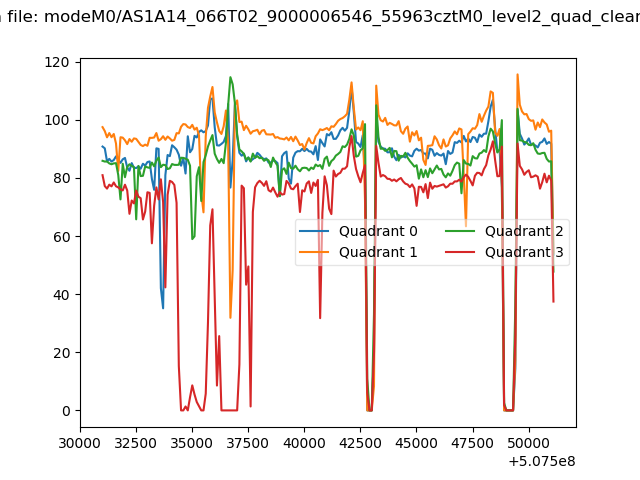 |
|
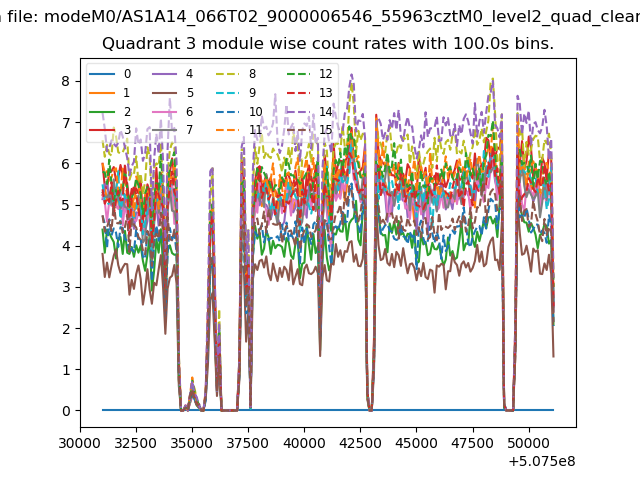
| Module-wise count rates for Quadrant A Data is divided into 100 sec bins |
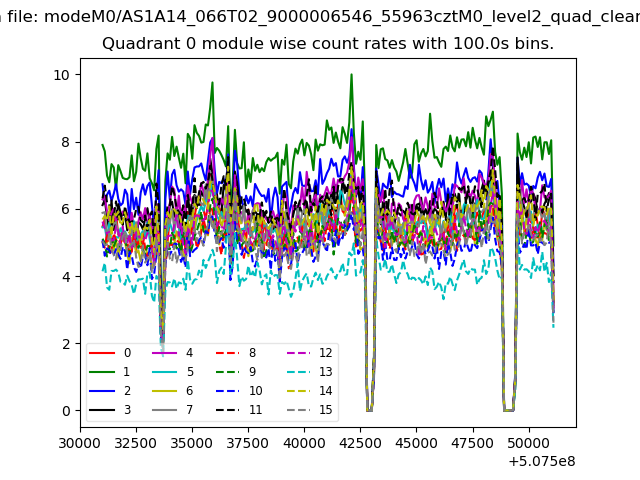 |
 |
| Module-wise count rates for Quadrant B Data is divided into 100 sec bins |
 |
 |
| Module-wise count rates for Quadrant C Data is divided into 100 sec bins |
 |
 |
| Module-wise count rates for Quadrant D Data is divided into 100 sec bins |
 |
 |
| Parameter | Plot |
|---|---|
| CZT HV Monitor | 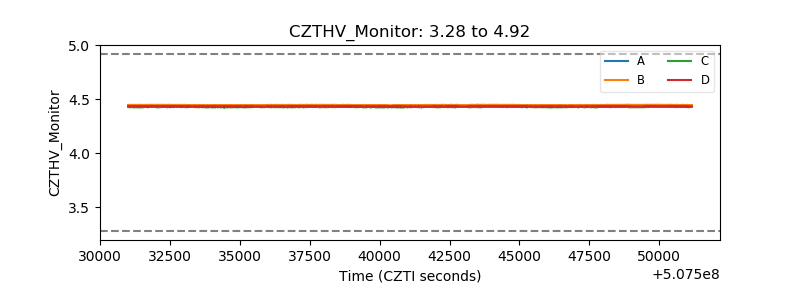 |
| D_VDD | 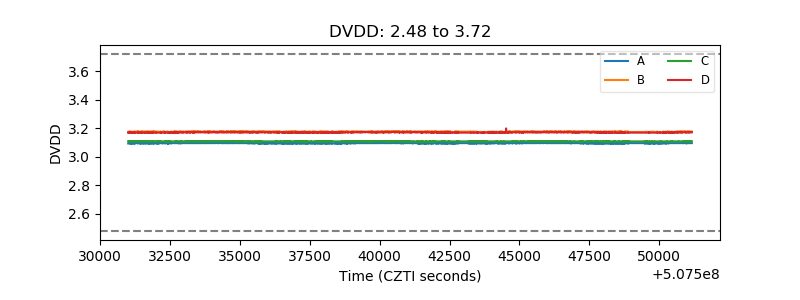 |
| Temperature 1 | 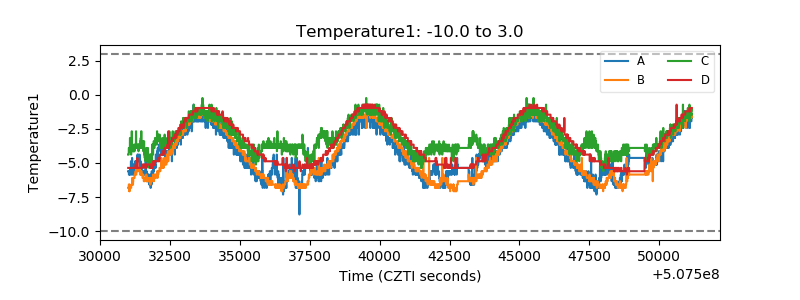 |
| Veto HV Monitor | 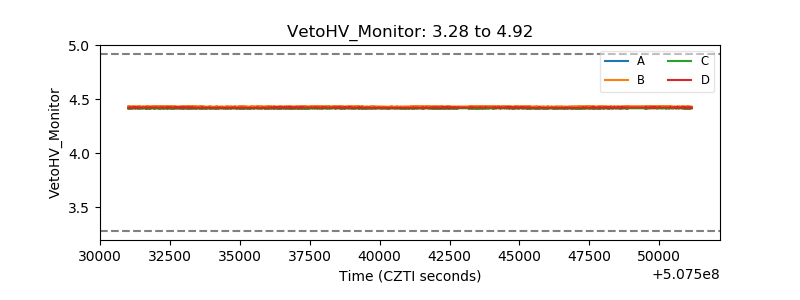 |
| Veto LLD | 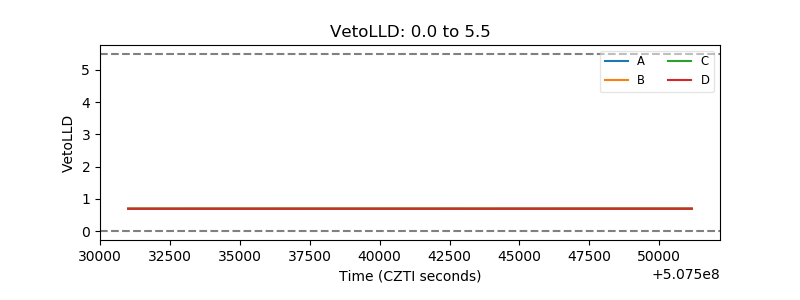 |
| Alpha Counter | 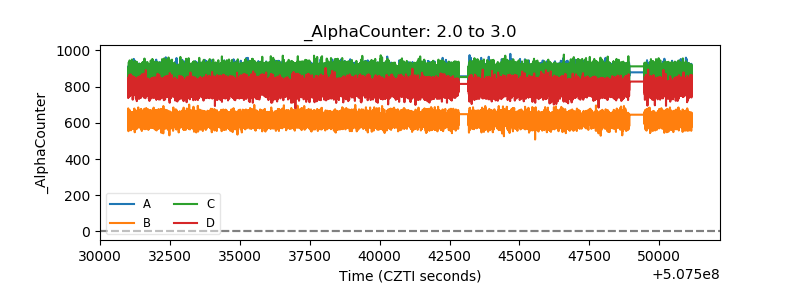 |
| _CPM_Rate | 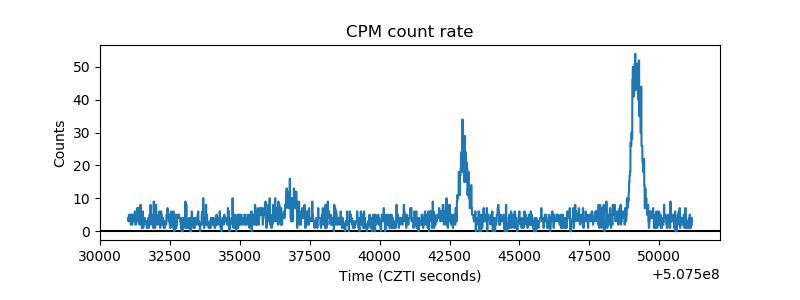 |
| CZT Counter | 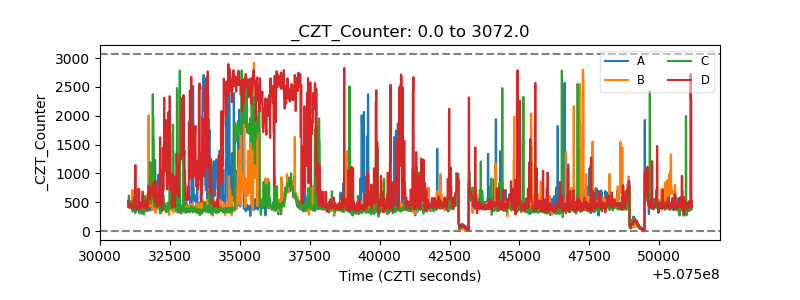 |
| +2.5 Volts monitor | 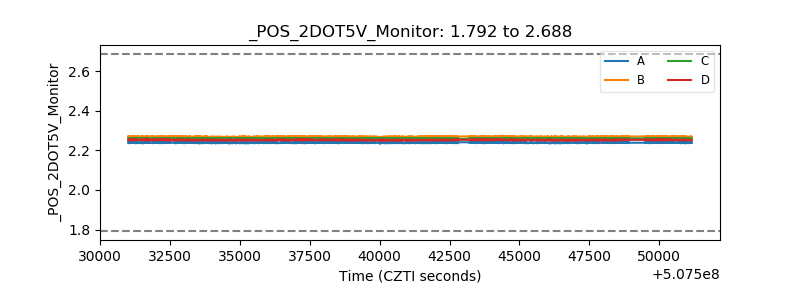 |
| +5 Volts monitor |  |
| _ROLL_ROT | 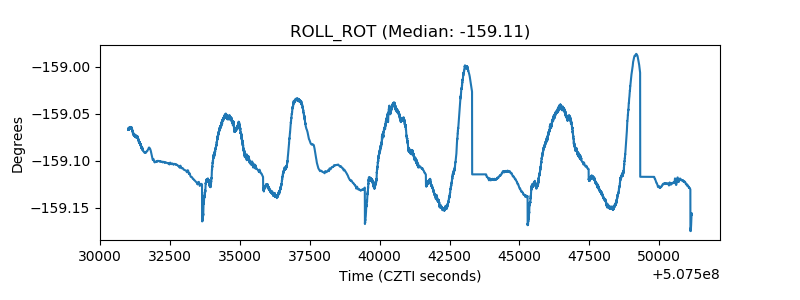 |
| _Roll_DEC | 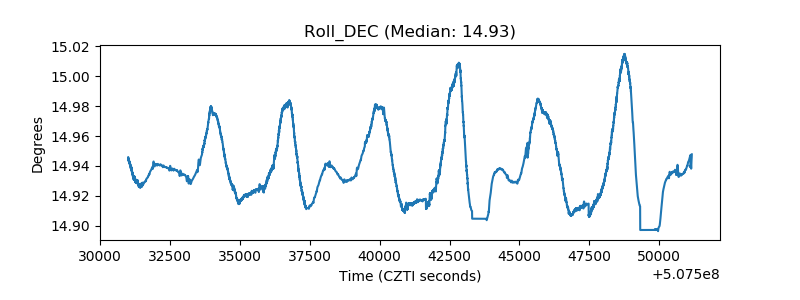 |
| _Roll_RA | 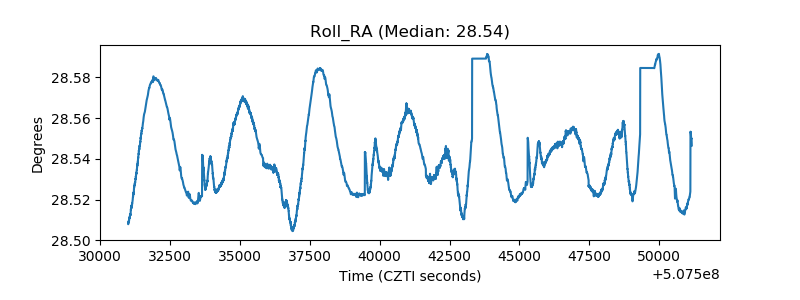 |
| Veto Counter | 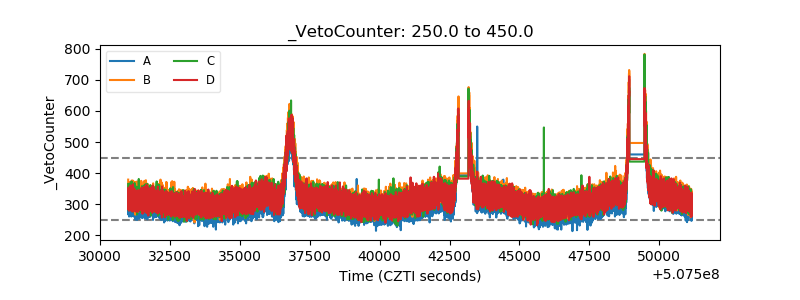 |