| Param | Original file | Final file |
|---|---|---|
| Filename | modeM0/AS1A14_066T02_9000006546_55964cztM0_level2.fits | modeM0/AS1A14_066T02_9000006546_55964cztM0_level2_quad_clean.evt |
| Size (bytes) | 395,804,160 | 93,890,880 |
| Size | 377.5 MB | 89.5 MB |
| Events in quadrant A | 3,795,386 | 609,398 |
| Events in quadrant B | 3,784,247 | 643,622 |
| Events in quadrant C | 3,117,980 | 578,386 |
| Events in quadrant D | 3,441,526 | 552,558 |
| Mode M9 | |||
|---|---|---|---|
| Quadrant | BADHDUFLAG | Total packets | Discarded packets |
| A | 0 | 8 | 0 |
| B | 0 | 8 | 0 |
| C | 0 | 8 | 0 |
| D | 0 | 8 | 0 |
| Mode M0 | |||
|---|---|---|---|
| Quadrant | BADHDUFLAG | Total packets | Discarded packets |
| A | 0 | 15764 | 1 |
| B | 0 | 15822 | 1 |
| C | 0 | 14401 | 1 |
| D | 0 | 14834 | 1 |
| Mode SS | |||
|---|---|---|---|
| Quadrant | BADHDUFLAG | Total packets | Discarded packets |
| A | 0 | 134 | 0 |
| B | 0 | 134 | 0 |
| C | 0 | 134 | 0 |
| D | 0 | 134 | 0 |
| Quadrant | Total seconds | Saturated seconds | Saturation percentage |
|---|---|---|---|
| A | 6581 | 136 | 2.066555% |
| B | 6582 | 168 | 2.552416% |
| C | 6582 | 90 | 1.367366% |
| D | 6582 | 101 | 1.534488% |
Noise dominated data is calculated using 1-second bins in cleaned event files. If a bin has >2000 counts, and if more than 50% of those come from <1% of pixels, then it is considered to be noise-dominated and hence unusable.
| Quadrant | # 1 sec bins | Bins with >0 counts | Bins with >2000 counts | High rate bins dominated by noise | Noise dominated (total time) | Noise dominated (detector-on time) | Marked lightcurve |
|---|---|---|---|---|---|---|---|
| A | 7356 | 6582 | 90 | 90 | 1.22% | 1.37% | 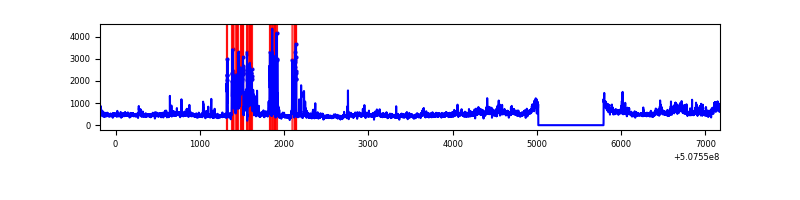 |
| B | 7357 | 6583 | 89 | 89 | 1.21% | 1.35% | 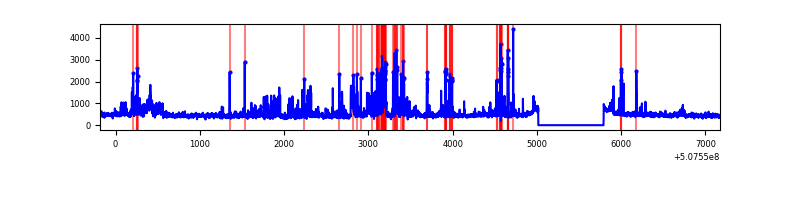 |
| C | 7357 | 6583 | 56 | 56 | 0.76% | 0.85% | 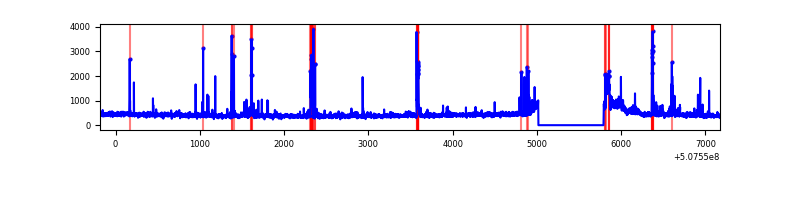 |
| D | 7357 | 6583 | 66 | 66 | 0.90% | 1.00% | 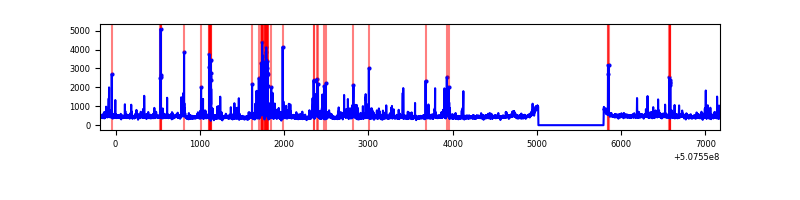 |
Top three noisy pixels from each quadrant. If the there are fewer than three noisy pixels in the level2.evt file, extra rows are filled as -1
| Pixel properties | Quadrant properties | ||||||
|---|---|---|---|---|---|---|---|
| Quadrant | DetID | PixID | Counts | Sigma | Mean | Median | Sigma |
| A | 7 | 64 | 881111 | 5108.77 | 696 | 678 | 172.3 |
| A | 4 | 78 | 46723 | 267.18 | 696 | 678 | 172.3 |
| A | 12 | 115 | 45367 | 259.31 | 696 | 678 | 172.3 |
| B | 2 | 249 | 707229 | 4804.63 | 683 | 659 | 147.1 |
| B | 0 | 199 | 159942 | 1083.11 | 683 | 659 | 147.1 |
| B | 7 | 0 | 65251 | 439.22 | 683 | 659 | 147.1 |
| C | 13 | 3 | 249182 | 1352.84 | 671 | 666 | 183.7 |
| C | 12 | 249 | 84436 | 456.02 | 671 | 666 | 183.7 |
| C | 15 | 199 | 73356 | 395.7 | 671 | 666 | 183.7 |
| D | 11 | 129 | 262071 | 1363.07 | 673 | 644 | 191.8 |
| D | 7 | 96 | 196466 | 1021.01 | 673 | 644 | 191.8 |
| D | 7 | 129 | 83950 | 434.35 | 673 | 644 | 191.8 |
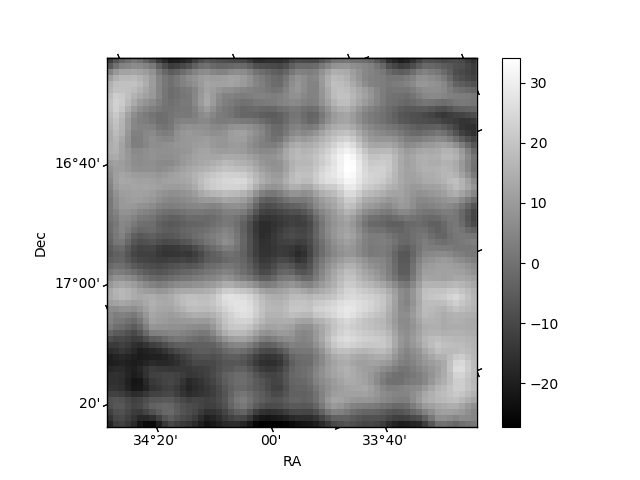
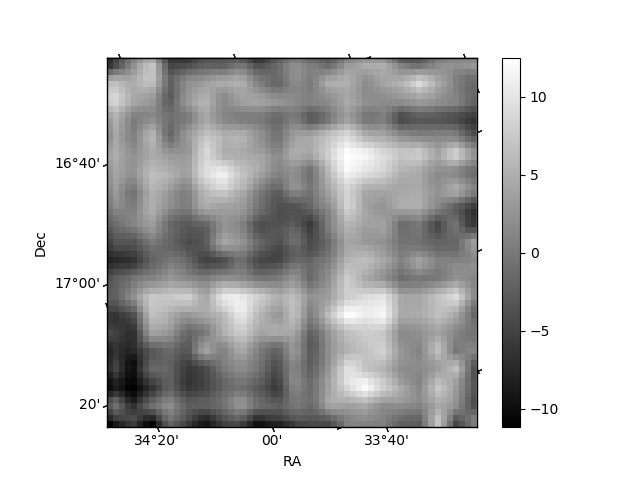
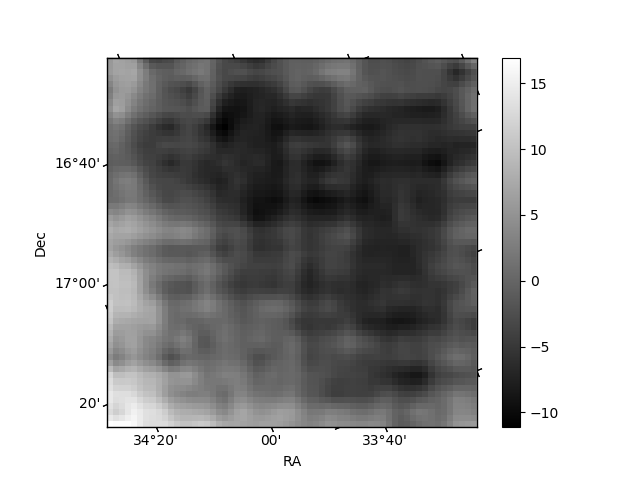
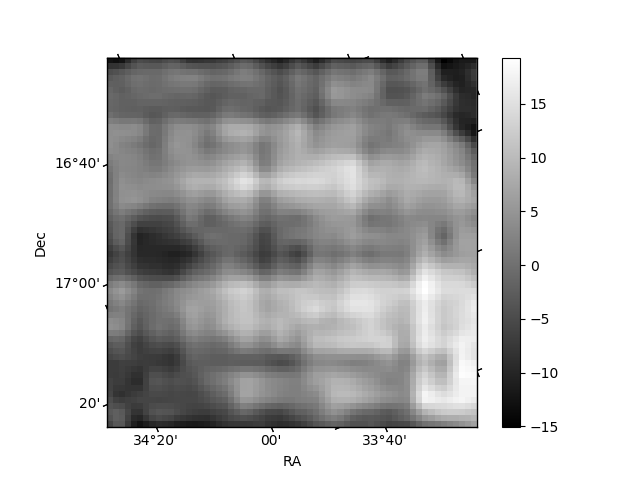
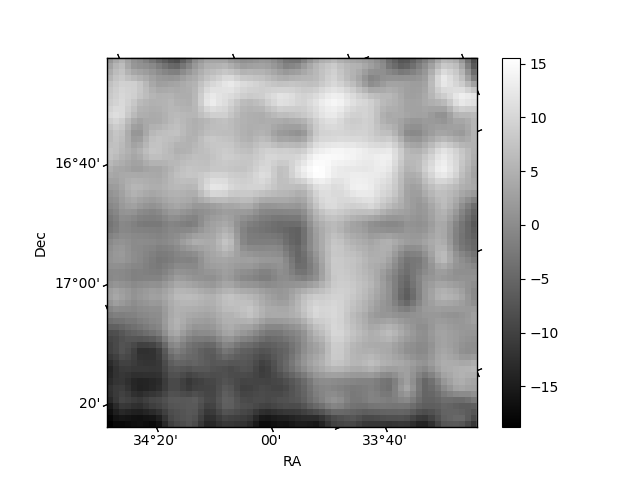
Histogram calculated using DETX and DETY for each event in the final _common_clean file
| Quadrant A | 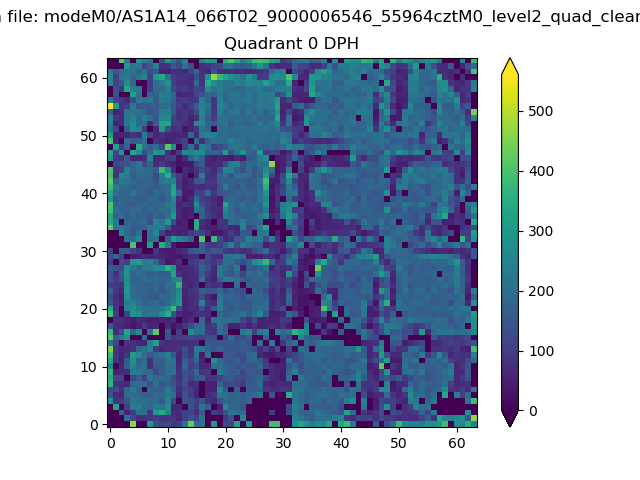 |
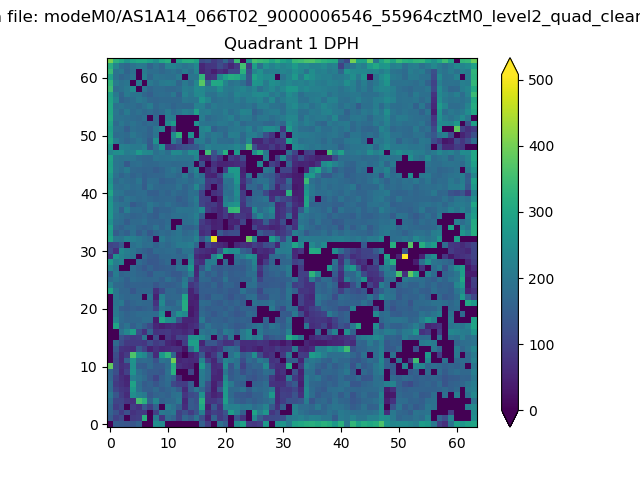 |
Quadrant B |
|---|---|---|---|
| Quadrant D |  |
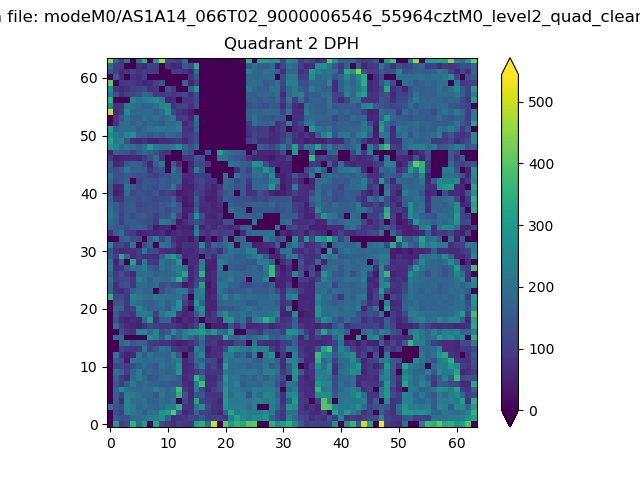 |
Quadrant C |
| Plot type | Count rate plots | Images |
|---|---|---|
| Comparison with Poisson distribution Blue bars denote a histogram of data divided into 1 sec bins. Red curve is a Poisson curve with rate = median count rate of data. |
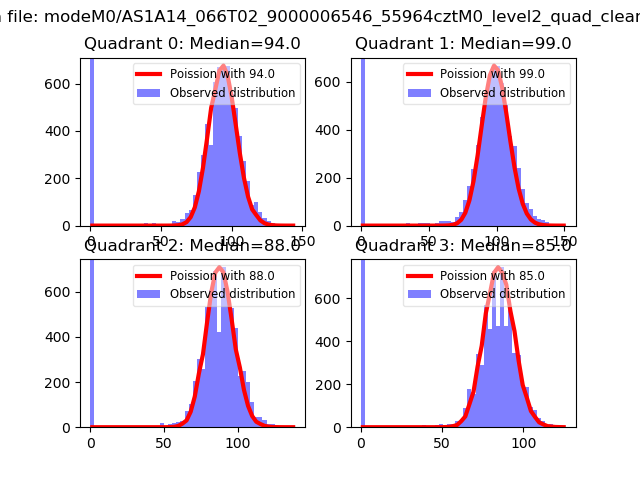 |
 |
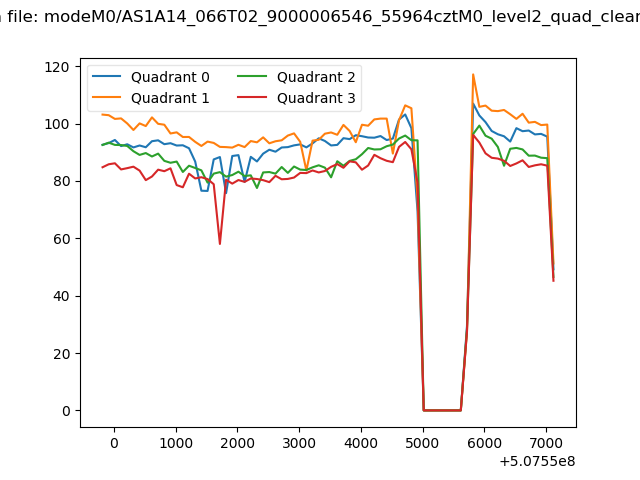
| Quadrant-wise count rates Data is divided into 100 sec bins |
 |
|
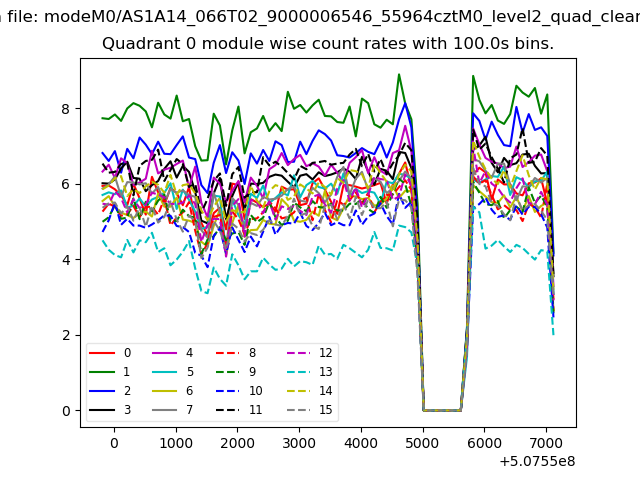
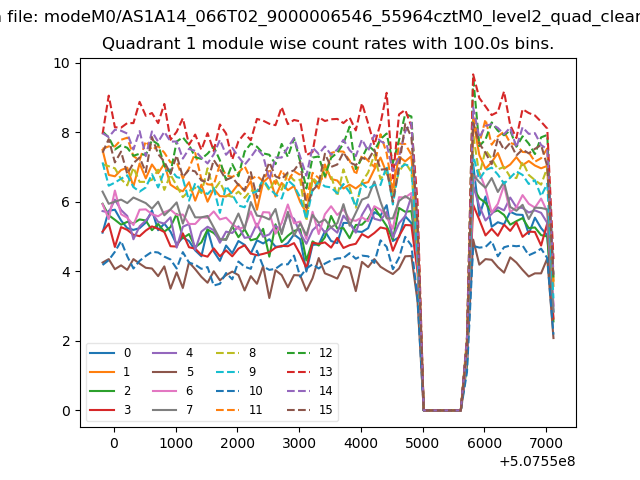
| Module-wise count rates for Quadrant A Data is divided into 100 sec bins |
 |
 |
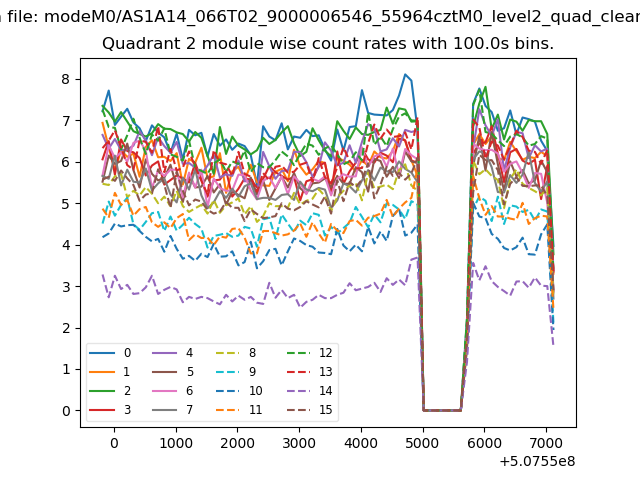
| Module-wise count rates for Quadrant B Data is divided into 100 sec bins |
 |
 |
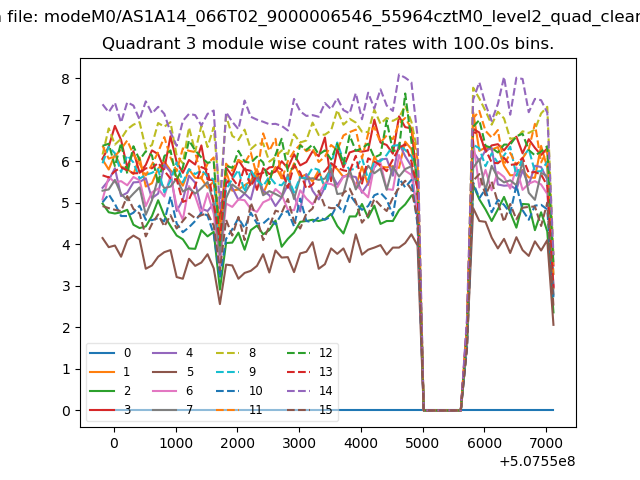
| Module-wise count rates for Quadrant C Data is divided into 100 sec bins |
 |
 |
| Module-wise count rates for Quadrant D Data is divided into 100 sec bins |
 |
 |
| Parameter | Plot |
|---|---|
| CZT HV Monitor | 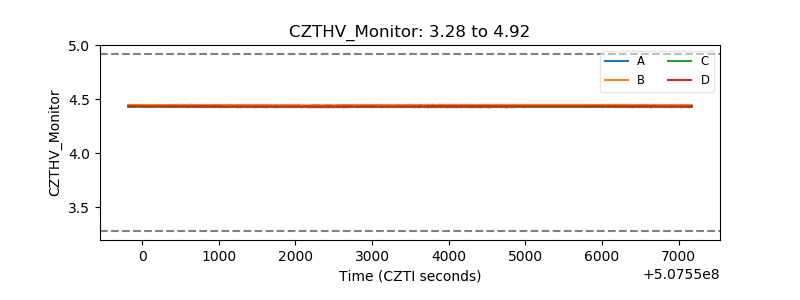 |
| D_VDD | 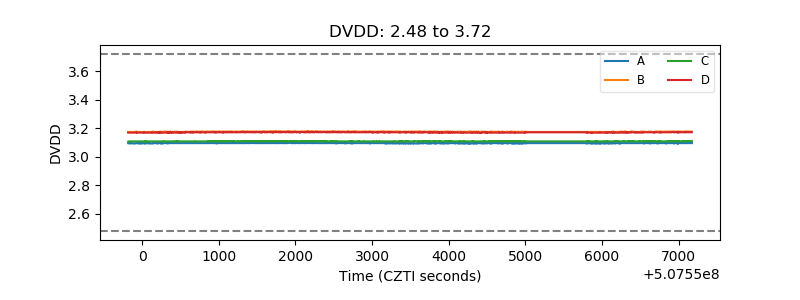 |
| Temperature 1 | 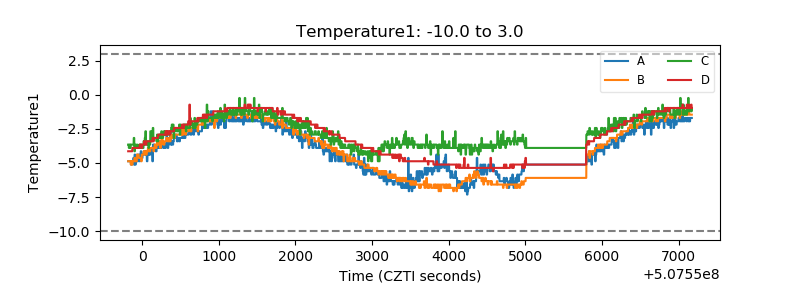 |
| Veto HV Monitor | 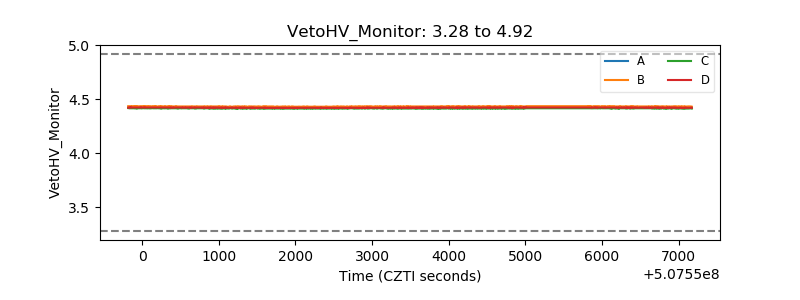 |
| Veto LLD | 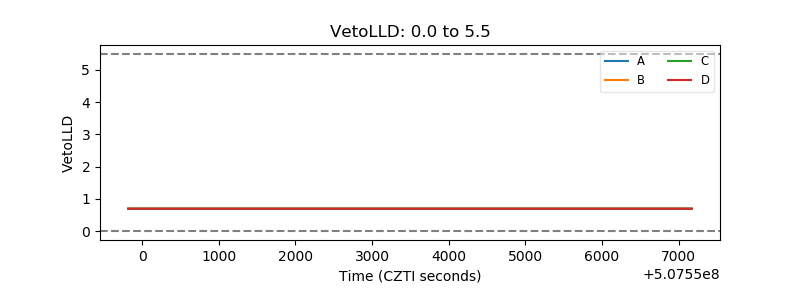 |
| Alpha Counter | 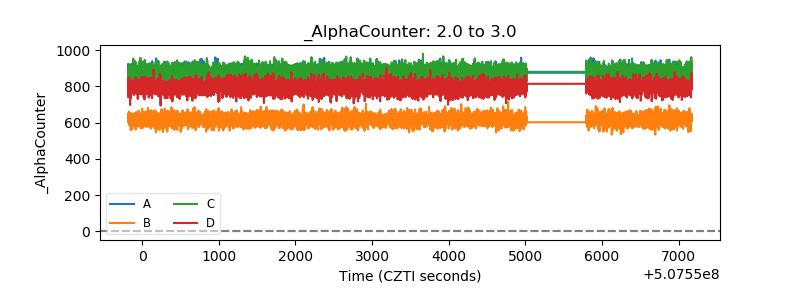 |
| _CPM_Rate | 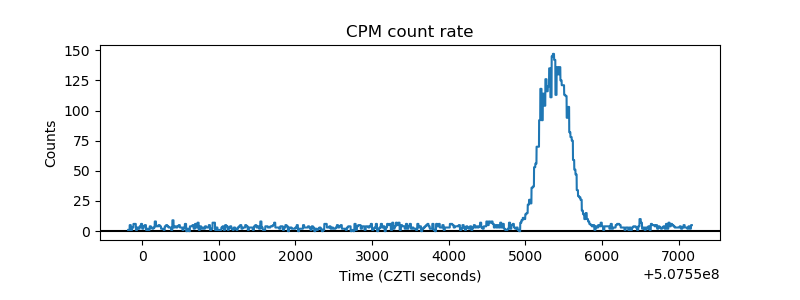 |
| CZT Counter | 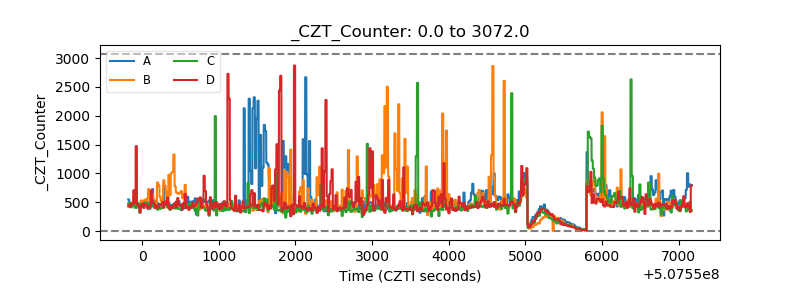 |
| +2.5 Volts monitor |  |
| +5 Volts monitor | 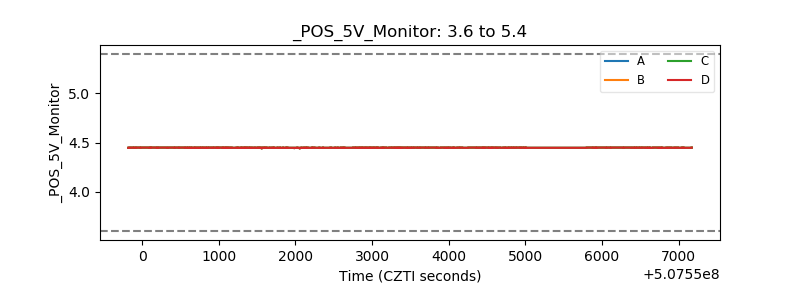 |
| _ROLL_ROT | 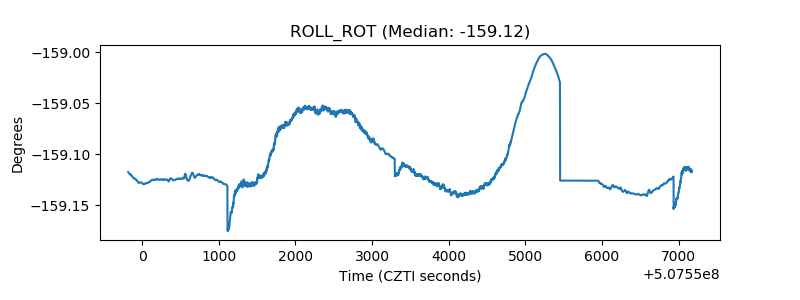 |
| _Roll_DEC | 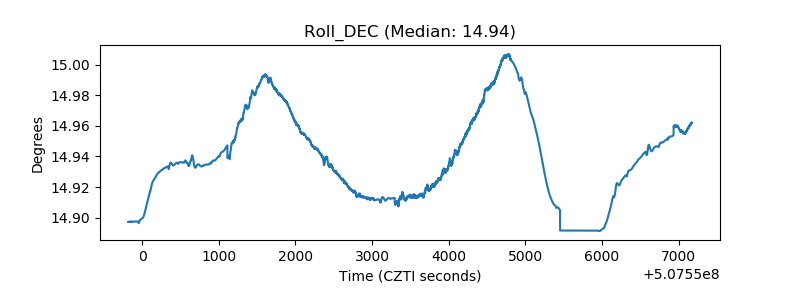 |
| _Roll_RA | 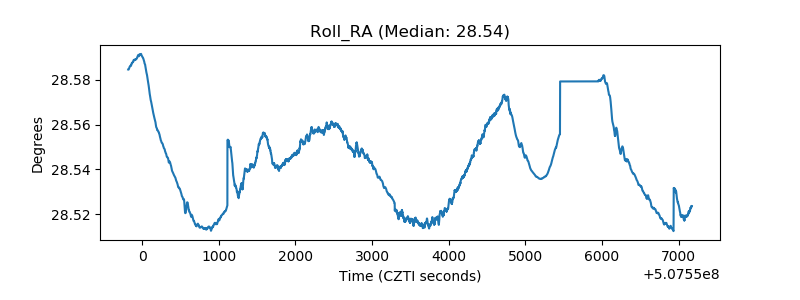 |
| Veto Counter | 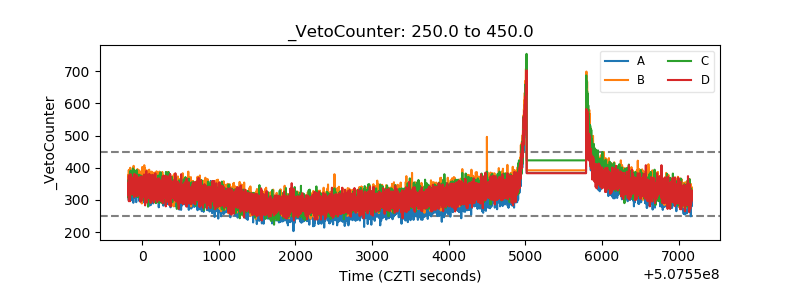 |