| Param | Original file | Final file |
|---|---|---|
| Filename | modeM0/AS1A14_066T02_9000006546_55966cztM0_level2.fits | modeM0/AS1A14_066T02_9000006546_55966cztM0_level2_quad_clean.evt |
| Size (bytes) | 389,096,640 | 94,893,120 |
| Size | 371.1 MB | 90.5 MB |
| Events in quadrant A | 4,181,426 | 618,720 |
| Events in quadrant B | 3,131,737 | 655,450 |
| Events in quadrant C | 3,339,585 | 579,710 |
| Events in quadrant D | 3,238,071 | 560,168 |
| Mode M9 | |||
|---|---|---|---|
| Quadrant | BADHDUFLAG | Total packets | Discarded packets |
| A | 0 | 9 | 0 |
| B | 0 | 9 | 0 |
| C | 0 | 9 | 0 |
| D | 0 | 9 | 0 |
| Mode M0 | |||
|---|---|---|---|
| Quadrant | BADHDUFLAG | Total packets | Discarded packets |
| A | 0 | 16925 | 1 |
| B | 0 | 14125 | 1 |
| C | 0 | 15061 | 1 |
| D | 0 | 14374 | 1 |
| Mode SS | |||
|---|---|---|---|
| Quadrant | BADHDUFLAG | Total packets | Discarded packets |
| A | 0 | 134 | 0 |
| B | 0 | 134 | 0 |
| C | 0 | 134 | 0 |
| D | 0 | 134 | 0 |
| Quadrant | Total seconds | Saturated seconds | Saturation percentage |
|---|---|---|---|
| A | 6583 | 81 | 1.230442% |
| B | 6584 | 103 | 1.564399% |
| C | 6584 | 135 | 2.050425% |
| D | 6583 | 63 | 0.957010% |
Noise dominated data is calculated using 1-second bins in cleaned event files. If a bin has >2000 counts, and if more than 50% of those come from <1% of pixels, then it is considered to be noise-dominated and hence unusable.
| Quadrant | # 1 sec bins | Bins with >0 counts | Bins with >2000 counts | High rate bins dominated by noise | Noise dominated (total time) | Noise dominated (detector-on time) | Marked lightcurve |
|---|---|---|---|---|---|---|---|
| A | 7493 | 6584 | 3 | 3 | 0.04% | 0.05% | 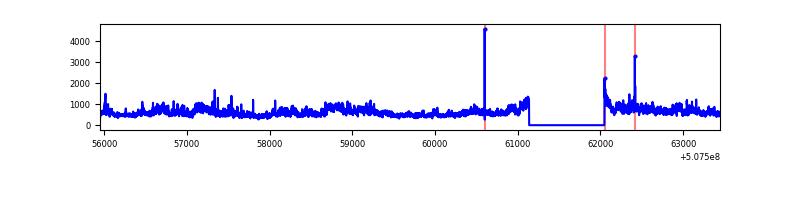 |
| B | 7494 | 6585 | 29 | 29 | 0.39% | 0.44% | 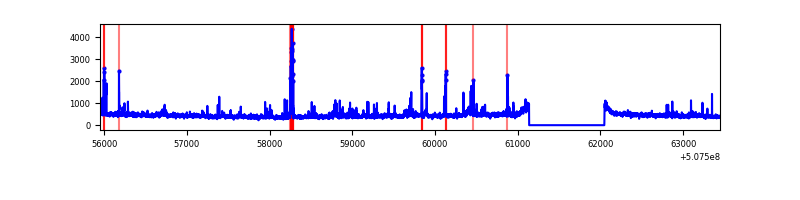 |
| C | 7494 | 6585 | 71 | 71 | 0.95% | 1.08% | 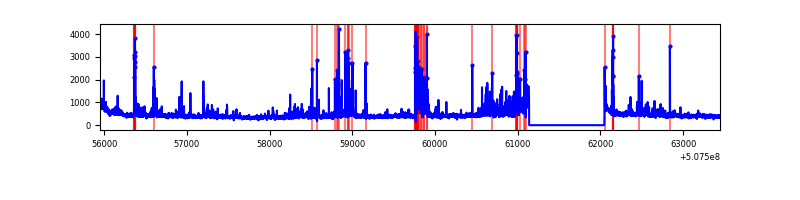 |
| D | 7493 | 6584 | 33 | 33 | 0.44% | 0.50% | 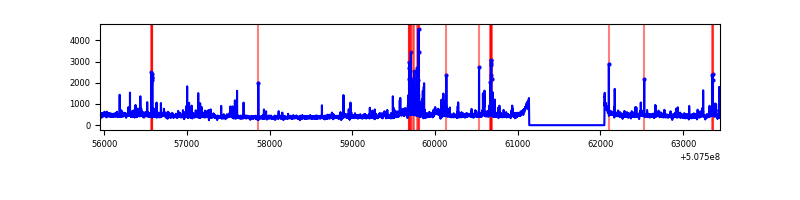 |
Top three noisy pixels from each quadrant. If the there are fewer than three noisy pixels in the level2.evt file, extra rows are filled as -1
| Pixel properties | Quadrant properties | ||||||
|---|---|---|---|---|---|---|---|
| Quadrant | DetID | PixID | Counts | Sigma | Mean | Median | Sigma |
| A | 7 | 64 | 1256497 | 7245.98 | 699 | 682 | 173.3 |
| A | 4 | 3 | 40030 | 227.04 | 699 | 682 | 173.3 |
| A | 0 | 8 | 34819 | 196.97 | 699 | 682 | 173.3 |
| B | 2 | 249 | 178979 | 1211.51 | 688 | 662 | 147.2 |
| B | 0 | 199 | 64671 | 434.89 | 688 | 662 | 147.2 |
| B | 0 | 213 | 27278 | 180.83 | 688 | 662 | 147.2 |
| C | 15 | 230 | 205559 | 1108.65 | 671 | 665 | 184.8 |
| C | 14 | 254 | 154176 | 830.62 | 671 | 665 | 184.8 |
| C | 15 | 199 | 111716 | 600.88 | 671 | 665 | 184.8 |
| D | 2 | 31 | 140789 | 730.08 | 679 | 651 | 191.9 |
| D | 7 | 96 | 120161 | 622.62 | 679 | 651 | 191.9 |
| D | 7 | 129 | 71447 | 368.83 | 679 | 651 | 191.9 |
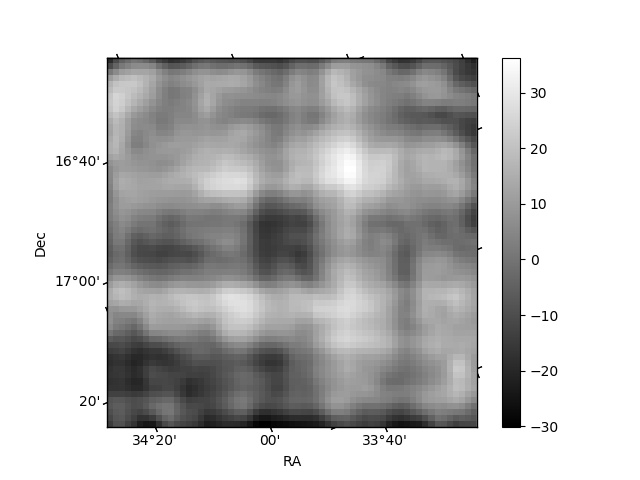
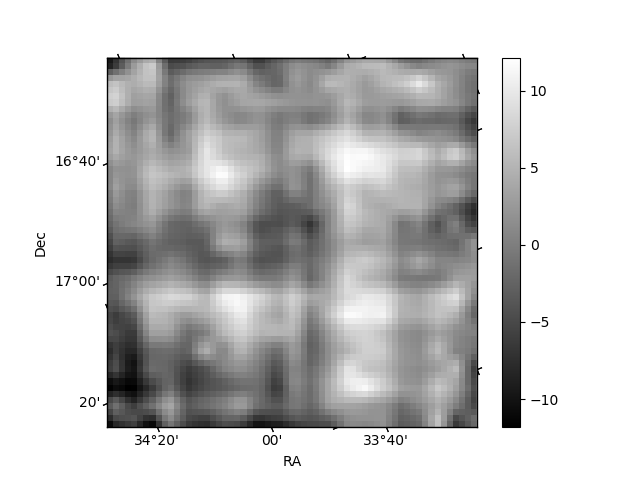
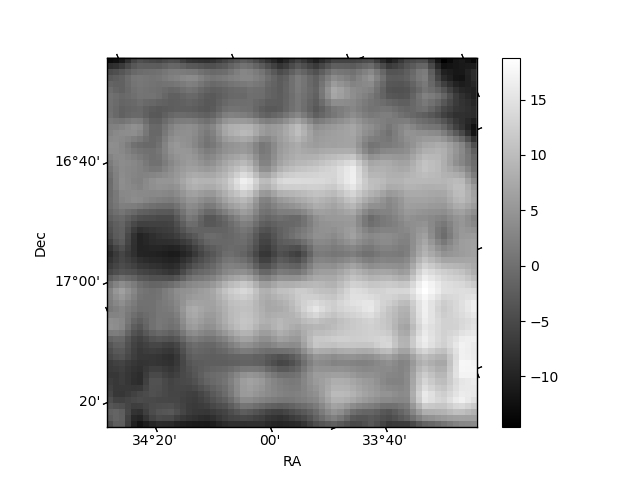
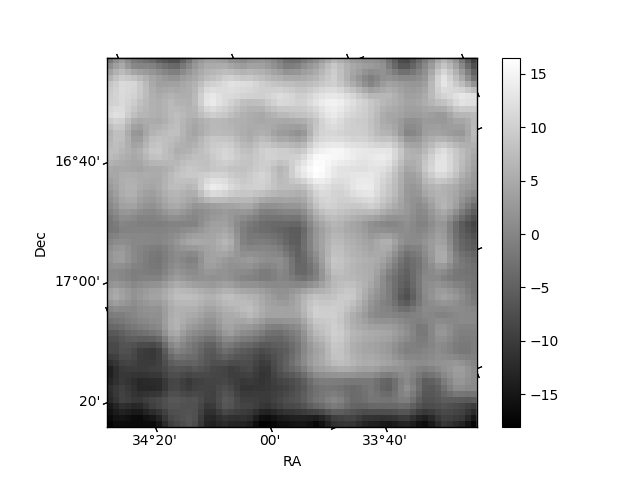
Histogram calculated using DETX and DETY for each event in the final _common_clean file
| Quadrant A | 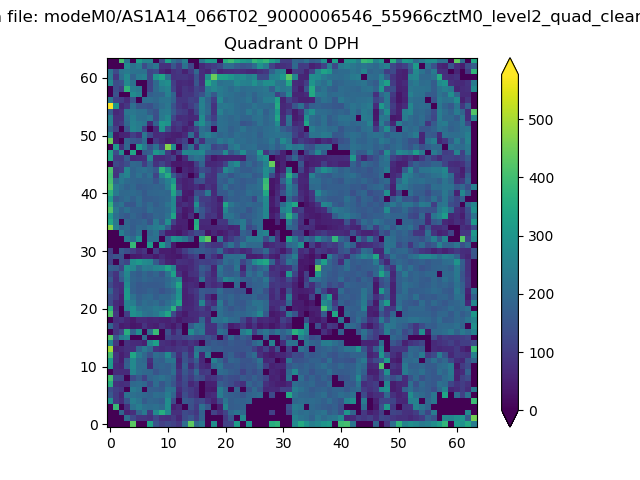 |
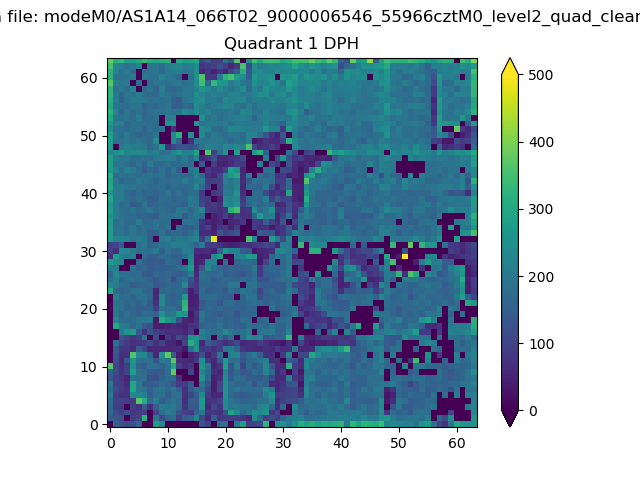 |
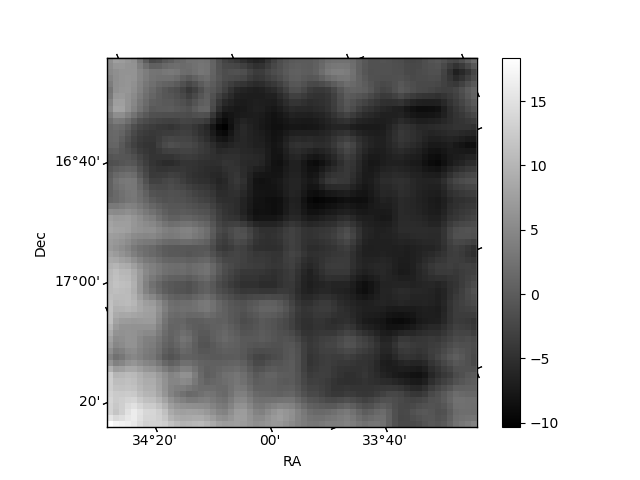
Quadrant B |
|---|---|---|---|
| Quadrant D | 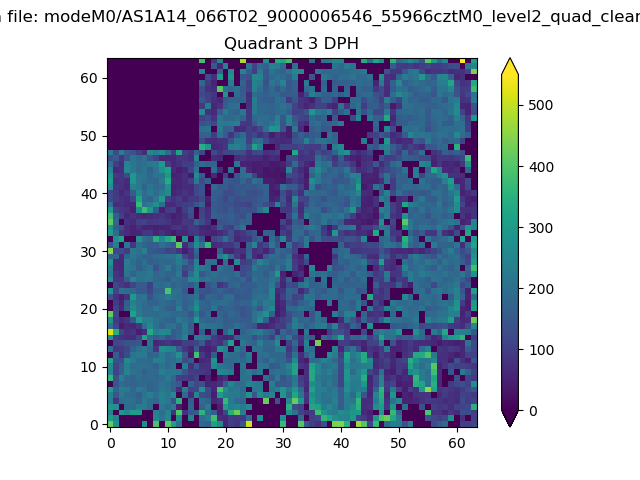 |
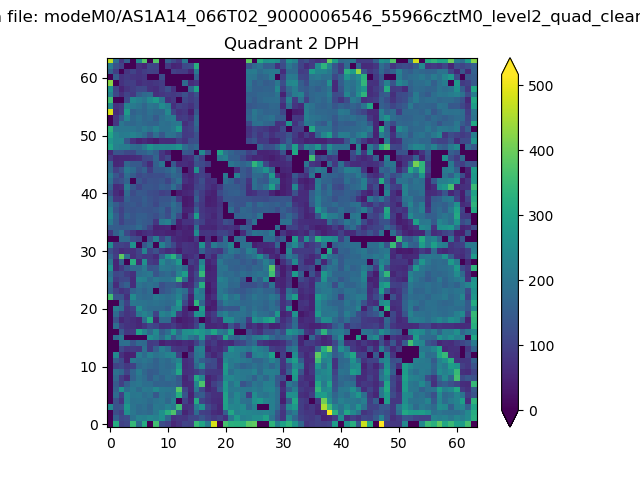 |
Quadrant C |
| Plot type | Count rate plots | Images |
|---|---|---|
| Comparison with Poisson distribution Blue bars denote a histogram of data divided into 1 sec bins. Red curve is a Poisson curve with rate = median count rate of data. |
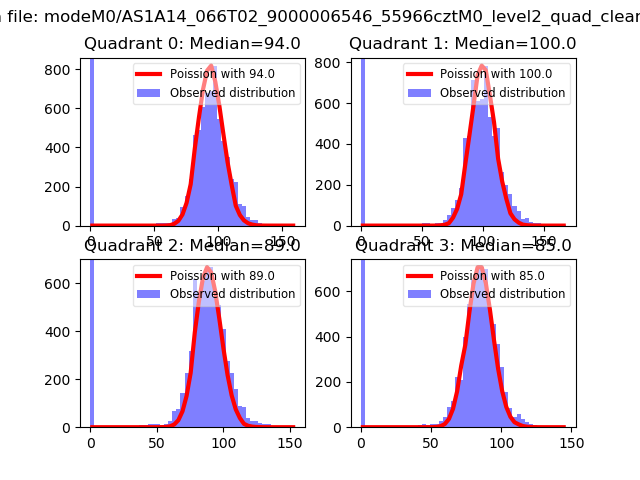 |
 |
| Quadrant-wise count rates Data is divided into 100 sec bins |
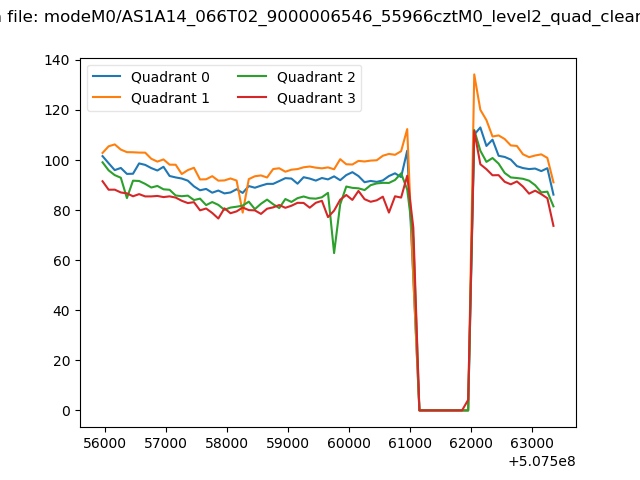 |
|
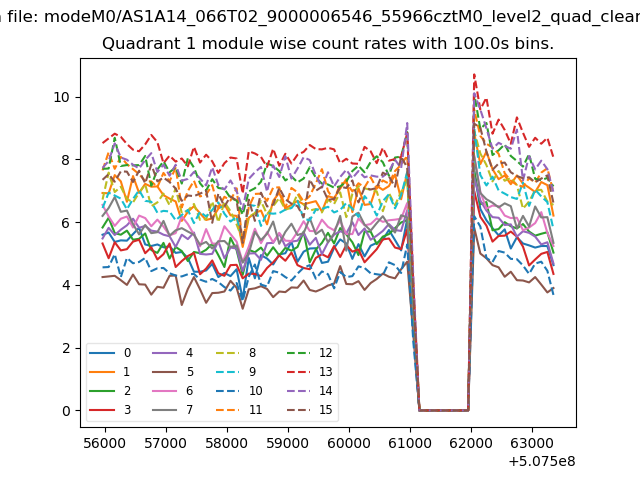
| Module-wise count rates for Quadrant A Data is divided into 100 sec bins |
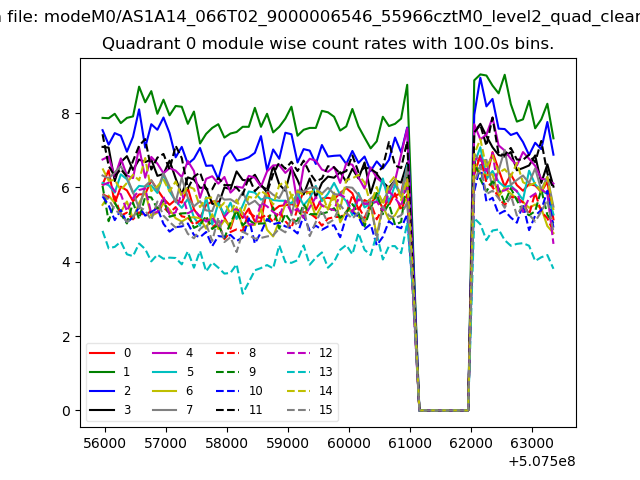 |
 |
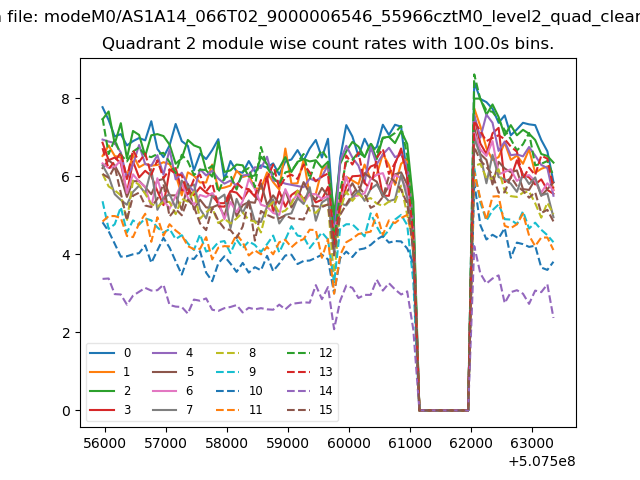
| Module-wise count rates for Quadrant B Data is divided into 100 sec bins |
 |
 |
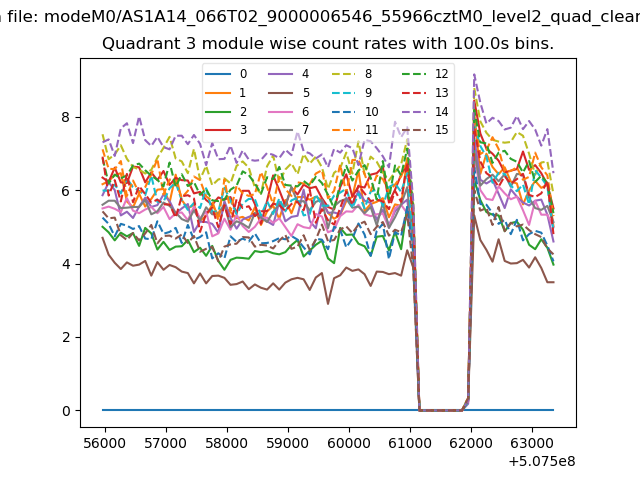
| Module-wise count rates for Quadrant C Data is divided into 100 sec bins |
 |
 |
| Module-wise count rates for Quadrant D Data is divided into 100 sec bins |
 |
 |
| Parameter | Plot |
|---|---|
| CZT HV Monitor | 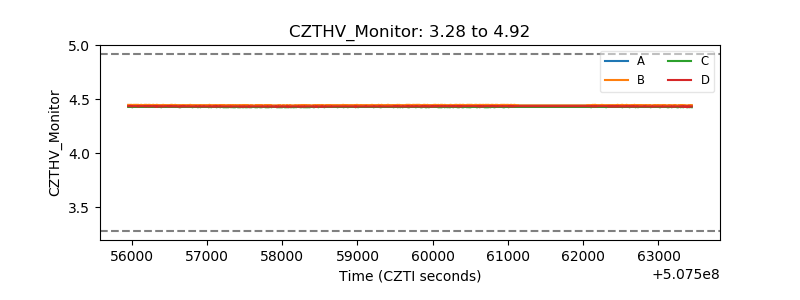 |
| D_VDD | 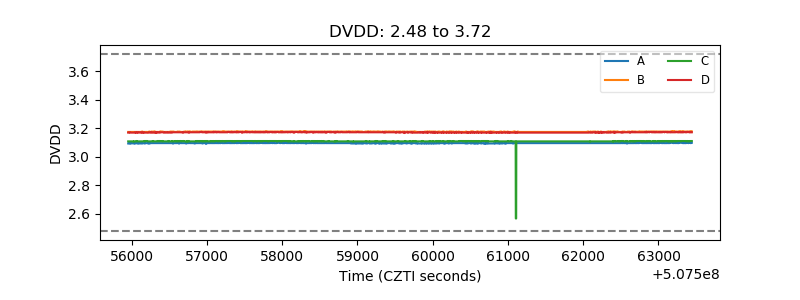 |
| Temperature 1 | 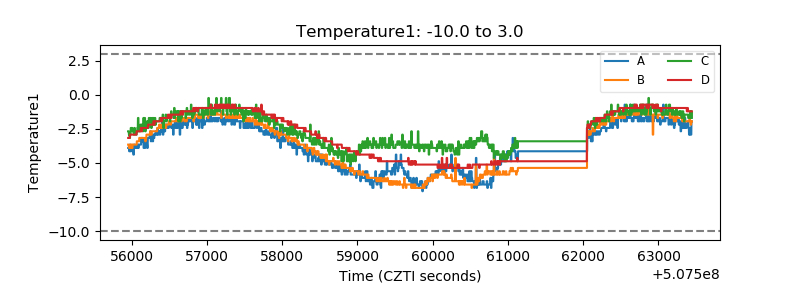 |
| Veto HV Monitor | 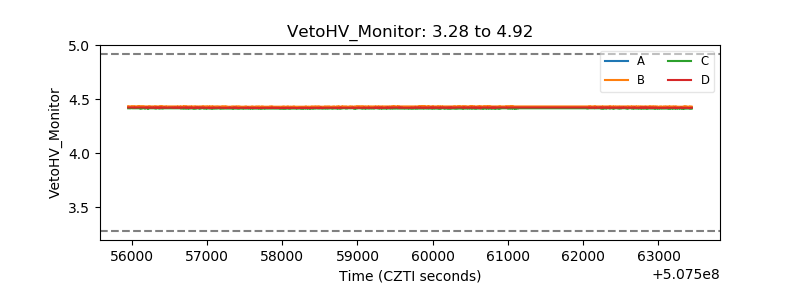 |
| Veto LLD | 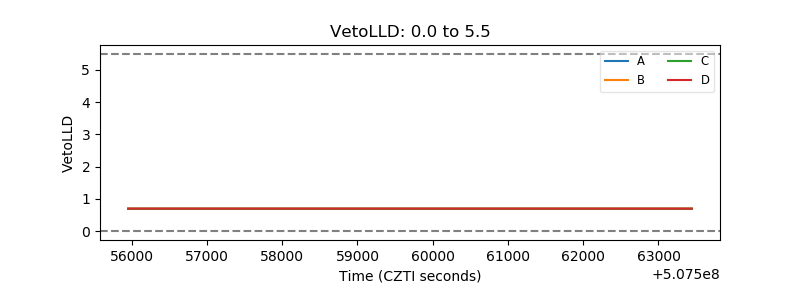 |
| Alpha Counter | 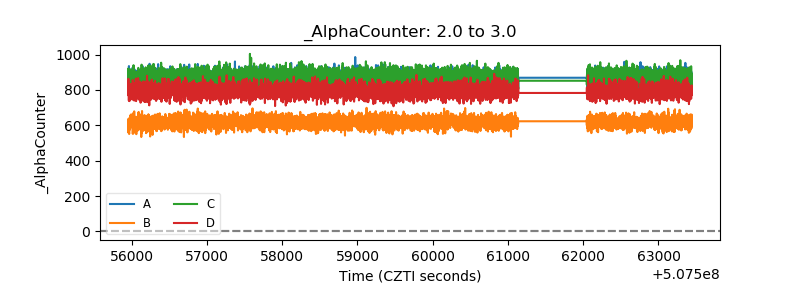 |
| _CPM_Rate | 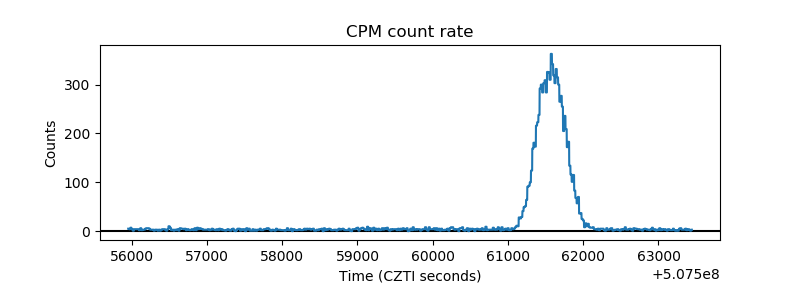 |
| CZT Counter | 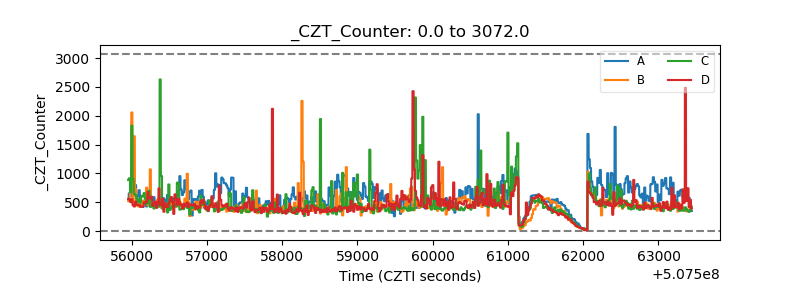 |
| +2.5 Volts monitor |  |
| +5 Volts monitor |  |
| _ROLL_ROT | 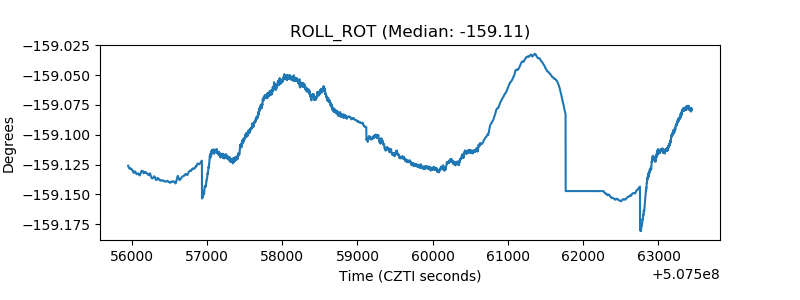 |
| _Roll_DEC | 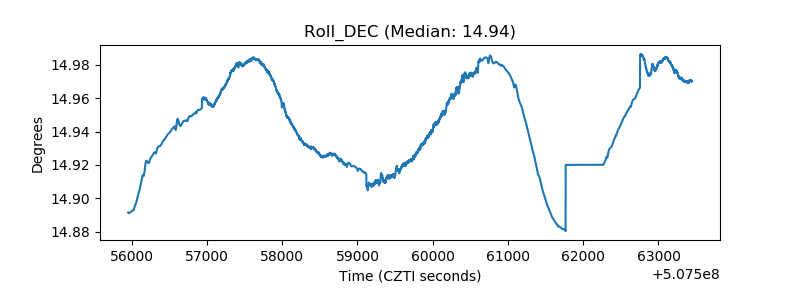 |
| _Roll_RA | 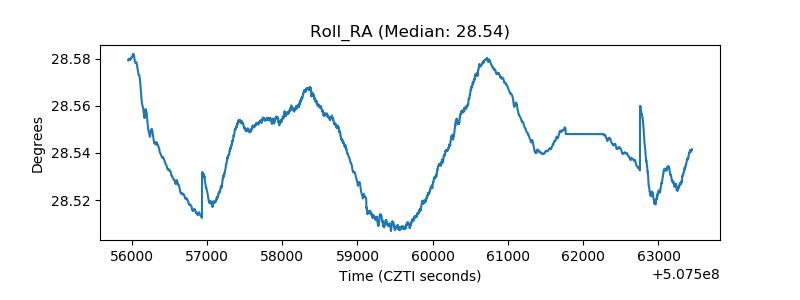 |
| Veto Counter | 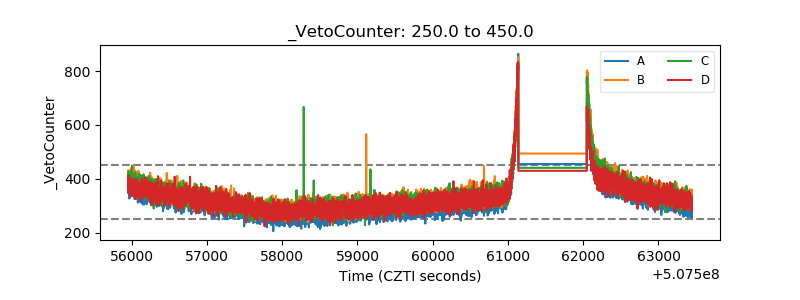 |