| Param | Original file | Final file |
|---|---|---|
| Filename | modeM0/AS1A14_066T02_9000006546_55968cztM0_level2.fits | modeM0/AS1A14_066T02_9000006546_55968cztM0_level2_quad_clean.evt |
| Size (bytes) | 405,673,920 | 92,689,920 |
| Size | 386.9 MB | 88.4 MB |
| Events in quadrant A | 4,499,516 | 606,813 |
| Events in quadrant B | 3,566,148 | 647,994 |
| Events in quadrant C | 2,797,238 | 579,126 |
| Events in quadrant D | 3,662,629 | 532,039 |
| Mode M9 | |||
|---|---|---|---|
| Quadrant | BADHDUFLAG | Total packets | Discarded packets |
| A | 0 | 11 | 0 |
| B | 0 | 11 | 0 |
| C | 0 | 11 | 0 |
| D | 0 | 11 | 0 |
| Mode M0 | |||
|---|---|---|---|
| Quadrant | BADHDUFLAG | Total packets | Discarded packets |
| A | 0 | 17767 | 1 |
| B | 0 | 14854 | 1 |
| C | 0 | 13203 | 1 |
| D | 0 | 15462 | 2 |
| Mode SS | |||
|---|---|---|---|
| Quadrant | BADHDUFLAG | Total packets | Discarded packets |
| A | 0 | 128 | 0 |
| B | 0 | 128 | 0 |
| C | 0 | 128 | 0 |
| D | 0 | 128 | 0 |
| Quadrant | Total seconds | Saturated seconds | Saturation percentage |
|---|---|---|---|
| A | 6314 | 135 | 2.138106% |
| B | 6314 | 123 | 1.948052% |
| C | 6315 | 46 | 0.728424% |
| D | 6314 | 258 | 4.086158% |
Noise dominated data is calculated using 1-second bins in cleaned event files. If a bin has >2000 counts, and if more than 50% of those come from <1% of pixels, then it is considered to be noise-dominated and hence unusable.
| Quadrant | # 1 sec bins | Bins with >0 counts | Bins with >2000 counts | High rate bins dominated by noise | Noise dominated (total time) | Noise dominated (detector-on time) | Marked lightcurve |
|---|---|---|---|---|---|---|---|
| A | 7429 | 6315 | 45 | 45 | 0.61% | 0.71% | 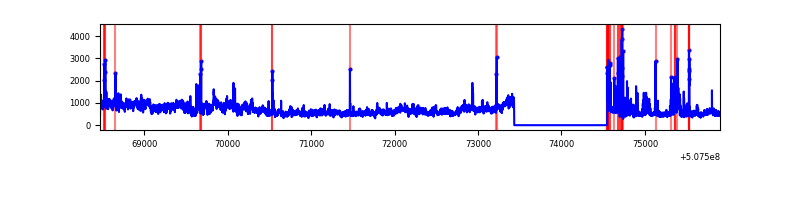 |
| B | 7429 | 6315 | 36 | 36 | 0.48% | 0.57% | 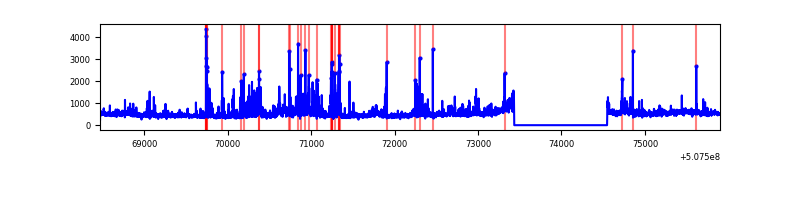 |
| C | 7430 | 6316 | 19 | 19 | 0.26% | 0.30% | 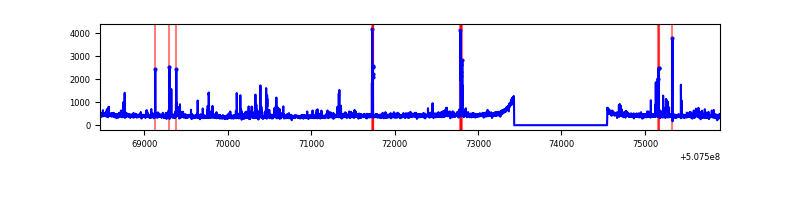 |
| D | 7429 | 6315 | 185 | 185 | 2.49% | 2.93% | 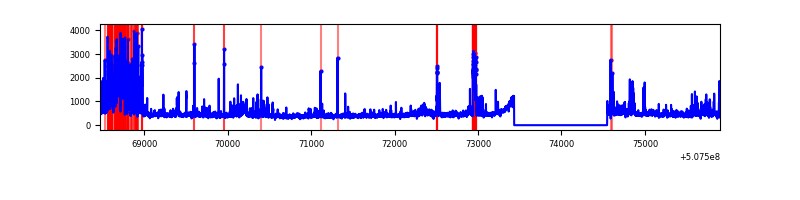 |
Top three noisy pixels from each quadrant. If the there are fewer than three noisy pixels in the level2.evt file, extra rows are filled as -1
| Pixel properties | Quadrant properties | ||||||
|---|---|---|---|---|---|---|---|
| Quadrant | DetID | PixID | Counts | Sigma | Mean | Median | Sigma |
| A | 7 | 64 | 1379261 | 8207.02 | 674 | 658 | 168.0 |
| A | 15 | 32 | 240697 | 1428.99 | 674 | 658 | 168.0 |
| A | 12 | 115 | 67126 | 395.69 | 674 | 658 | 168.0 |
| B | 2 | 249 | 390989 | 2733.86 | 667 | 642 | 142.8 |
| B | 0 | 199 | 177708 | 1240.11 | 667 | 642 | 142.8 |
| B | 0 | 229 | 96403 | 670.68 | 667 | 642 | 142.8 |
| C | 13 | 3 | 71551 | 393.71 | 656 | 650 | 180.1 |
| C | 12 | 249 | 45331 | 248.11 | 656 | 650 | 180.1 |
| C | 12 | 252 | 28798 | 156.3 | 656 | 650 | 180.1 |
| D | 11 | 129 | 626300 | 3388.83 | 647 | 619 | 184.6 |
| D | 6 | 42 | 157629 | 850.4 | 647 | 619 | 184.6 |
| D | 14 | 52 | 75895 | 407.71 | 647 | 619 | 184.6 |
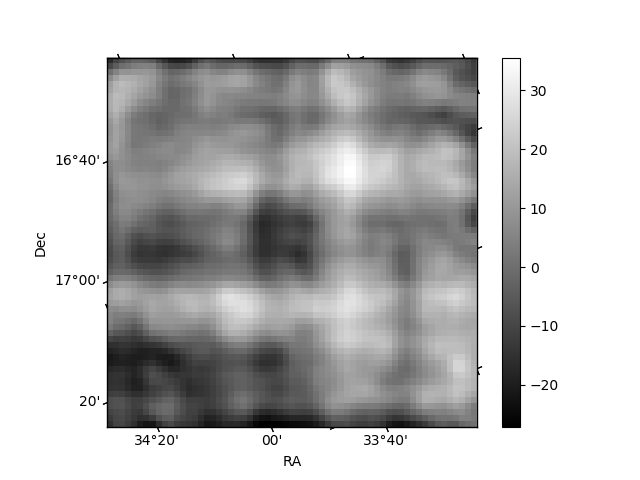
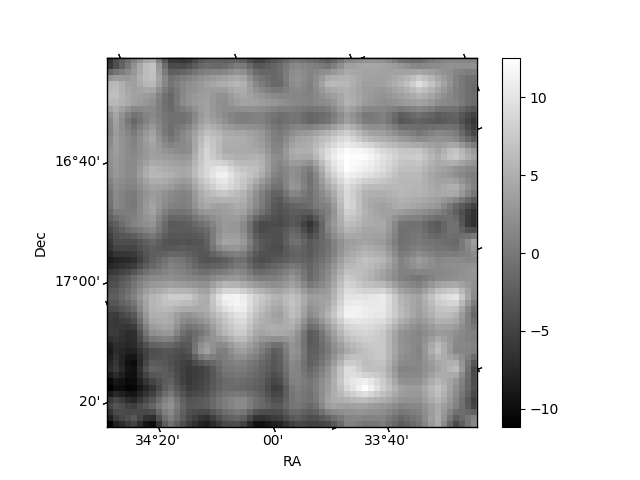
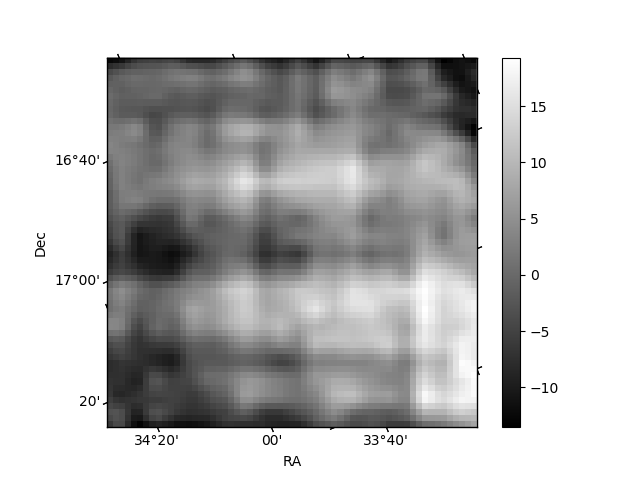
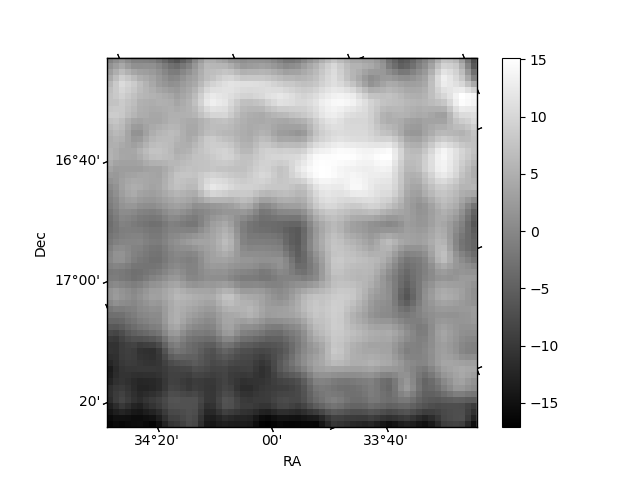
Histogram calculated using DETX and DETY for each event in the final _common_clean file
| Quadrant A | 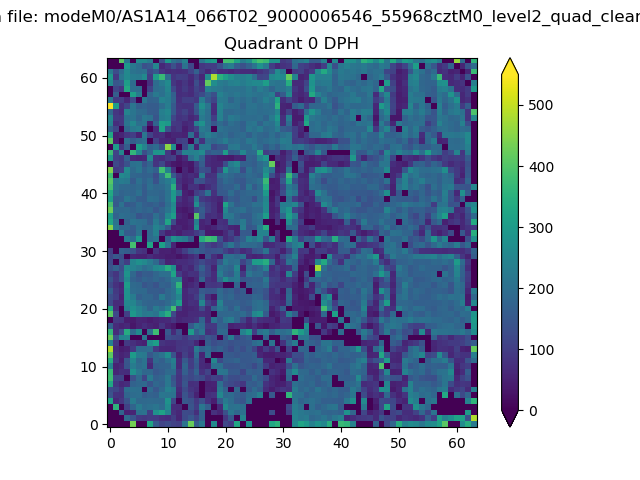 |
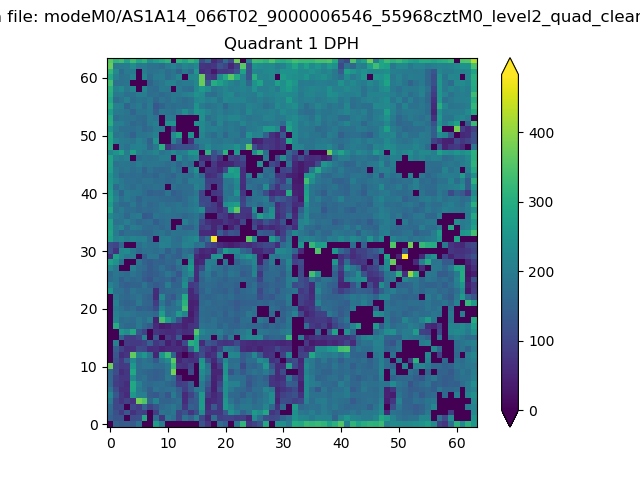 |
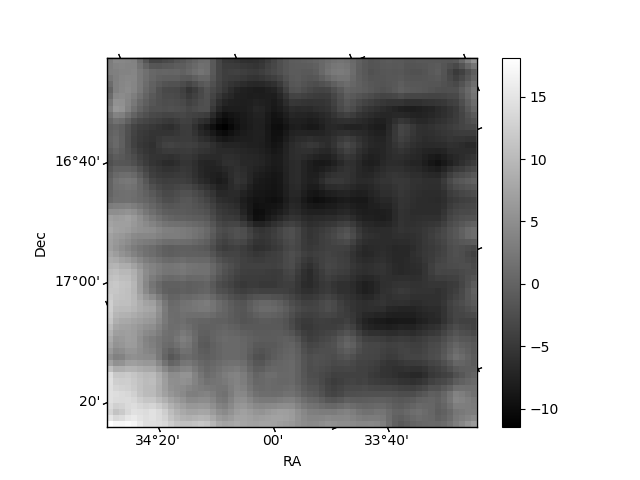
Quadrant B |
|---|---|---|---|
| Quadrant D | 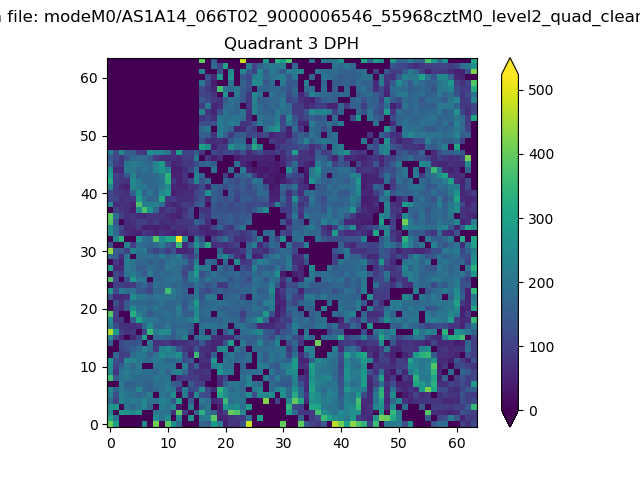 |
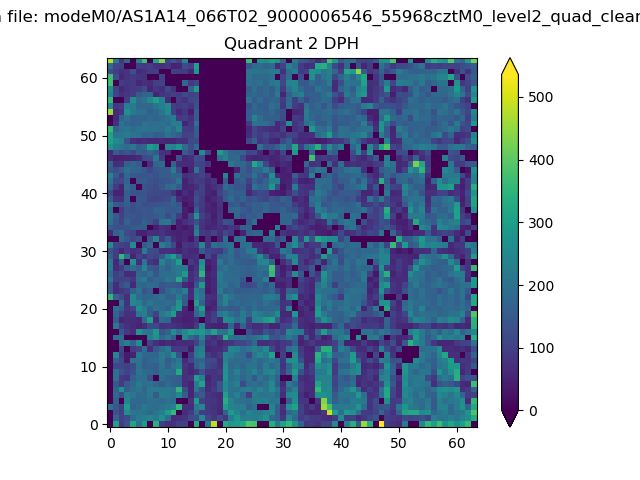 |
Quadrant C |
| Plot type | Count rate plots | Images |
|---|---|---|
| Comparison with Poisson distribution Blue bars denote a histogram of data divided into 1 sec bins. Red curve is a Poisson curve with rate = median count rate of data. |
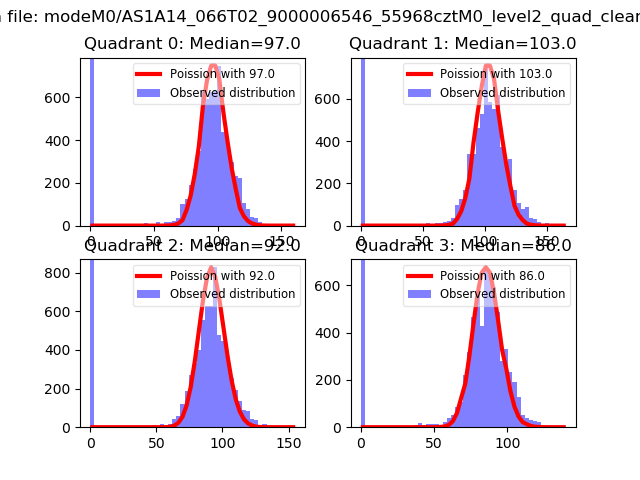 |
 |
| Quadrant-wise count rates Data is divided into 100 sec bins |
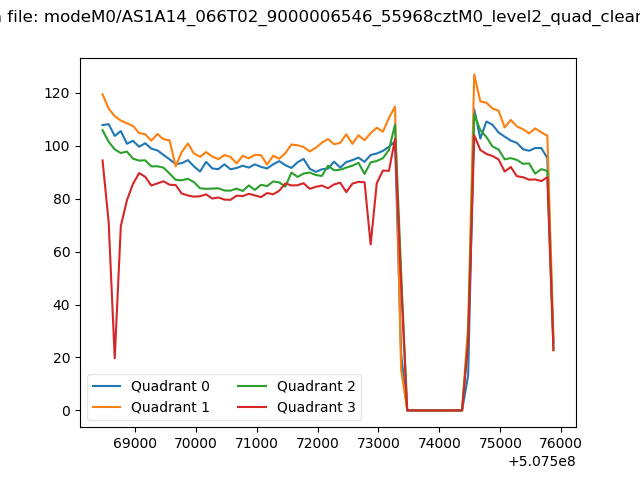 |
|
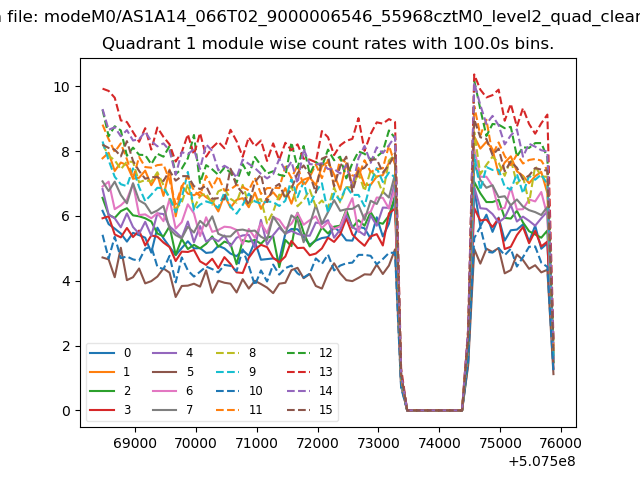
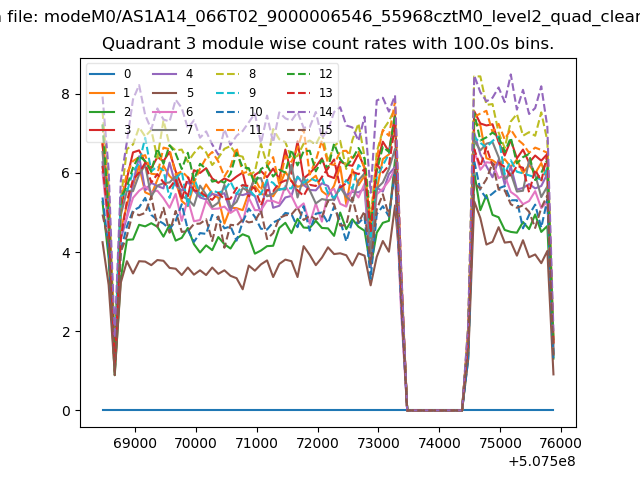
| Module-wise count rates for Quadrant A Data is divided into 100 sec bins |
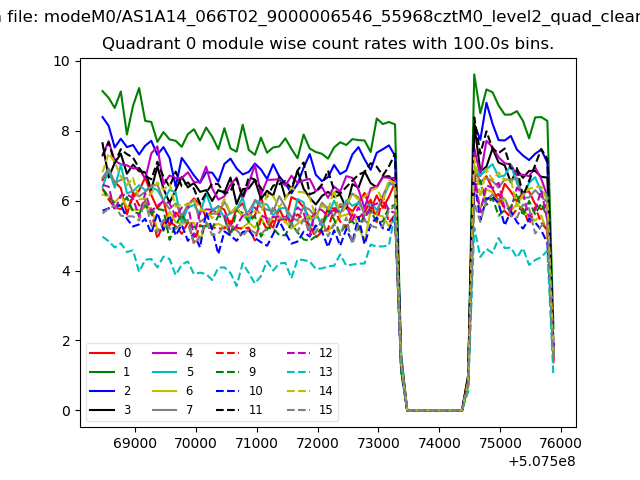 |
 |
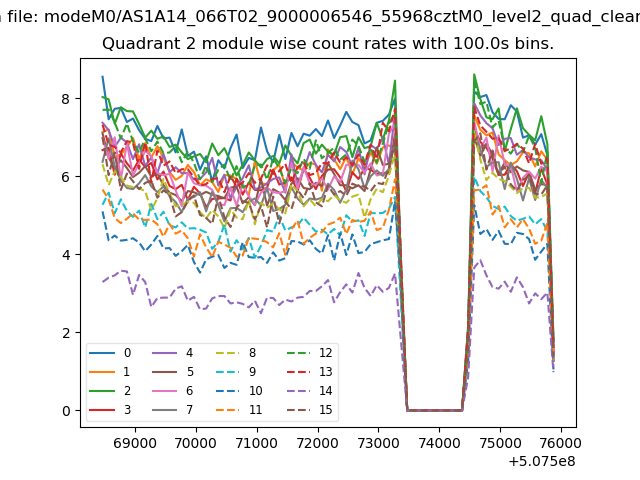
| Module-wise count rates for Quadrant B Data is divided into 100 sec bins |
 |
 |
| Module-wise count rates for Quadrant C Data is divided into 100 sec bins |
 |
 |
| Module-wise count rates for Quadrant D Data is divided into 100 sec bins |
 |
 |
| Parameter | Plot |
|---|---|
| CZT HV Monitor | 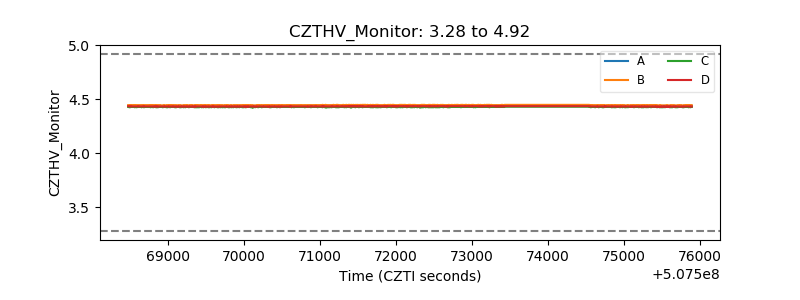 |
| D_VDD | 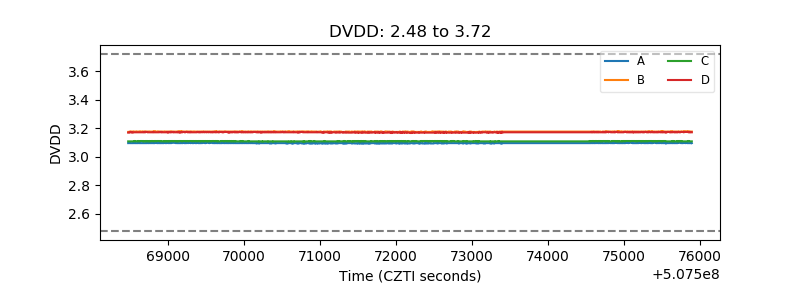 |
| Temperature 1 | 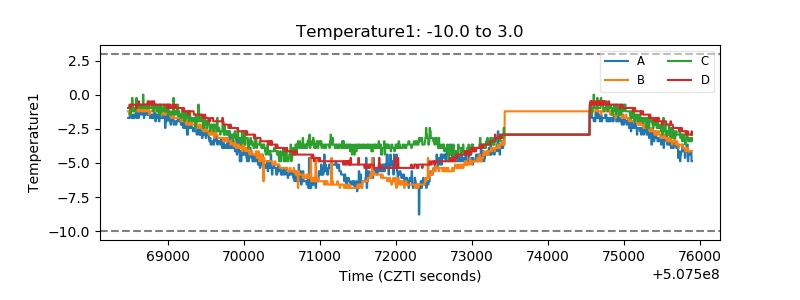 |
| Veto HV Monitor | 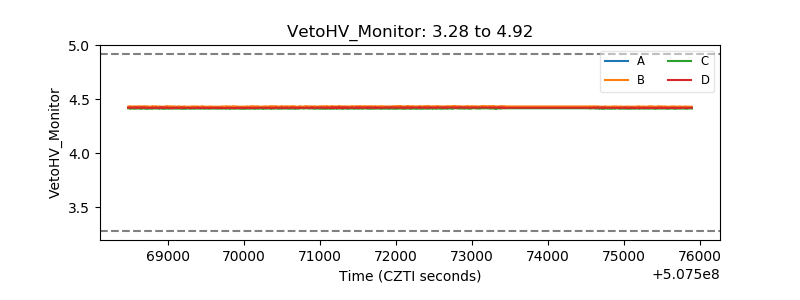 |
| Veto LLD | 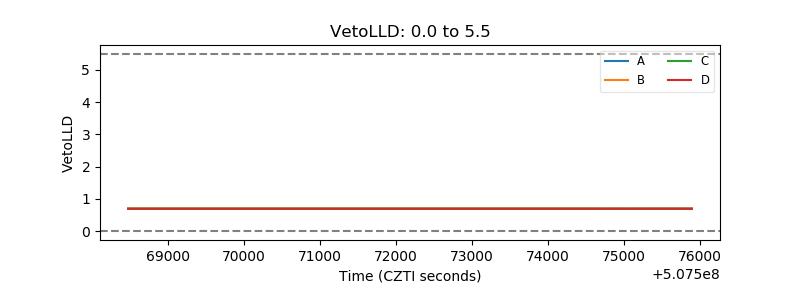 |
| Alpha Counter | 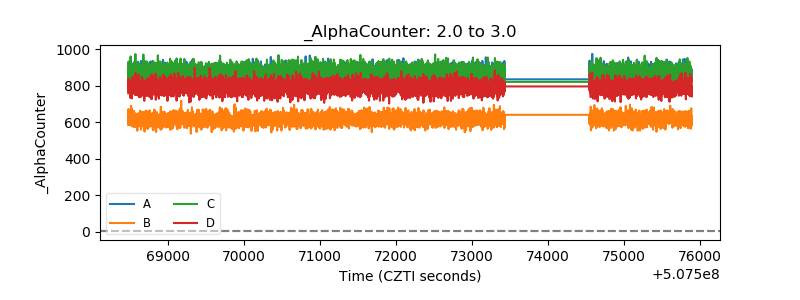 |
| _CPM_Rate | 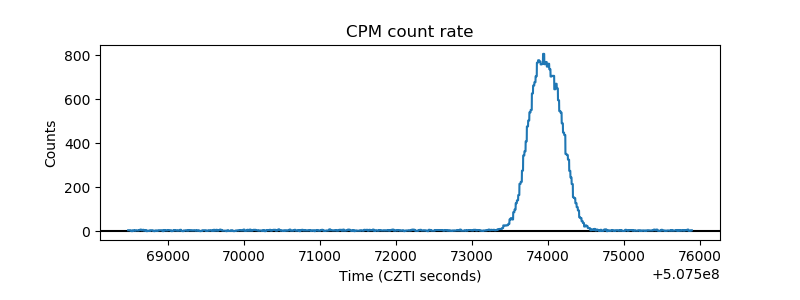 |
| CZT Counter | 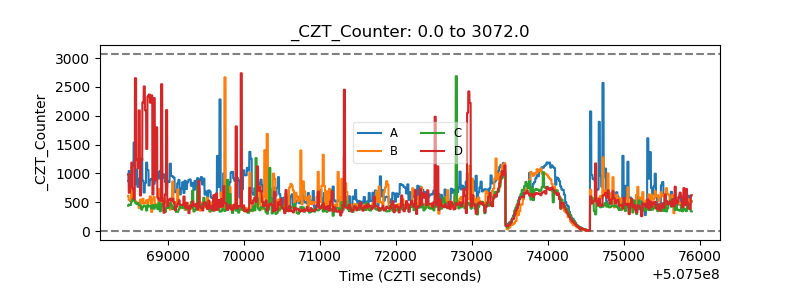 |
| +2.5 Volts monitor |  |
| +5 Volts monitor | 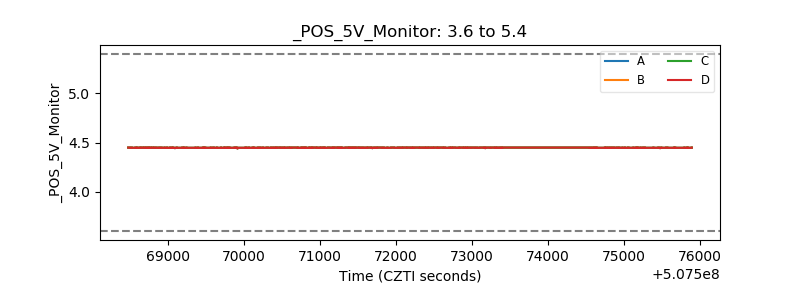 |
| _ROLL_ROT | 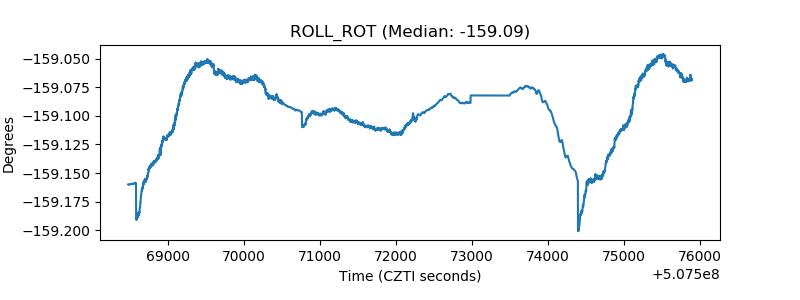 |
| _Roll_DEC | 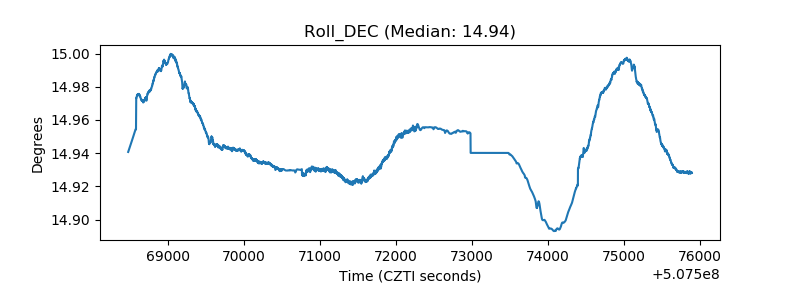 |
| _Roll_RA | 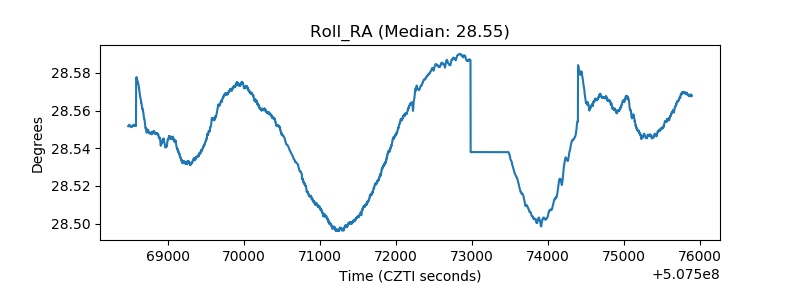 |
| Veto Counter | 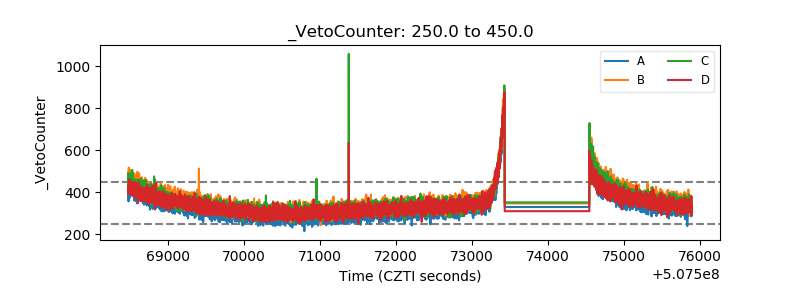 |