| Param | Original file | Final file |
|---|---|---|
| Filename | modeM0/AS1A14_066T02_9000006546_55969cztM0_level2.fits | modeM0/AS1A14_066T02_9000006546_55969cztM0_level2_quad_clean.evt |
| Size (bytes) | 453,335,040 | 92,344,320 |
| Size | 432.3 MB | 88.1 MB |
| Events in quadrant A | 5,955,582 | 554,135 |
| Events in quadrant B | 4,068,976 | 657,412 |
| Events in quadrant C | 3,195,827 | 584,012 |
| Events in quadrant D | 3,068,111 | 558,092 |
| Mode M9 | |||
|---|---|---|---|
| Quadrant | BADHDUFLAG | Total packets | Discarded packets |
| A | 0 | 20 | 0 |
| B | 0 | 21 | 0 |
| C | 0 | 21 | 0 |
| D | 0 | 21 | 0 |
| Mode M0 | |||
|---|---|---|---|
| Quadrant | BADHDUFLAG | Total packets | Discarded packets |
| A | 0 | 22022 | 3 |
| B | 0 | 16283 | 2 |
| C | 0 | 14300 | 2 |
| D | 0 | 13783 | 2 |
| Mode SS | |||
|---|---|---|---|
| Quadrant | BADHDUFLAG | Total packets | Discarded packets |
| A | 0 | 130 | 0 |
| B | 0 | 130 | 0 |
| C | 0 | 130 | 0 |
| D | 0 | 130 | 0 |
| Quadrant | Total seconds | Saturated seconds | Saturation percentage |
|---|---|---|---|
| A | 6338 | 720 | 11.360050% |
| B | 6338 | 167 | 2.634901% |
| C | 6338 | 93 | 1.467340% |
| D | 6338 | 35 | 0.552225% |
Noise dominated data is calculated using 1-second bins in cleaned event files. If a bin has >2000 counts, and if more than 50% of those come from <1% of pixels, then it is considered to be noise-dominated and hence unusable.
| Quadrant | # 1 sec bins | Bins with >0 counts | Bins with >2000 counts | High rate bins dominated by noise | Noise dominated (total time) | Noise dominated (detector-on time) | Marked lightcurve |
|---|---|---|---|---|---|---|---|
| A | 7508 | 6339 | 585 | 585 | 7.79% | 9.23% | 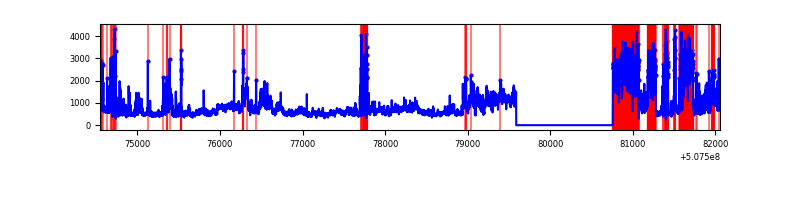 |
| B | 7508 | 6339 | 68 | 68 | 0.91% | 1.07% | 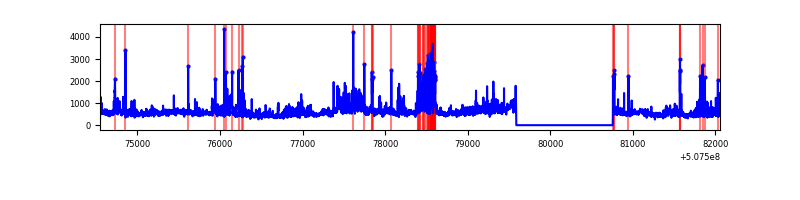 |
| C | 7508 | 6339 | 79 | 79 | 1.05% | 1.25% | 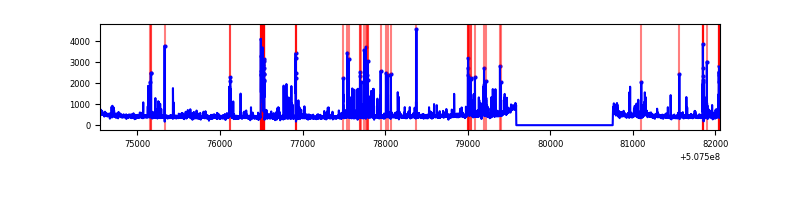 |
| D | 7508 | 6339 | 25 | 25 | 0.33% | 0.39% | 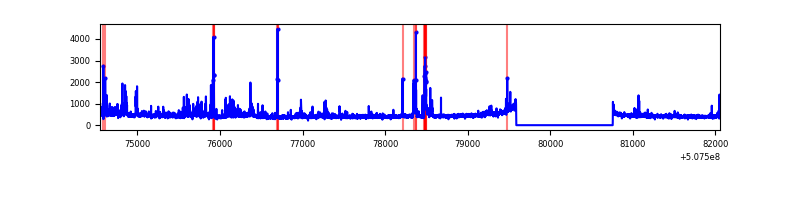 |
Top three noisy pixels from each quadrant. If the there are fewer than three noisy pixels in the level2.evt file, extra rows are filled as -1
| Pixel properties | Quadrant properties | ||||||
|---|---|---|---|---|---|---|---|
| Quadrant | DetID | PixID | Counts | Sigma | Mean | Median | Sigma |
| A | 12 | 115 | 1873273 | 11626.76 | 645 | 628 | 161.1 |
| A | 7 | 64 | 727866 | 4515.23 | 645 | 628 | 161.1 |
| A | 15 | 32 | 396993 | 2460.93 | 645 | 628 | 161.1 |
| B | 2 | 249 | 527993 | 3685.91 | 671 | 648 | 143.1 |
| B | 0 | 229 | 360073 | 2512.22 | 671 | 648 | 143.1 |
| B | 0 | 199 | 140043 | 974.31 | 671 | 648 | 143.1 |
| C | 13 | 3 | 225725 | 1235.83 | 660 | 654 | 182.1 |
| C | 12 | 112 | 110702 | 604.26 | 660 | 654 | 182.1 |
| C | 12 | 249 | 70101 | 381.32 | 660 | 654 | 182.1 |
| D | 2 | 249 | 101509 | 542.37 | 660 | 631 | 186.0 |
| D | 11 | 129 | 86584 | 462.12 | 660 | 631 | 186.0 |
| D | 14 | 52 | 57179 | 304.03 | 660 | 631 | 186.0 |
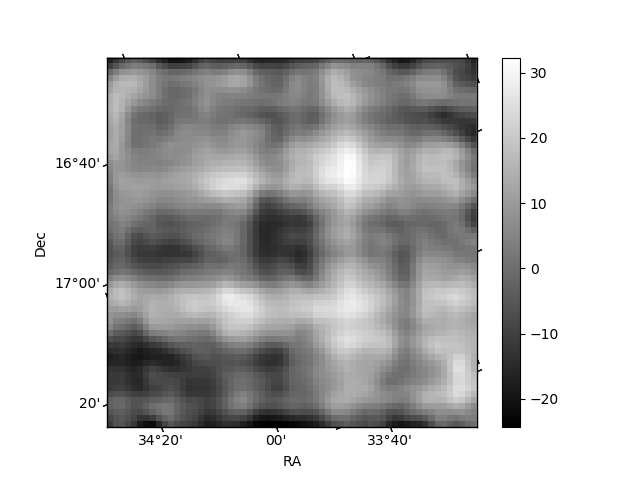
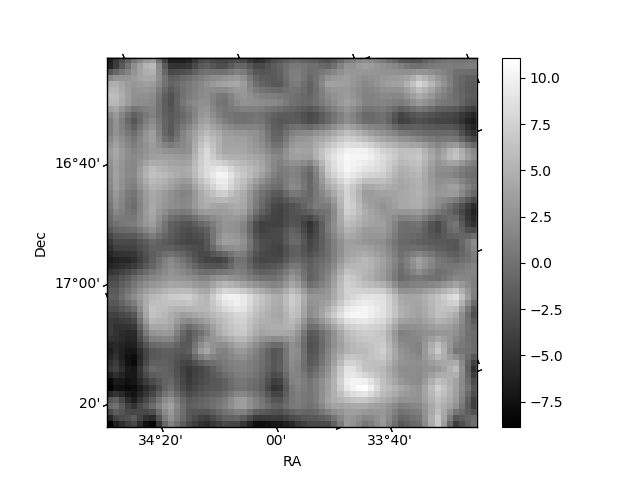
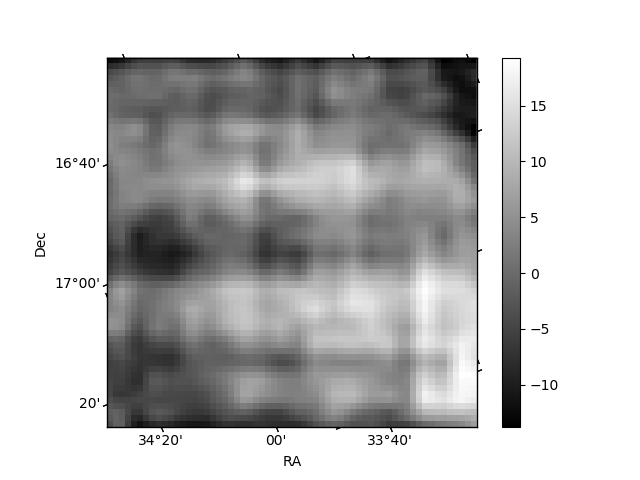
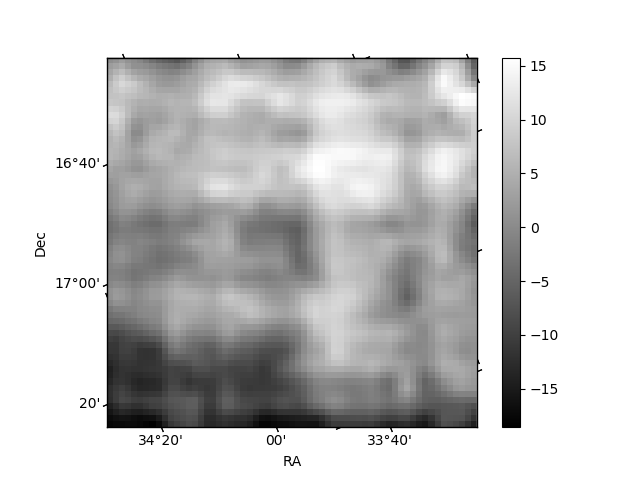
Histogram calculated using DETX and DETY for each event in the final _common_clean file
| Quadrant A | 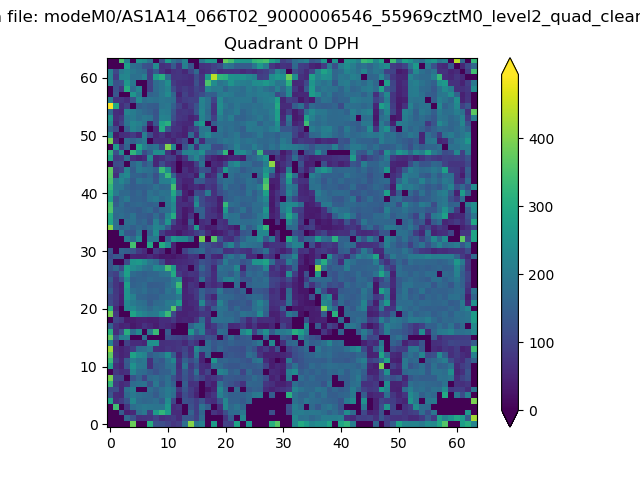 |
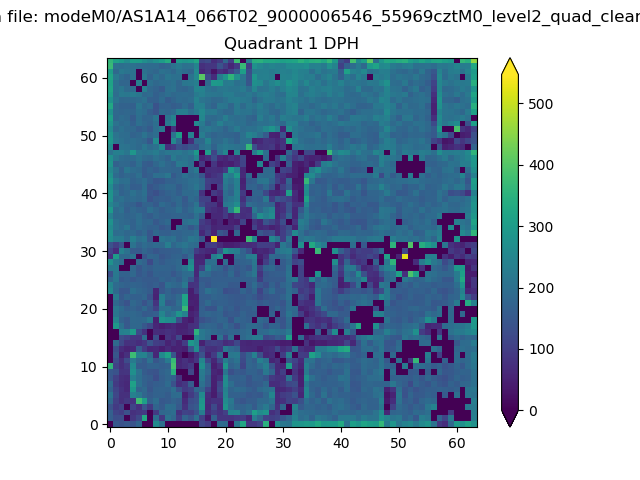 |
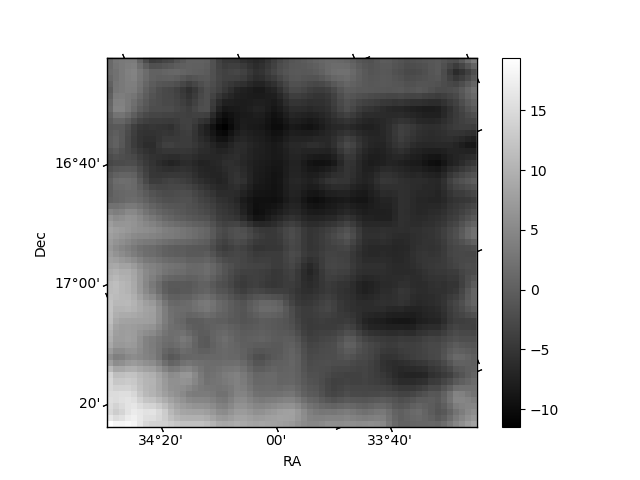
Quadrant B |
|---|---|---|---|
| Quadrant D | 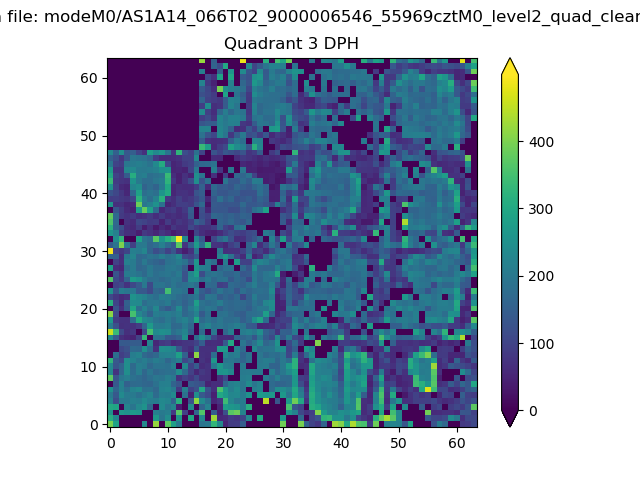 |
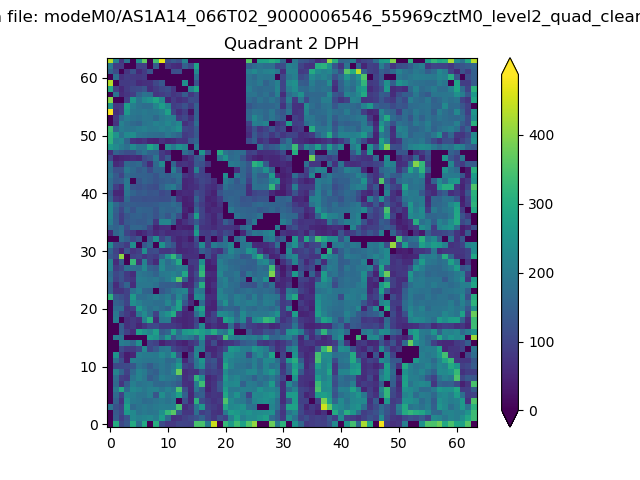 |
Quadrant C |
| Plot type | Count rate plots | Images |
|---|---|---|
| Comparison with Poisson distribution Blue bars denote a histogram of data divided into 1 sec bins. Red curve is a Poisson curve with rate = median count rate of data. |
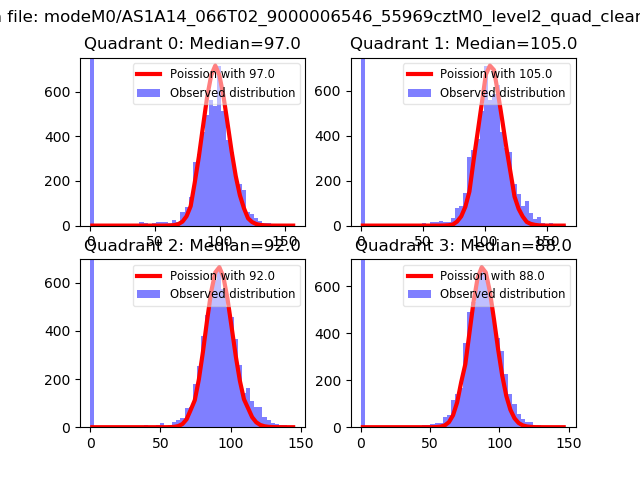 |
 |
| Quadrant-wise count rates Data is divided into 100 sec bins |
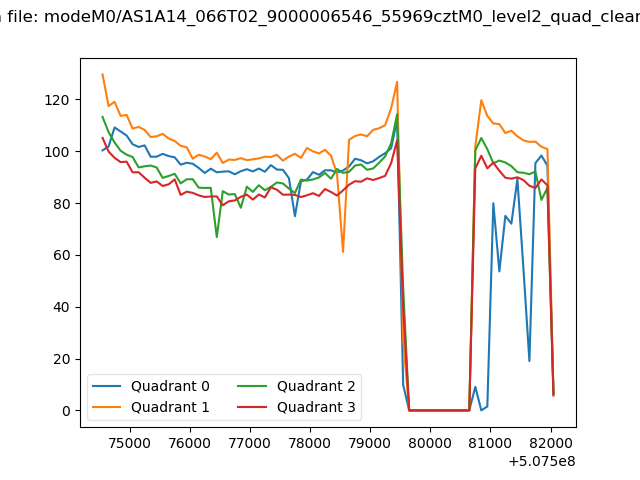 |
|
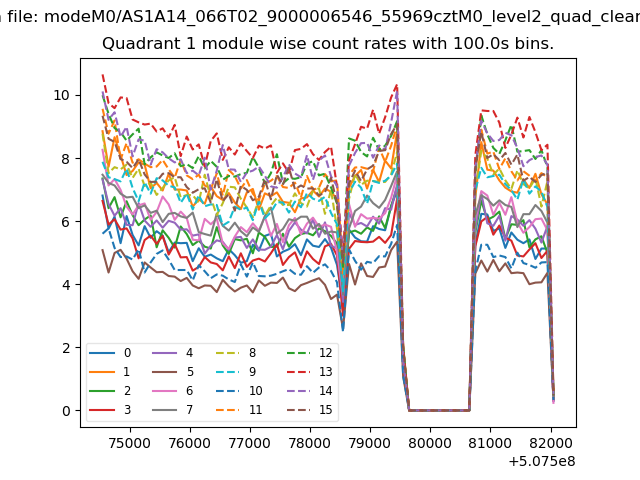
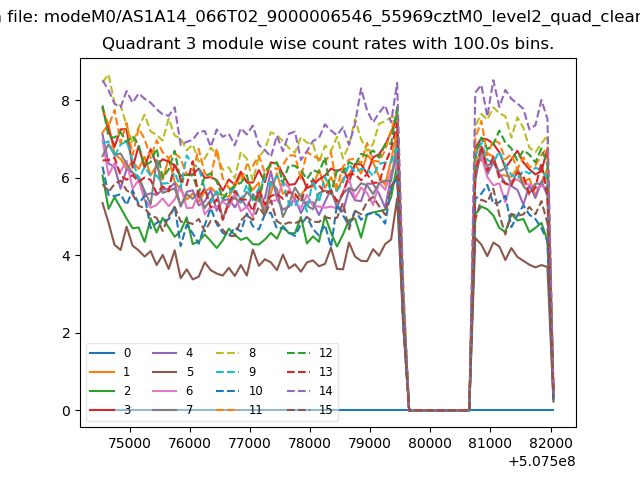
| Module-wise count rates for Quadrant A Data is divided into 100 sec bins |
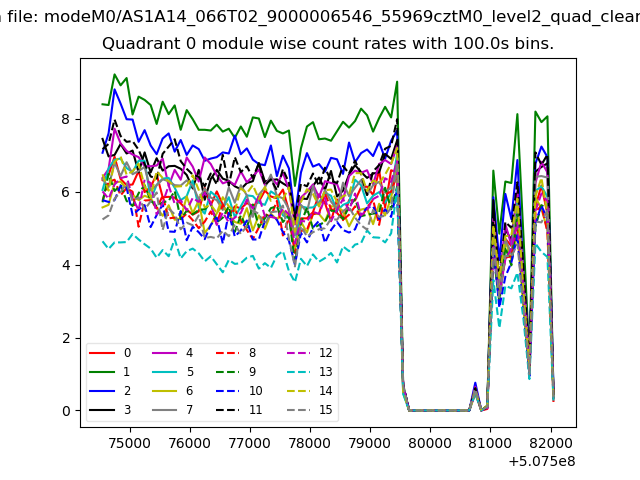 |
 |
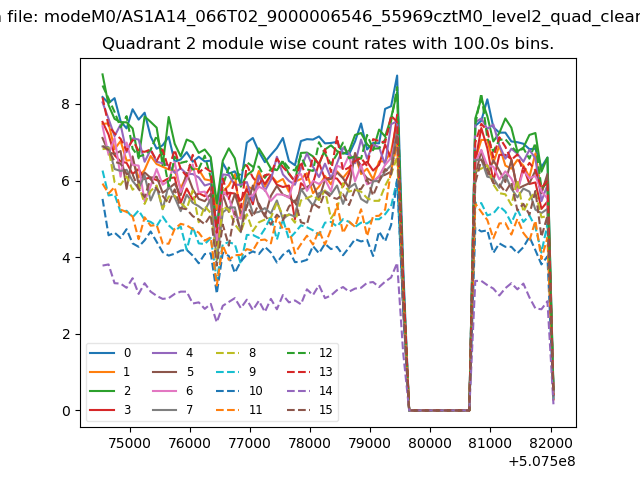
| Module-wise count rates for Quadrant B Data is divided into 100 sec bins |
 |
 |
| Module-wise count rates for Quadrant C Data is divided into 100 sec bins |
 |
 |
| Module-wise count rates for Quadrant D Data is divided into 100 sec bins |
 |
 |
| Parameter | Plot |
|---|---|
| CZT HV Monitor |  |
| D_VDD | 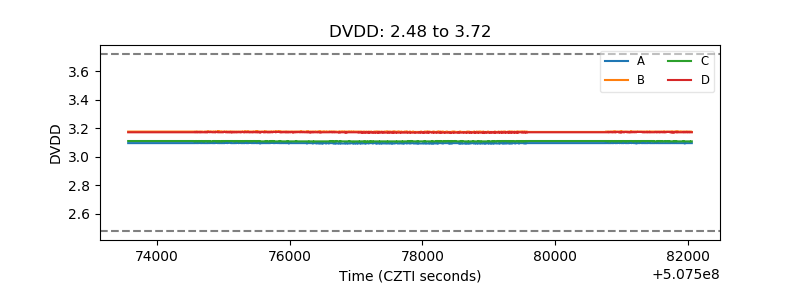 |
| Temperature 1 | 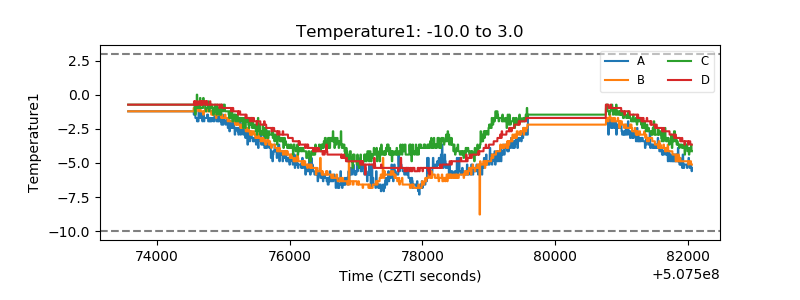 |
| Veto HV Monitor | 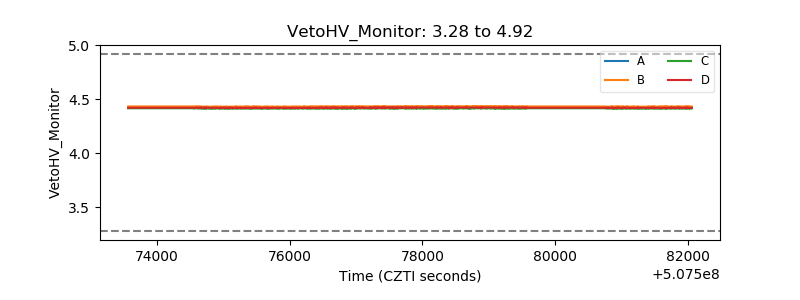 |
| Veto LLD | 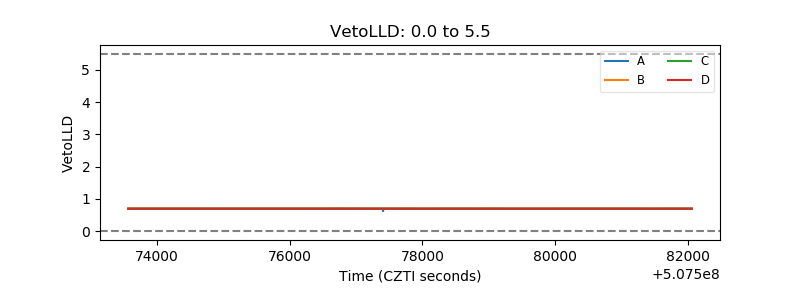 |
| Alpha Counter | 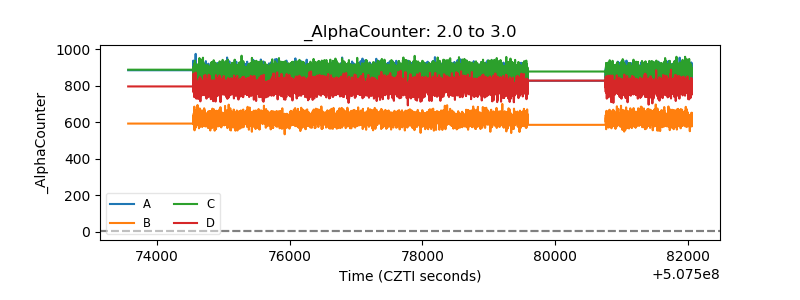 |
| _CPM_Rate | 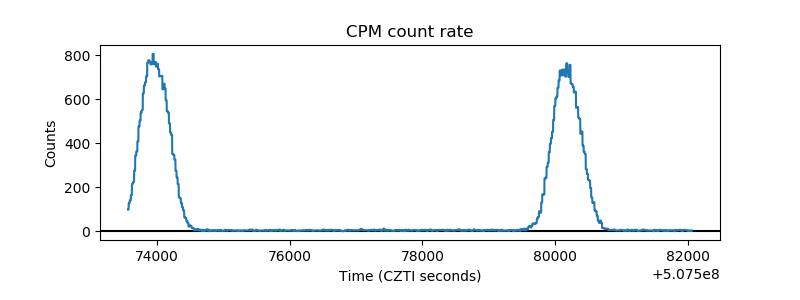 |
| CZT Counter | 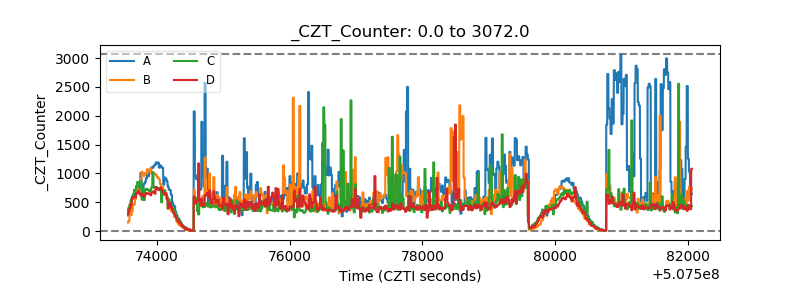 |
| +2.5 Volts monitor | 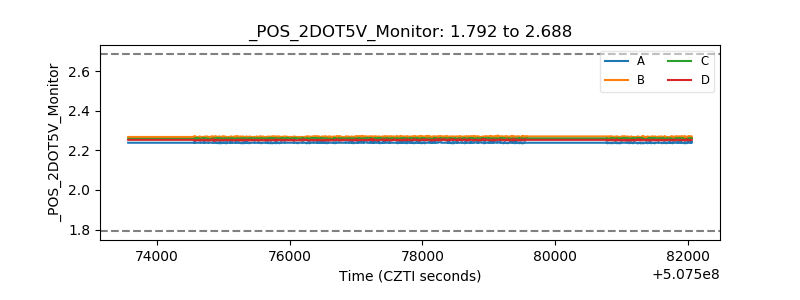 |
| +5 Volts monitor |  |
| _ROLL_ROT | 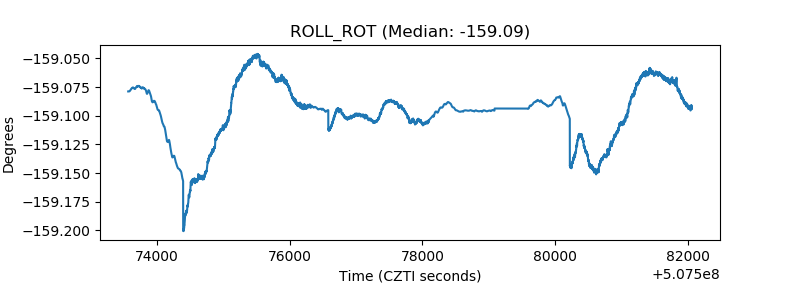 |
| _Roll_DEC | 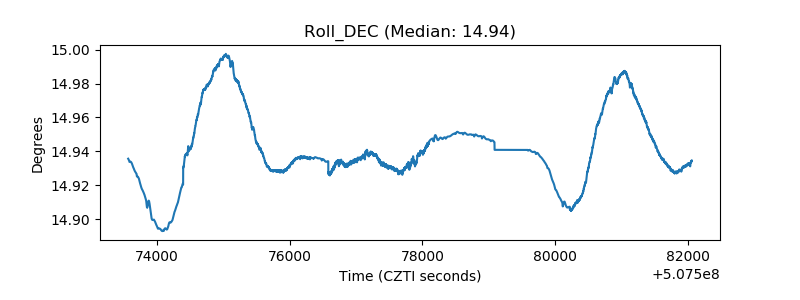 |
| _Roll_RA | 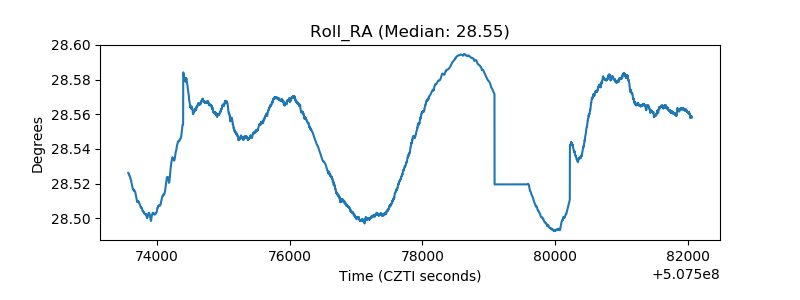 |
| Veto Counter | 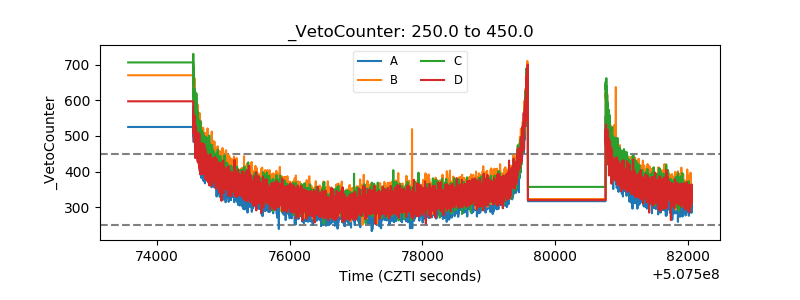 |