| Param | Original file | Final file |
|---|---|---|
| Filename | modeM0/AS1A14_066T02_9000006546_55970cztM0_level2.fits | modeM0/AS1A14_066T02_9000006546_55970cztM0_level2_quad_clean.evt |
| Size (bytes) | 611,660,160 | 87,330,240 |
| Size | 583.3 MB | 83.3 MB |
| Events in quadrant A | 11,253,392 | 378,145 |
| Events in quadrant B | 3,457,785 | 678,558 |
| Events in quadrant C | 3,181,407 | 598,947 |
| Events in quadrant D | 4,238,951 | 530,312 |
| Mode M9 | |||
|---|---|---|---|
| Quadrant | BADHDUFLAG | Total packets | Discarded packets |
| A | 0 | 22 | 0 |
| B | 0 | 22 | 0 |
| C | 0 | 22 | 0 |
| D | 0 | 22 | 0 |
| Mode M0 | |||
|---|---|---|---|
| Quadrant | BADHDUFLAG | Total packets | Discarded packets |
| A | 0 | 37924 | 2 |
| B | 0 | 14843 | 3 |
| C | 0 | 14430 | 2 |
| D | 0 | 17458 | 2 |
| Mode SS | |||
|---|---|---|---|
| Quadrant | BADHDUFLAG | Total packets | Discarded packets |
| A | 0 | 136 | 0 |
| B | 0 | 136 | 0 |
| C | 0 | 136 | 0 |
| D | 0 | 136 | 0 |
| Quadrant | Total seconds | Saturated seconds | Saturation percentage |
|---|---|---|---|
| A | 6570 | 2802 | 42.648402% |
| B | 6570 | 92 | 1.400304% |
| C | 6570 | 77 | 1.171994% |
| D | 6570 | 531 | 8.082192% |
Noise dominated data is calculated using 1-second bins in cleaned event files. If a bin has >2000 counts, and if more than 50% of those come from <1% of pixels, then it is considered to be noise-dominated and hence unusable.
| Quadrant | # 1 sec bins | Bins with >0 counts | Bins with >2000 counts | High rate bins dominated by noise | Noise dominated (total time) | Noise dominated (detector-on time) | Marked lightcurve |
|---|---|---|---|---|---|---|---|
| A | 8835 | 6572 | 2675 | 2675 | 30.28% | 40.70% | 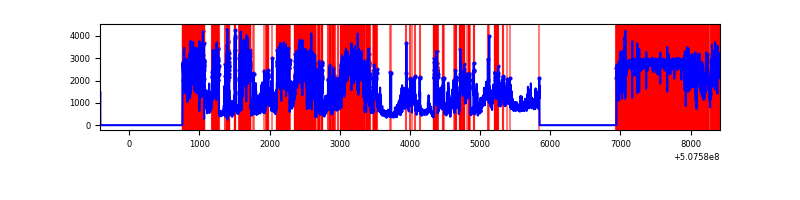 |
| B | 8835 | 6572 | 21 | 21 | 0.24% | 0.32% | 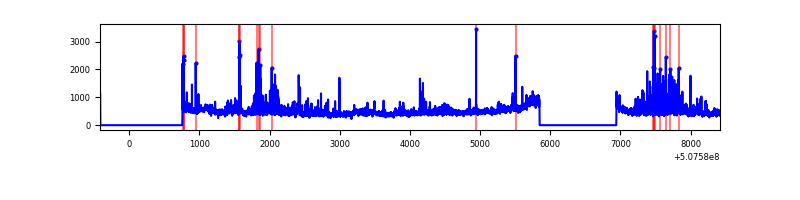 |
| C | 8835 | 6572 | 47 | 47 | 0.53% | 0.72% | 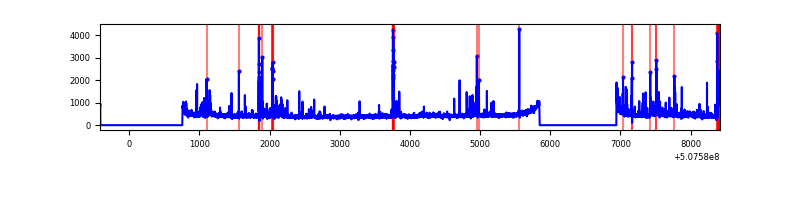 |
| D | 8835 | 6572 | 476 | 476 | 5.39% | 7.24% | 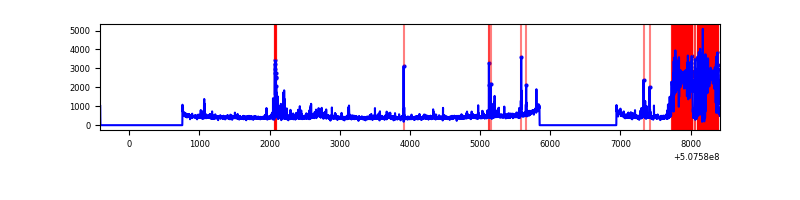 |
Top three noisy pixels from each quadrant. If the there are fewer than three noisy pixels in the level2.evt file, extra rows are filled as -1
| Pixel properties | Quadrant properties | ||||||
|---|---|---|---|---|---|---|---|
| Quadrant | DetID | PixID | Counts | Sigma | Mean | Median | Sigma |
| A | 12 | 115 | 8076184 | 58157.53 | 559 | 544 | 138.9 |
| A | 7 | 64 | 367482 | 2642.54 | 559 | 544 | 138.9 |
| A | 15 | 32 | 319931 | 2300.1 | 559 | 544 | 138.9 |
| B | 0 | 231 | 183088 | 1221.4 | 698 | 673 | 149.3 |
| B | 0 | 199 | 162059 | 1080.59 | 698 | 673 | 149.3 |
| B | 0 | 229 | 112917 | 751.55 | 698 | 673 | 149.3 |
| C | 13 | 3 | 162926 | 855.5 | 687 | 683 | 189.6 |
| C | 12 | 249 | 100478 | 526.21 | 687 | 683 | 189.6 |
| C | 12 | 112 | 52604 | 273.78 | 687 | 683 | 189.6 |
| D | 7 | 96 | 1375352 | 7401.9 | 653 | 625 | 185.7 |
| D | 5 | 173 | 50128 | 266.54 | 653 | 625 | 185.7 |
| D | 7 | 129 | 49893 | 265.27 | 653 | 625 | 185.7 |
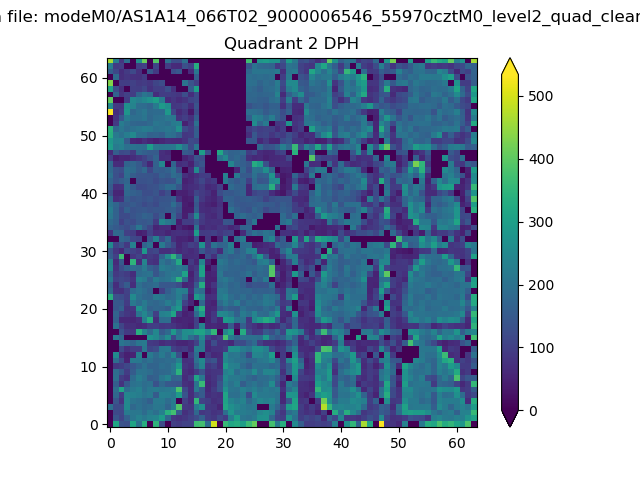
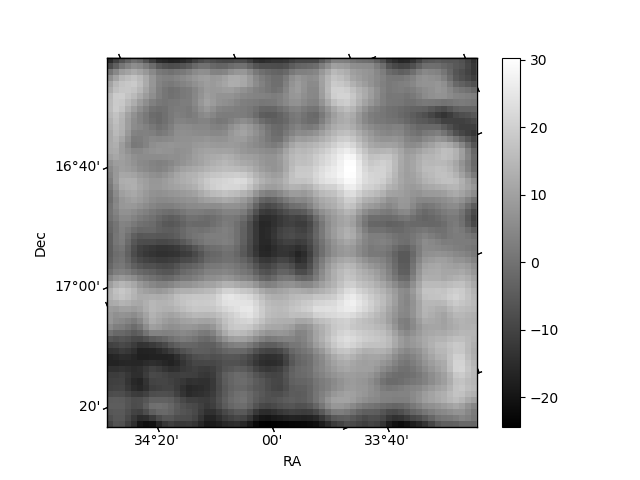
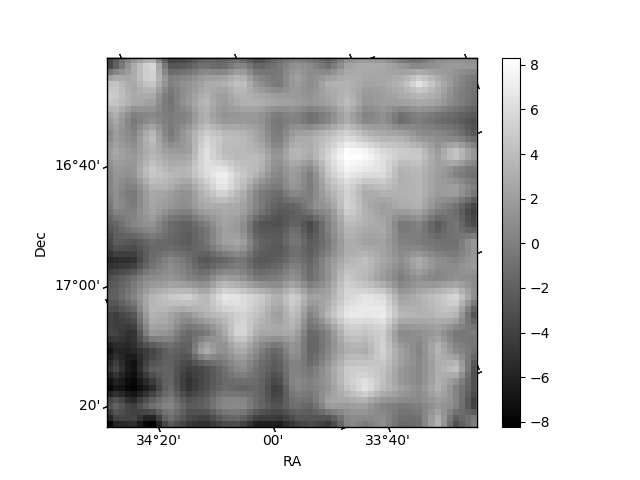
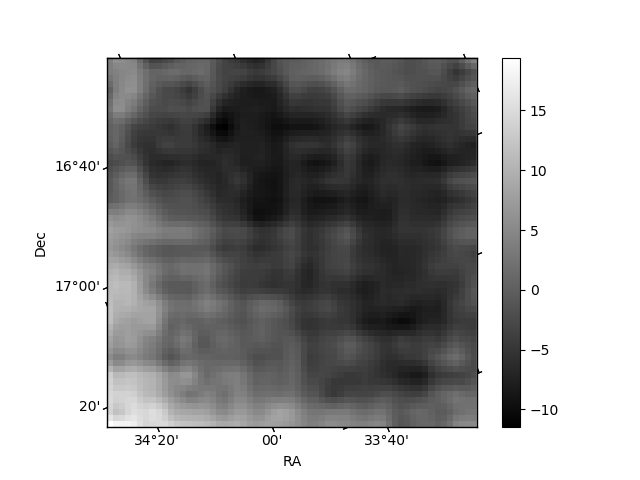
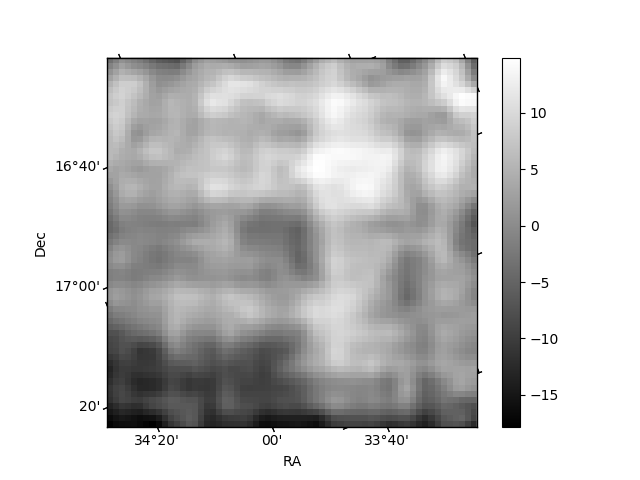
Histogram calculated using DETX and DETY for each event in the final _common_clean file
| Quadrant A | 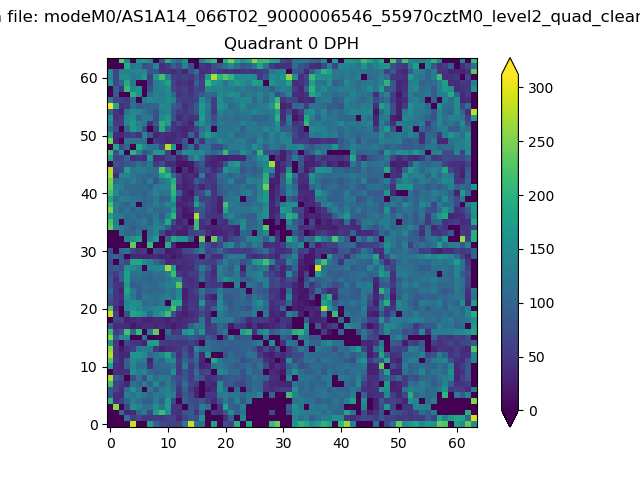 |
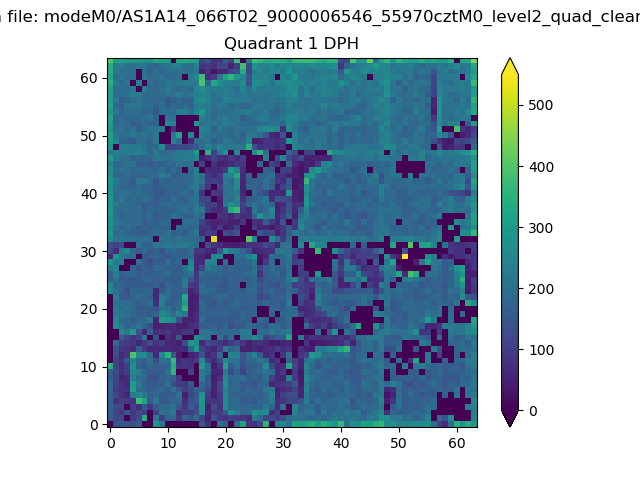 |
Quadrant B |
|---|---|---|---|
| Quadrant D | 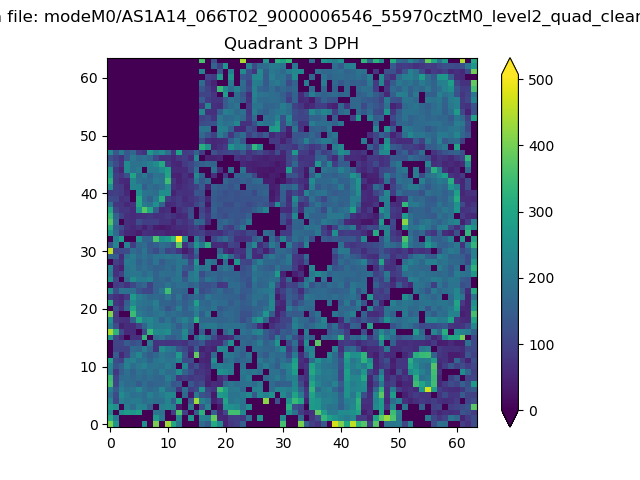 |
 |
Quadrant C |
| Plot type | Count rate plots | Images |
|---|---|---|
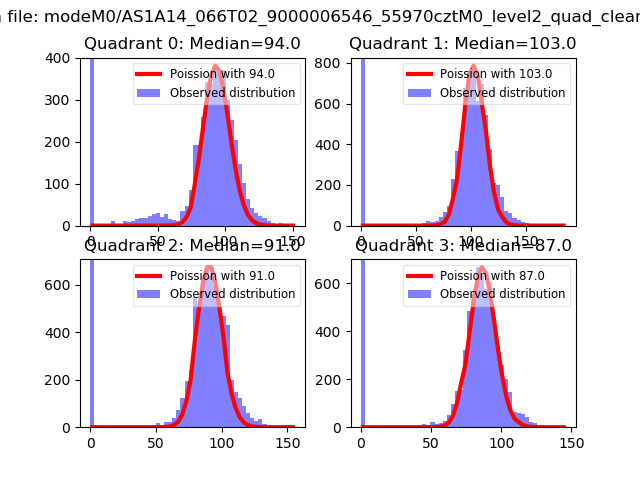
| Comparison with Poisson distribution Blue bars denote a histogram of data divided into 1 sec bins. Red curve is a Poisson curve with rate = median count rate of data. |
 |
 |
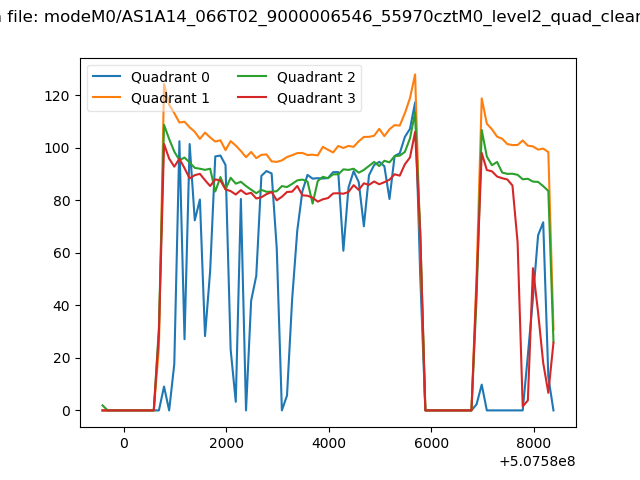
| Quadrant-wise count rates Data is divided into 100 sec bins |
 |
|
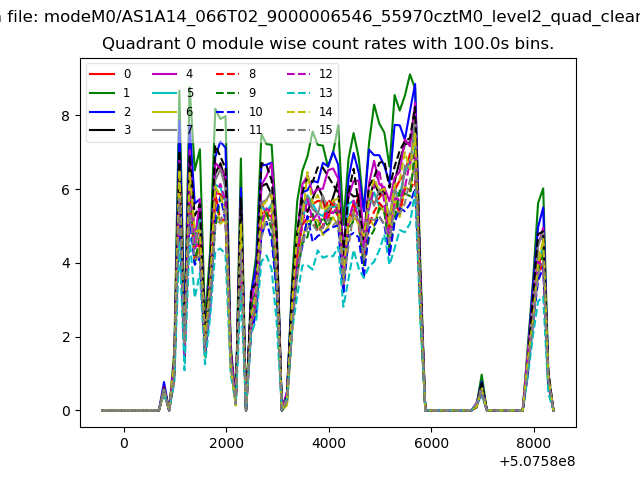
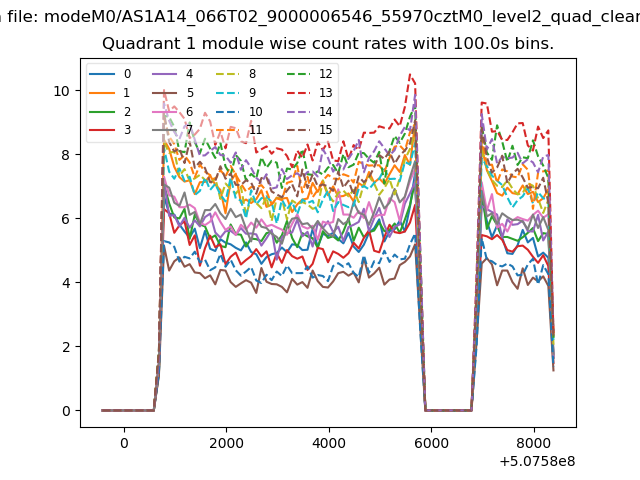
| Module-wise count rates for Quadrant A Data is divided into 100 sec bins |
 |
 |
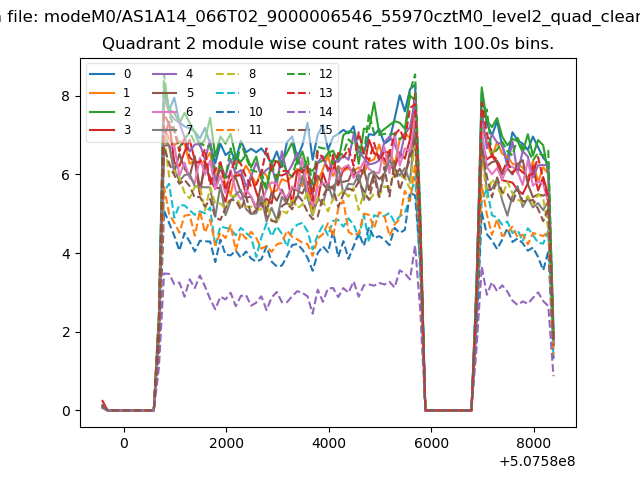
| Module-wise count rates for Quadrant B Data is divided into 100 sec bins |
 |
 |
| Module-wise count rates for Quadrant C Data is divided into 100 sec bins |
 |
 |
| Module-wise count rates for Quadrant D Data is divided into 100 sec bins |
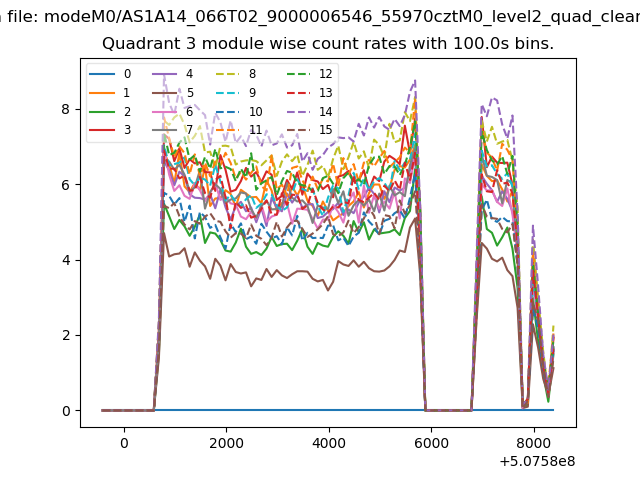 |
 |
| Parameter | Plot |
|---|---|
| CZT HV Monitor | 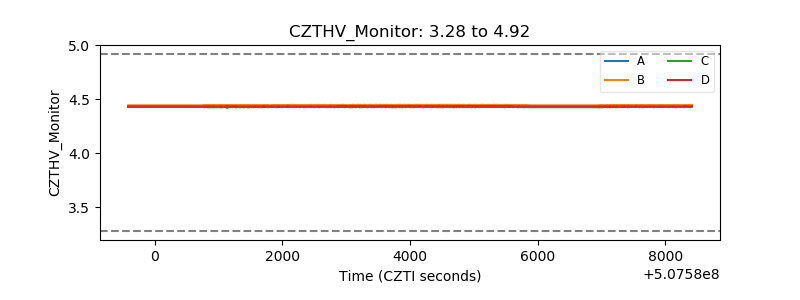 |
| D_VDD | 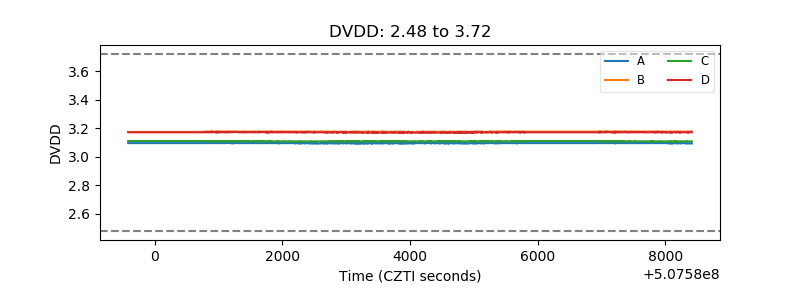 |
| Temperature 1 | 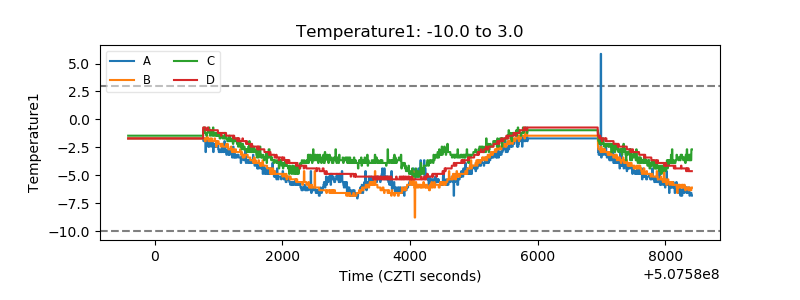 |
| Veto HV Monitor | 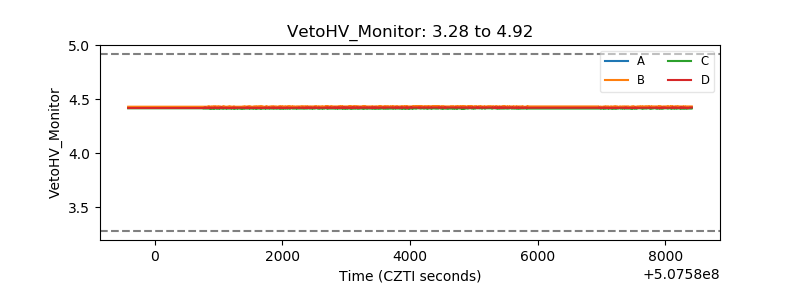 |
| Veto LLD | 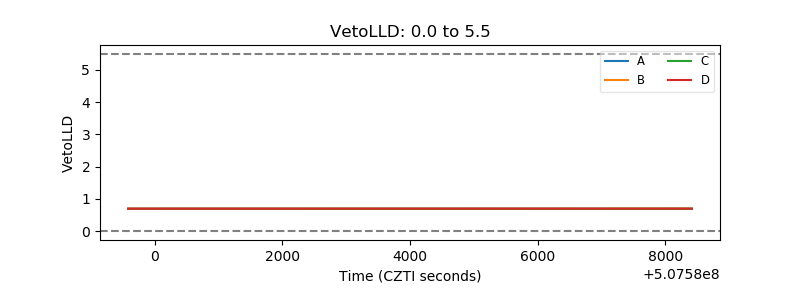 |
| Alpha Counter | 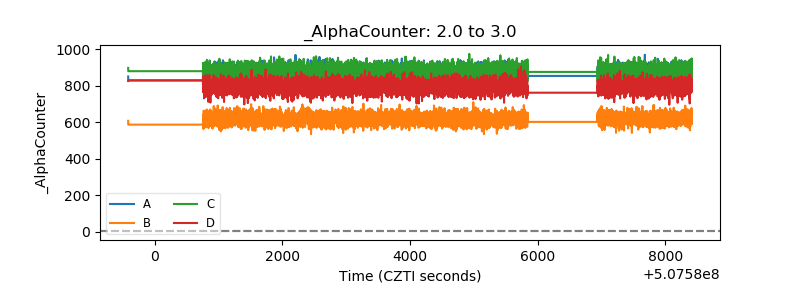 |
| _CPM_Rate | 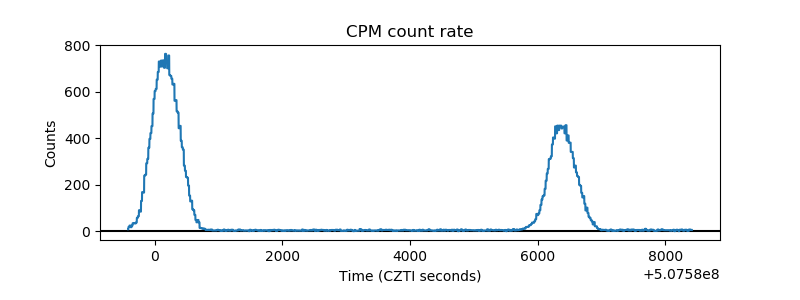 |
| CZT Counter | 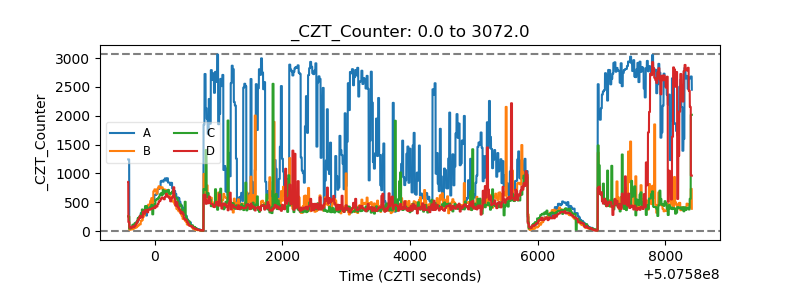 |
| +2.5 Volts monitor | 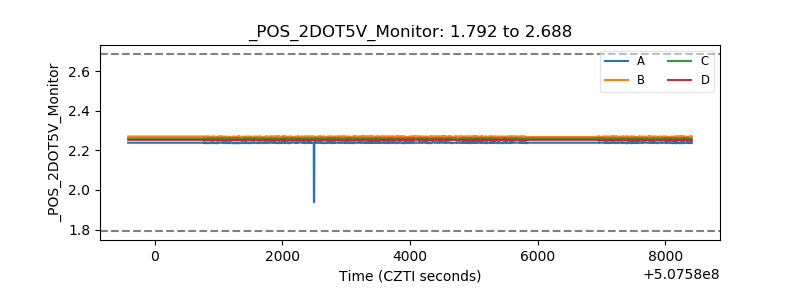 |
| +5 Volts monitor |  |
| _ROLL_ROT | 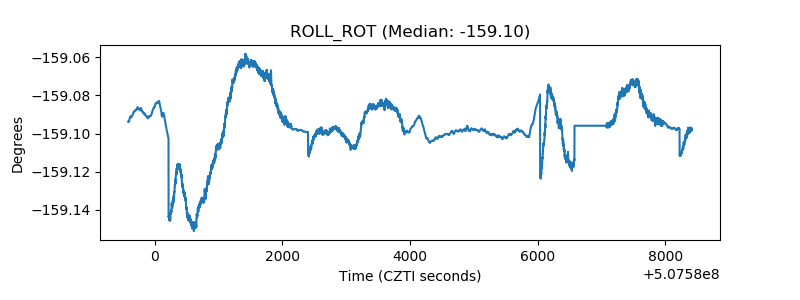 |
| _Roll_DEC | 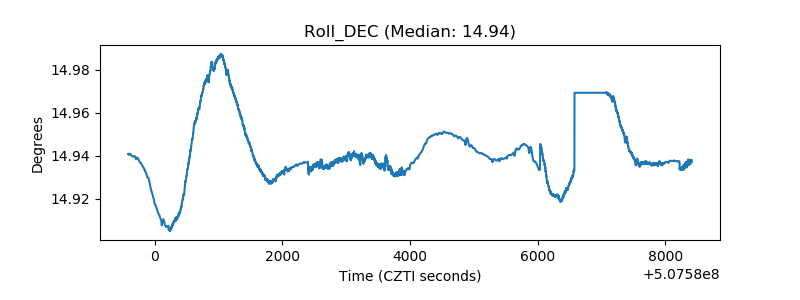 |
| _Roll_RA | 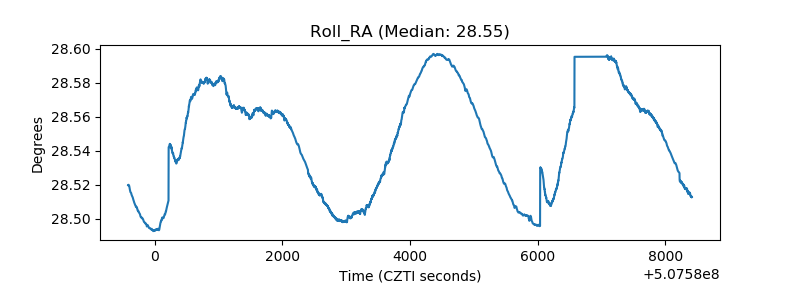 |
| Veto Counter | 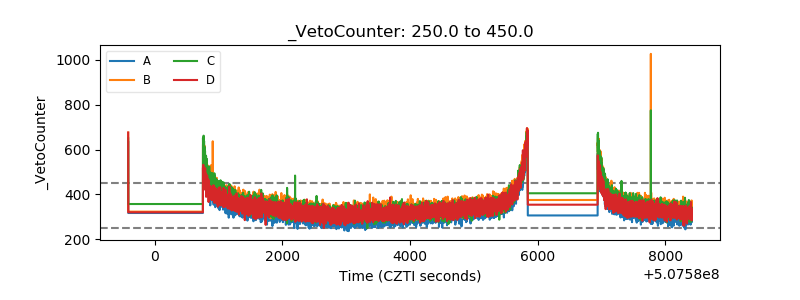 |