| Param | Original file | Final file |
|---|---|---|
| Filename | modeM0/AS1A14_066T02_9000006546_55971cztM0_level2.fits | modeM0/AS1A14_066T02_9000006546_55971cztM0_level2_quad_clean.evt |
| Size (bytes) | 690,658,560 | 82,926,720 |
| Size | 658.7 MB | 79.1 MB |
| Events in quadrant A | 13,185,176 | 298,429 |
| Events in quadrant B | 3,464,975 | 660,377 |
| Events in quadrant C | 3,594,324 | 583,585 |
| Events in quadrant D | 4,810,399 | 509,546 |
| Mode M9 | |||
|---|---|---|---|
| Quadrant | BADHDUFLAG | Total packets | Discarded packets |
| A | 0 | 10 | 0 |
| B | 0 | 10 | 0 |
| C | 0 | 10 | 0 |
| D | 0 | 10 | 0 |
| Mode M0 | |||
|---|---|---|---|
| Quadrant | BADHDUFLAG | Total packets | Discarded packets |
| A | 0 | 43640 | 1 |
| B | 0 | 14784 | 1 |
| C | 0 | 15702 | 1 |
| D | 0 | 19086 | 1 |
| Mode SS | |||
|---|---|---|---|
| Quadrant | BADHDUFLAG | Total packets | Discarded packets |
| A | 0 | 132 | 0 |
| B | 0 | 132 | 0 |
| C | 0 | 132 | 0 |
| D | 0 | 132 | 0 |
| Quadrant | Total seconds | Saturated seconds | Saturation percentage |
|---|---|---|---|
| A | 6585 | 3723 | 56.537585% |
| B | 6585 | 74 | 1.123766% |
| C | 6586 | 129 | 1.958700% |
| D | 6586 | 610 | 9.262071% |
Noise dominated data is calculated using 1-second bins in cleaned event files. If a bin has >2000 counts, and if more than 50% of those come from <1% of pixels, then it is considered to be noise-dominated and hence unusable.
| Quadrant | # 1 sec bins | Bins with >0 counts | Bins with >2000 counts | High rate bins dominated by noise | Noise dominated (total time) | Noise dominated (detector-on time) | Marked lightcurve |
|---|---|---|---|---|---|---|---|
| A | 7565 | 6586 | 3674 | 3674 | 48.57% | 55.78% | 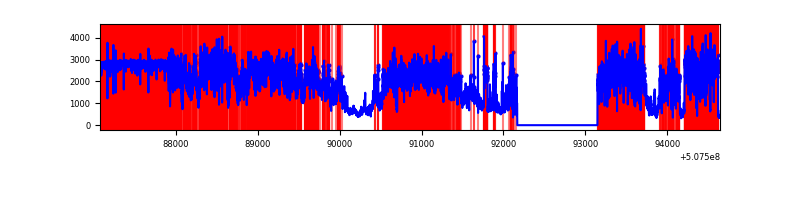 |
| B | 7565 | 6586 | 20 | 20 | 0.26% | 0.30% | 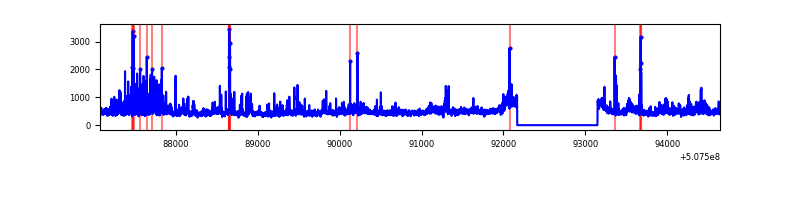 |
| C | 7566 | 6587 | 175 | 175 | 2.31% | 2.66% | 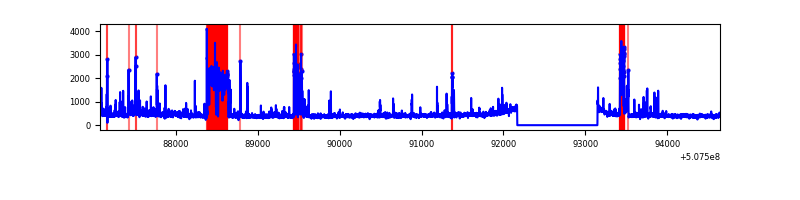 |
| D | 7566 | 6587 | 550 | 550 | 7.27% | 8.35% | 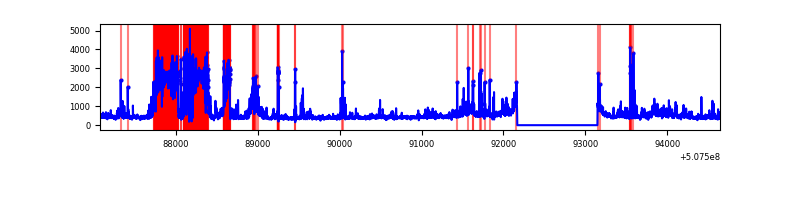 |
Top three noisy pixels from each quadrant. If the there are fewer than three noisy pixels in the level2.evt file, extra rows are filled as -1
| Pixel properties | Quadrant properties | ||||||
|---|---|---|---|---|---|---|---|
| Quadrant | DetID | PixID | Counts | Sigma | Mean | Median | Sigma |
| A | 12 | 115 | 10125448 | 75987.72 | 534 | 520 | 133.2 |
| A | 7 | 64 | 378089 | 2833.66 | 534 | 520 | 133.2 |
| A | 15 | 32 | 376183 | 2819.35 | 534 | 520 | 133.2 |
| B | 0 | 199 | 212328 | 1442.62 | 688 | 662 | 146.7 |
| B | 2 | 249 | 150485 | 1021.13 | 688 | 662 | 146.7 |
| B | 0 | 231 | 101633 | 688.17 | 688 | 662 | 146.7 |
| C | 13 | 3 | 464594 | 2501.34 | 675 | 669 | 185.5 |
| C | 12 | 252 | 206853 | 1111.68 | 675 | 669 | 185.5 |
| C | 15 | 199 | 119809 | 642.37 | 675 | 669 | 185.5 |
| D | 7 | 96 | 1726611 | 9401.25 | 638 | 609 | 183.6 |
| D | 6 | 42 | 250518 | 1361.21 | 638 | 609 | 183.6 |
| D | 11 | 129 | 115366 | 625.06 | 638 | 609 | 183.6 |
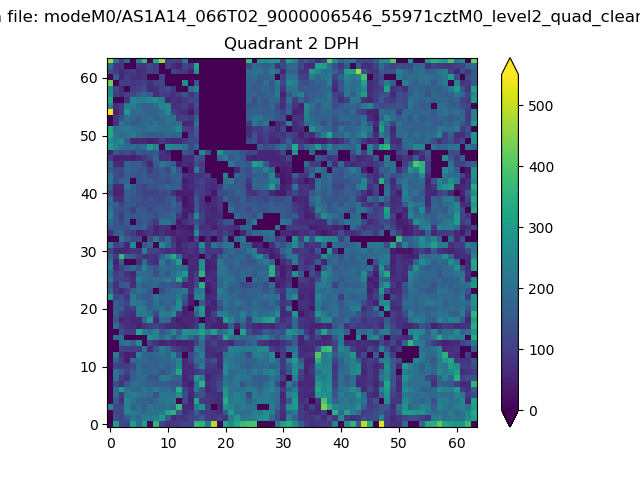
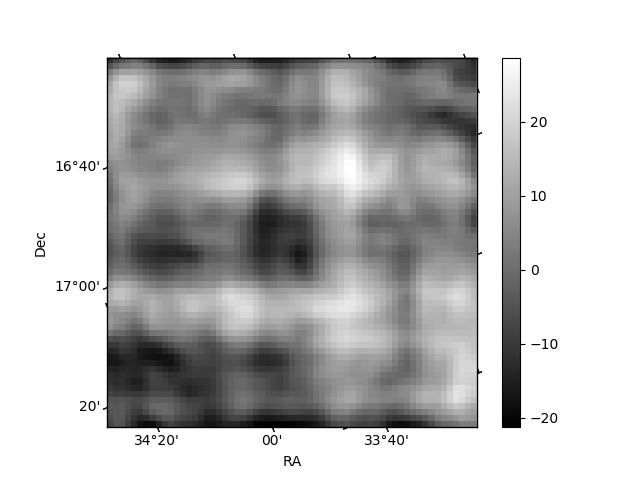
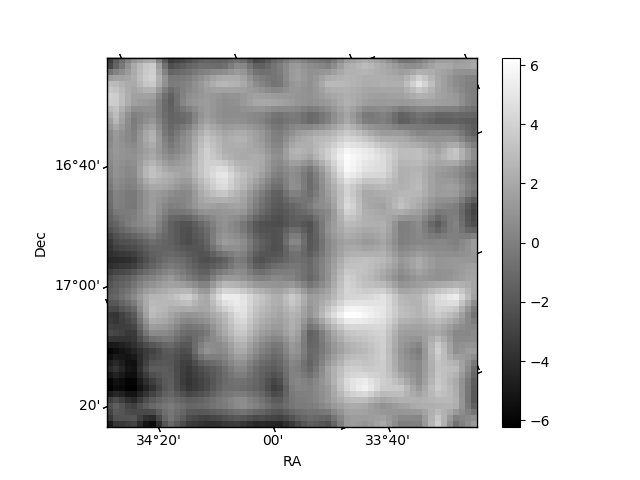
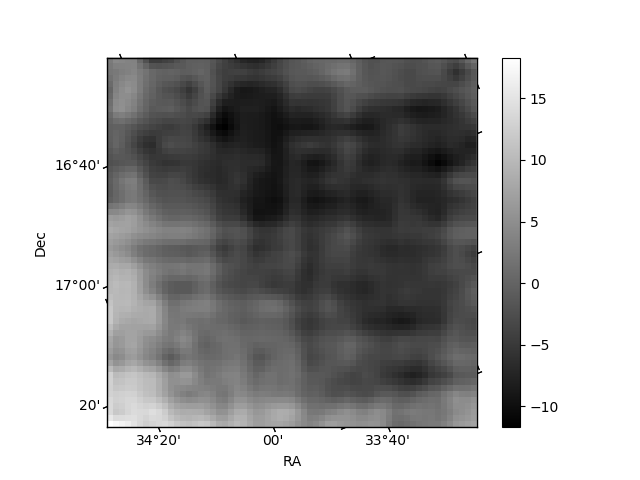
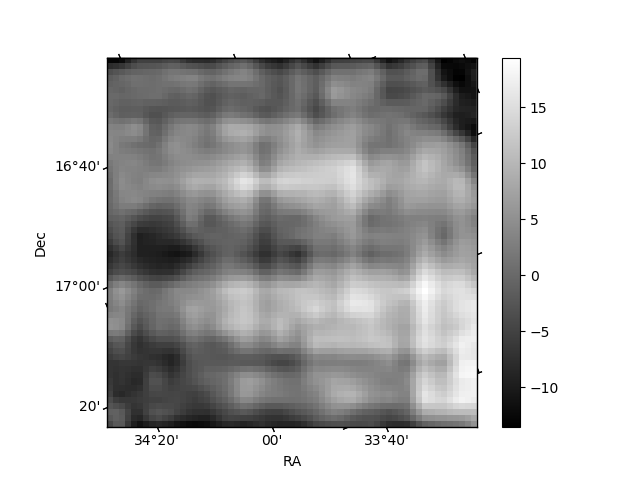
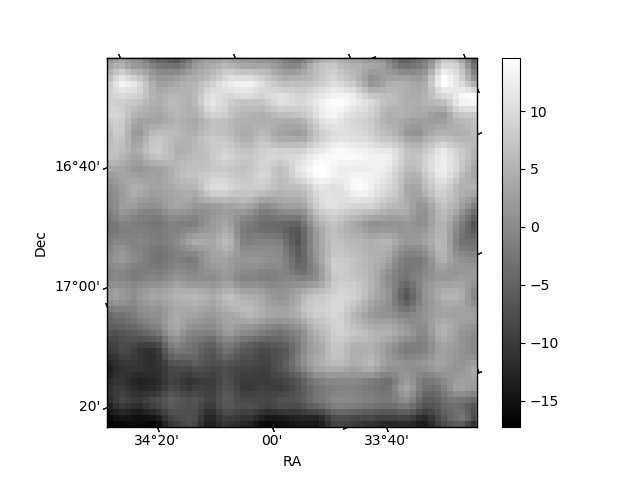
Histogram calculated using DETX and DETY for each event in the final _common_clean file
| Quadrant A | 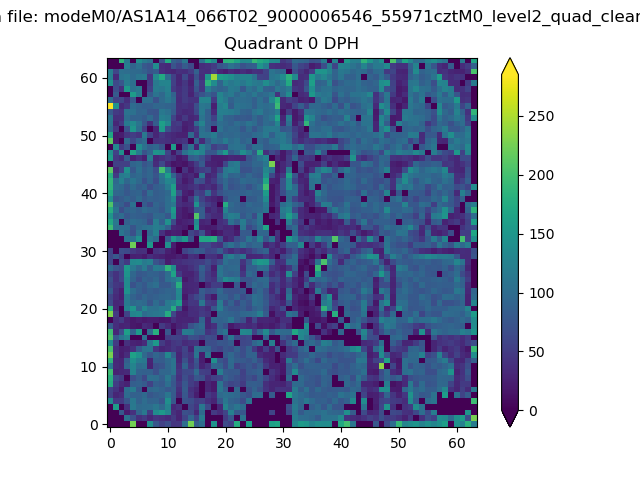 |
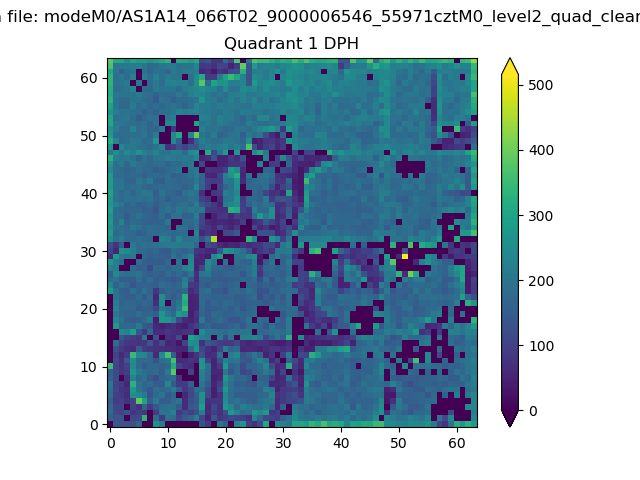 |
Quadrant B |
|---|---|---|---|
| Quadrant D | 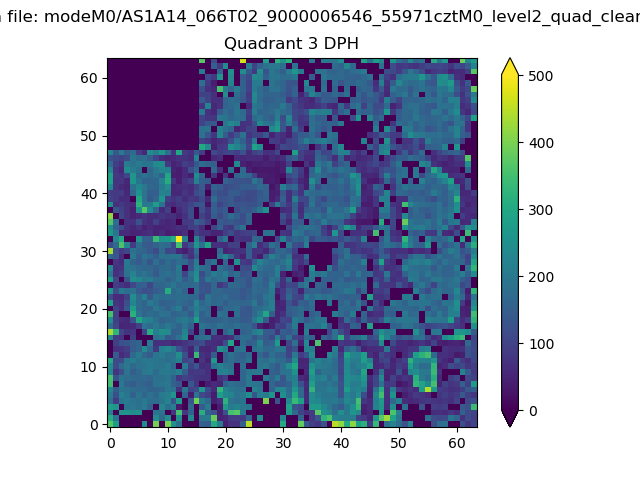 |
 |
Quadrant C |
| Plot type | Count rate plots | Images |
|---|---|---|
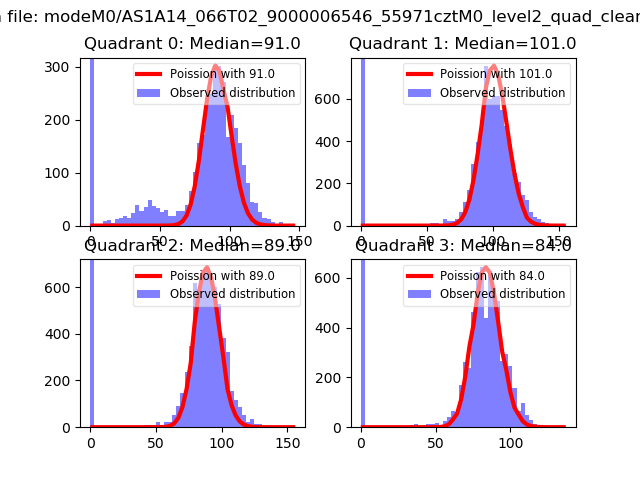
| Comparison with Poisson distribution Blue bars denote a histogram of data divided into 1 sec bins. Red curve is a Poisson curve with rate = median count rate of data. |
 |
 |
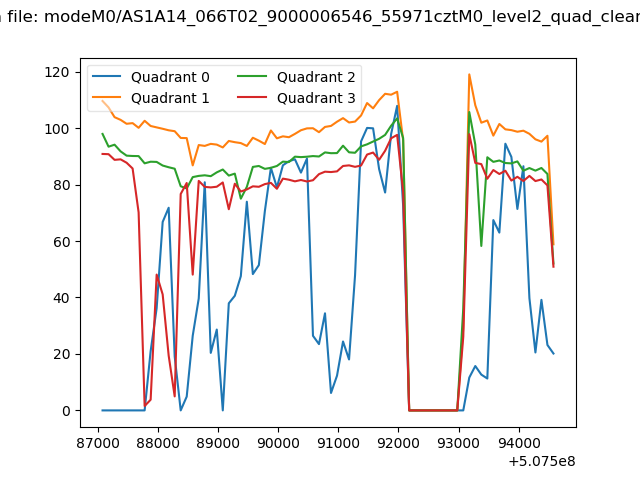
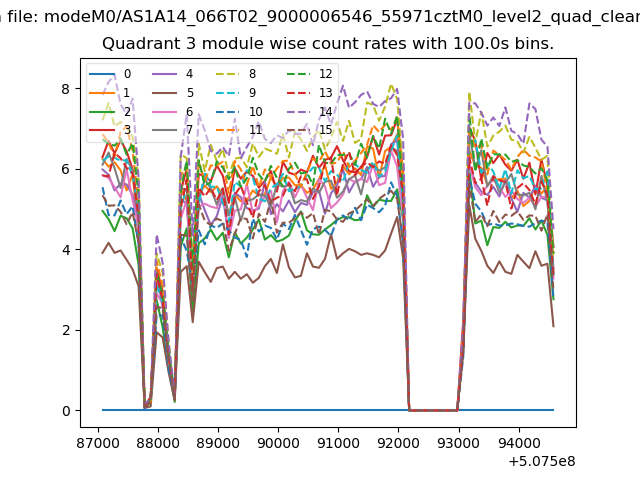
| Quadrant-wise count rates Data is divided into 100 sec bins |
 |
|
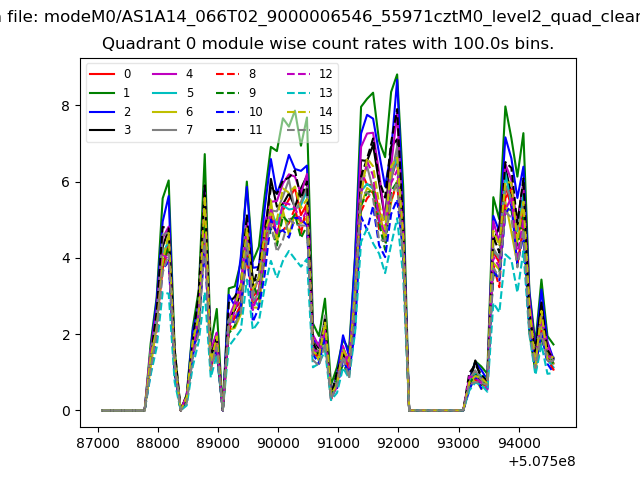
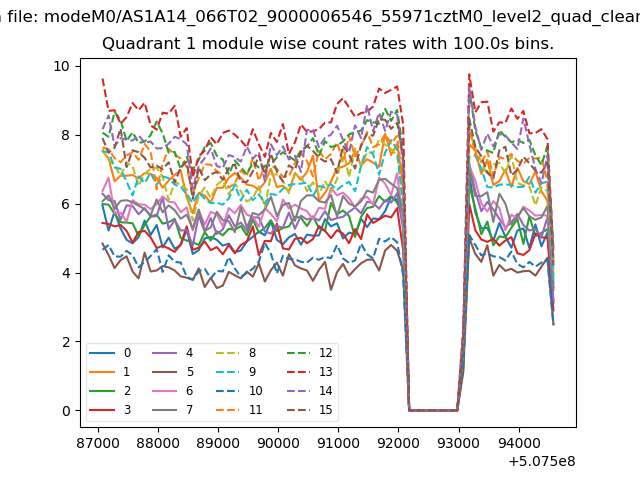
| Module-wise count rates for Quadrant A Data is divided into 100 sec bins |
 |
 |
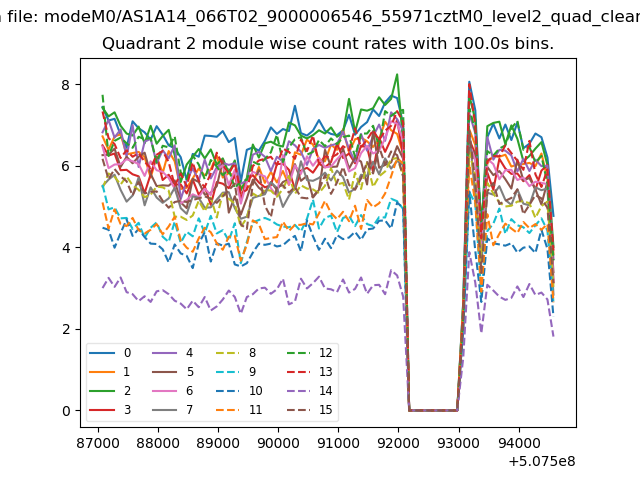
| Module-wise count rates for Quadrant B Data is divided into 100 sec bins |
 |
 |
| Module-wise count rates for Quadrant C Data is divided into 100 sec bins |
 |
 |
| Module-wise count rates for Quadrant D Data is divided into 100 sec bins |
 |
 |
| Parameter | Plot |
|---|---|
| CZT HV Monitor | 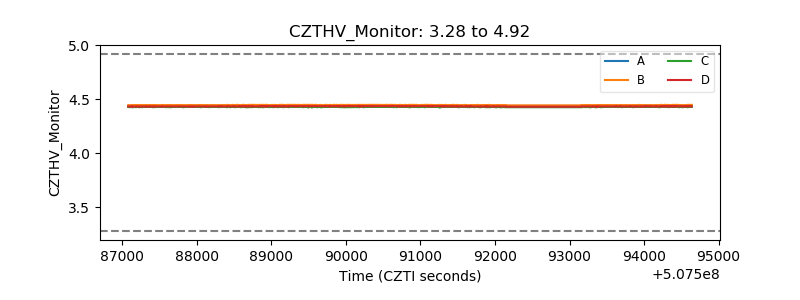 |
| D_VDD | 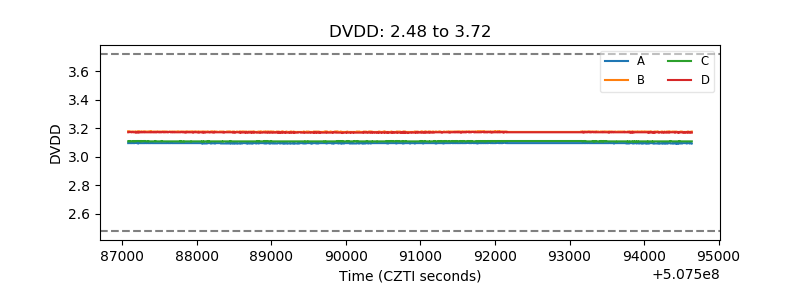 |
| Temperature 1 | 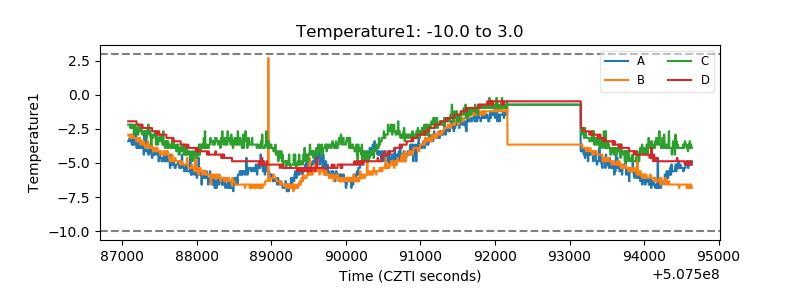 |
| Veto HV Monitor | 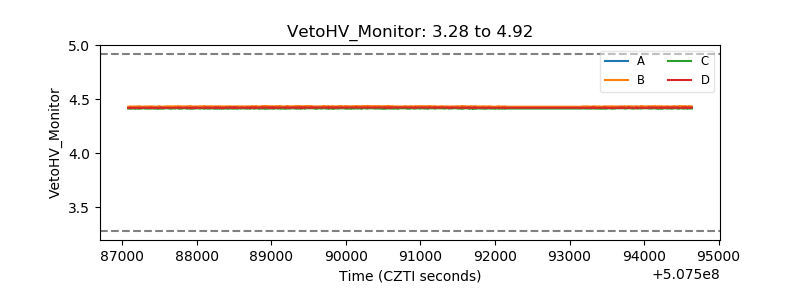 |
| Veto LLD | 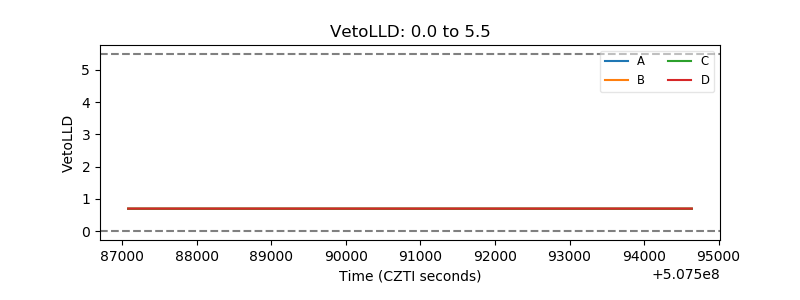 |
| Alpha Counter | 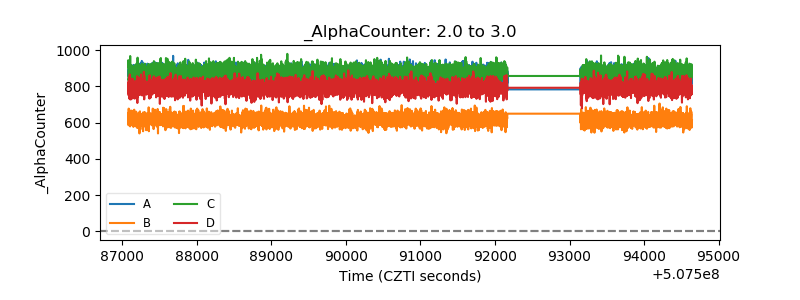 |
| _CPM_Rate | 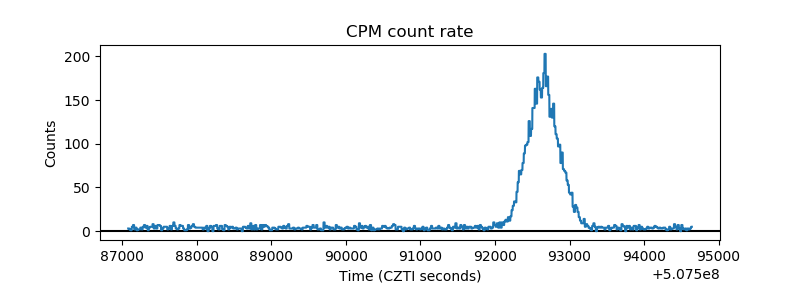 |
| CZT Counter | 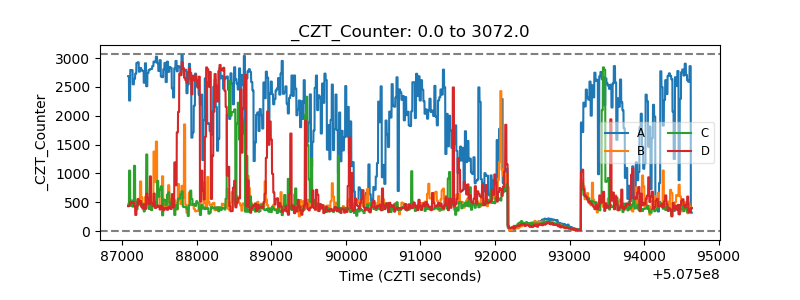 |
| +2.5 Volts monitor |  |
| +5 Volts monitor | 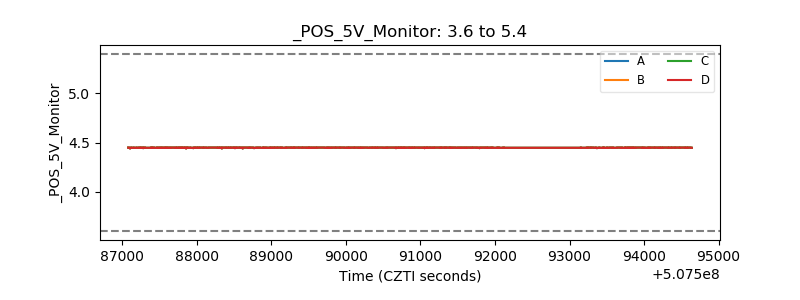 |
| _ROLL_ROT | 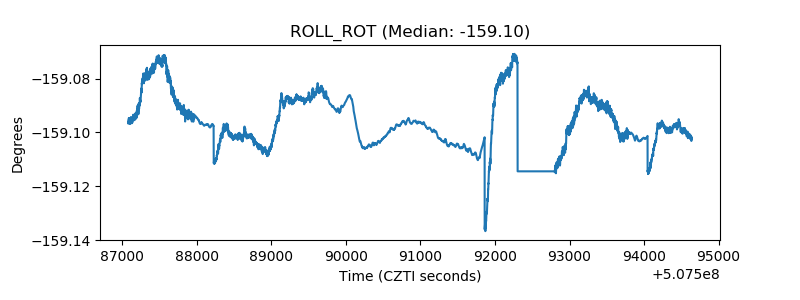 |
| _Roll_DEC | 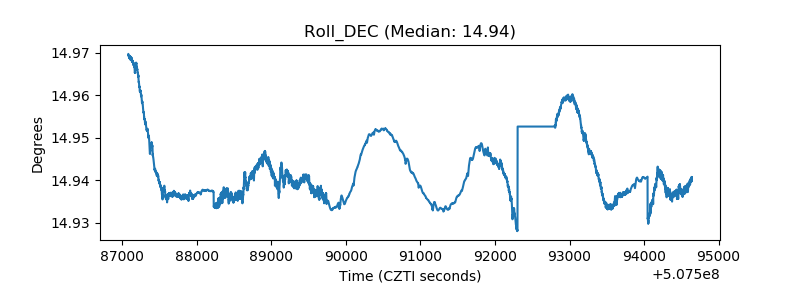 |
| _Roll_RA | 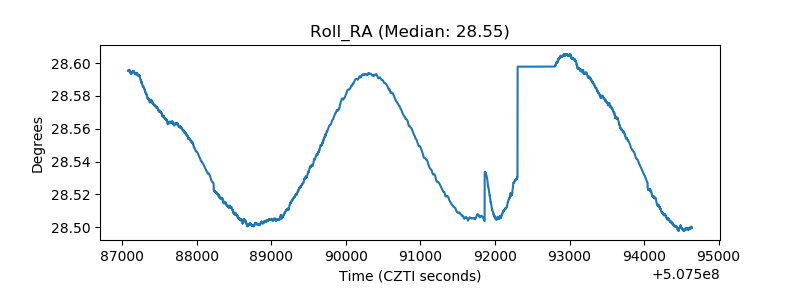 |
| Veto Counter | 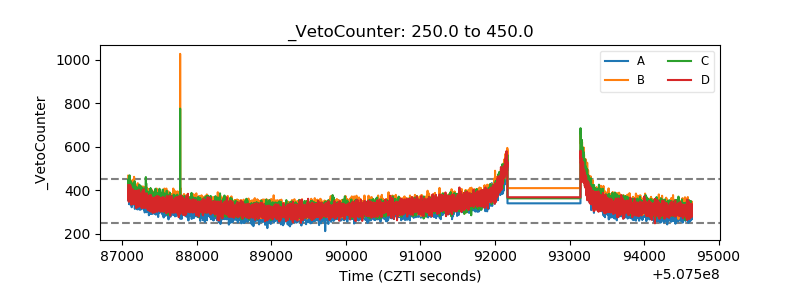 |