| Param | Original file | Final file |
|---|---|---|
| Filename | modeM0/AS1A14_066T02_9000006546_55972cztM0_level2.fits | modeM0/AS1A14_066T02_9000006546_55972cztM0_level2_quad_clean.evt |
| Size (bytes) | 600,344,640 | 97,577,280 |
| Size | 572.5 MB | 93.1 MB |
| Events in quadrant A | 10,236,788 | 470,050 |
| Events in quadrant B | 3,893,610 | 718,729 |
| Events in quadrant C | 3,988,167 | 640,420 |
| Events in quadrant D | 3,537,469 | 617,355 |
| Mode M9 | |||
|---|---|---|---|
| Quadrant | BADHDUFLAG | Total packets | Discarded packets |
| A | 0 | 8 | 0 |
| B | 0 | 9 | 0 |
| C | 0 | 9 | 0 |
| D | 0 | 9 | 0 |
| Mode M0 | |||
|---|---|---|---|
| Quadrant | BADHDUFLAG | Total packets | Discarded packets |
| A | 0 | 35420 | 2 |
| B | 0 | 16362 | 2 |
| C | 0 | 17384 | 2 |
| D | 0 | 15970 | 2 |
| Mode SS | |||
|---|---|---|---|
| Quadrant | BADHDUFLAG | Total packets | Discarded packets |
| A | 0 | 148 | 0 |
| B | 0 | 148 | 0 |
| C | 0 | 148 | 0 |
| D | 0 | 148 | 0 |
| Quadrant | Total seconds | Saturated seconds | Saturation percentage |
|---|---|---|---|
| A | 7297 | 2361 | 32.355763% |
| B | 7297 | 138 | 1.891188% |
| C | 7297 | 201 | 2.754557% |
| D | 7297 | 47 | 0.644100% |
Noise dominated data is calculated using 1-second bins in cleaned event files. If a bin has >2000 counts, and if more than 50% of those come from <1% of pixels, then it is considered to be noise-dominated and hence unusable.
| Quadrant | # 1 sec bins | Bins with >0 counts | Bins with >2000 counts | High rate bins dominated by noise | Noise dominated (total time) | Noise dominated (detector-on time) | Marked lightcurve |
|---|---|---|---|---|---|---|---|
| A | 7902 | 7298 | 2091 | 2091 | 26.46% | 28.65% | 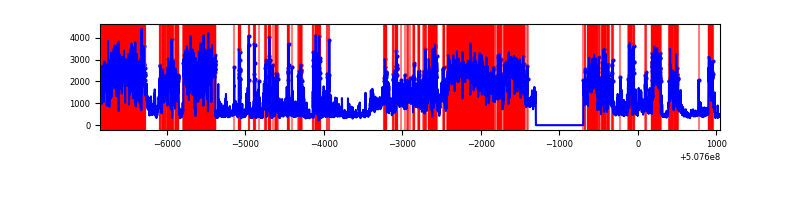 |
| B | 7902 | 7298 | 21 | 21 | 0.27% | 0.29% | 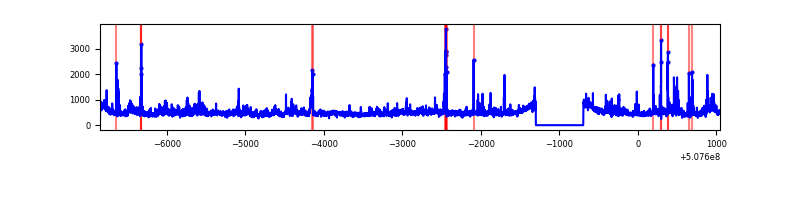 |
| C | 7902 | 7298 | 151 | 151 | 1.91% | 2.07% | 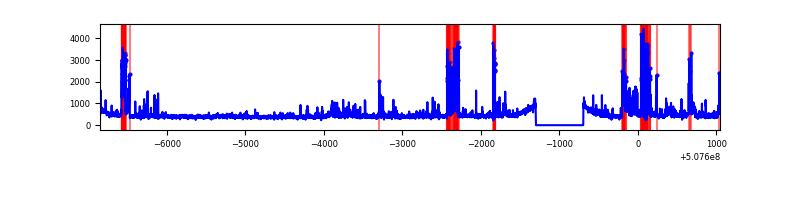 |
| D | 7902 | 7298 | 21 | 21 | 0.27% | 0.29% | 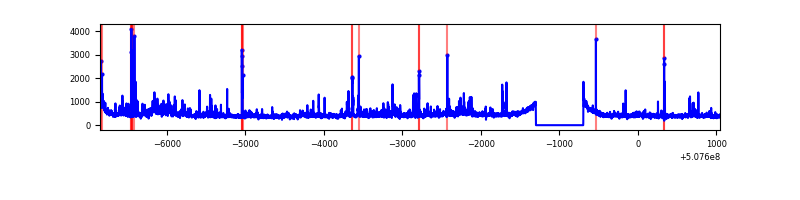 |
Top three noisy pixels from each quadrant. If the there are fewer than three noisy pixels in the level2.evt file, extra rows are filled as -1
| Pixel properties | Quadrant properties | ||||||
|---|---|---|---|---|---|---|---|
| Quadrant | DetID | PixID | Counts | Sigma | Mean | Median | Sigma |
| A | 12 | 115 | 5684832 | 33456.96 | 681 | 666 | 169.9 |
| A | 15 | 32 | 1067798 | 6281.13 | 681 | 666 | 169.9 |
| A | 7 | 64 | 272316 | 1598.93 | 681 | 666 | 169.9 |
| B | 0 | 199 | 215720 | 1275.04 | 774 | 745 | 168.6 |
| B | 0 | 229 | 198745 | 1174.36 | 774 | 745 | 168.6 |
| B | 2 | 249 | 153540 | 906.24 | 774 | 745 | 168.6 |
| C | 2 | 12 | 282552 | 1348.57 | 758 | 752 | 209.0 |
| C | 9 | 38 | 264644 | 1262.87 | 758 | 752 | 209.0 |
| C | 13 | 3 | 201658 | 961.45 | 758 | 752 | 209.0 |
| D | 6 | 42 | 169767 | 785.49 | 758 | 724 | 215.2 |
| D | 7 | 96 | 128086 | 591.81 | 758 | 724 | 215.2 |
| D | 11 | 129 | 86280 | 397.55 | 758 | 724 | 215.2 |
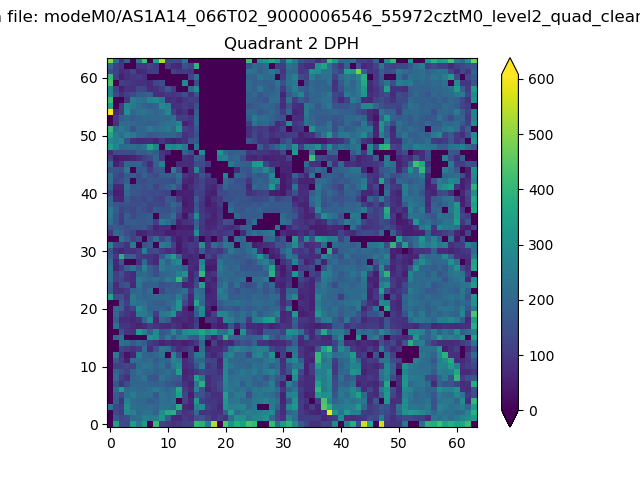
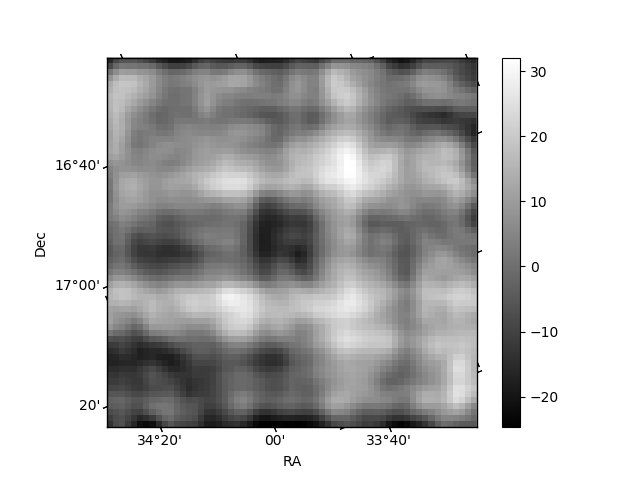
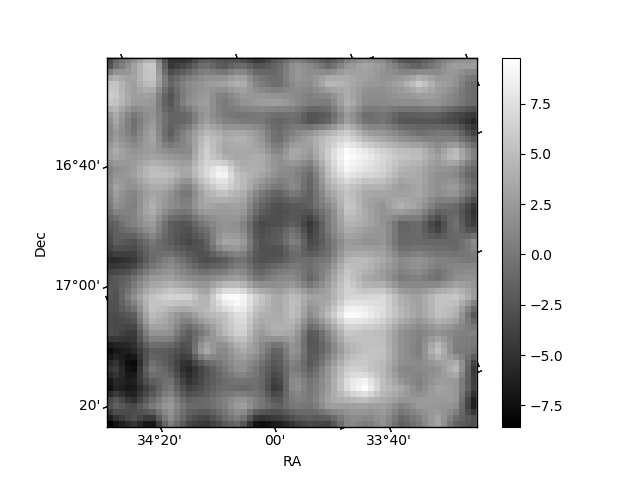
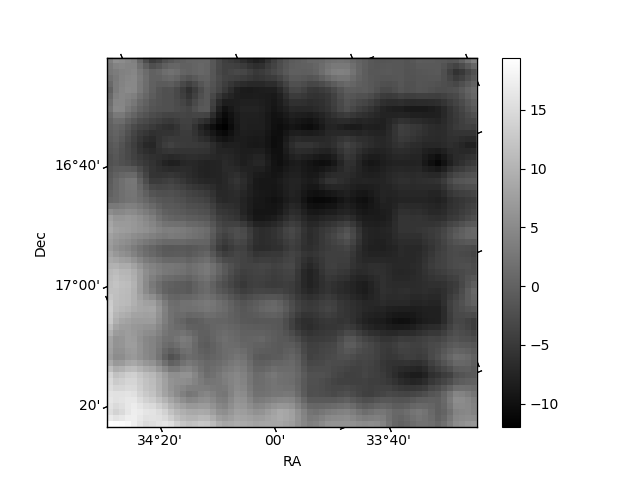
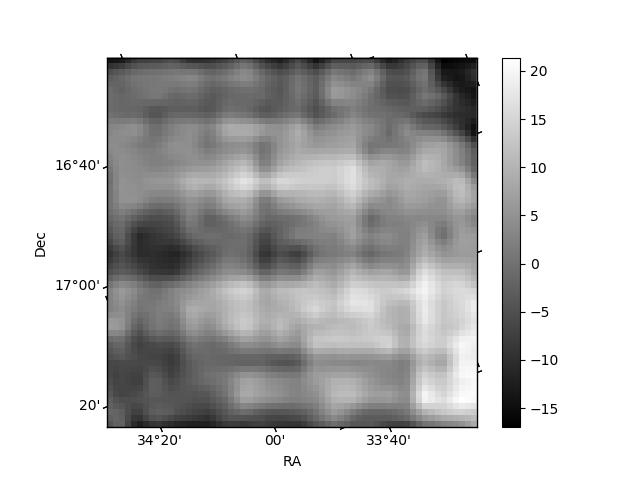
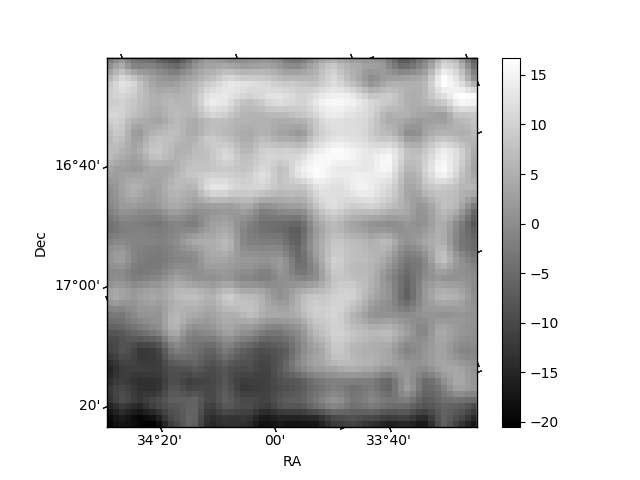
Histogram calculated using DETX and DETY for each event in the final _common_clean file
| Quadrant A | 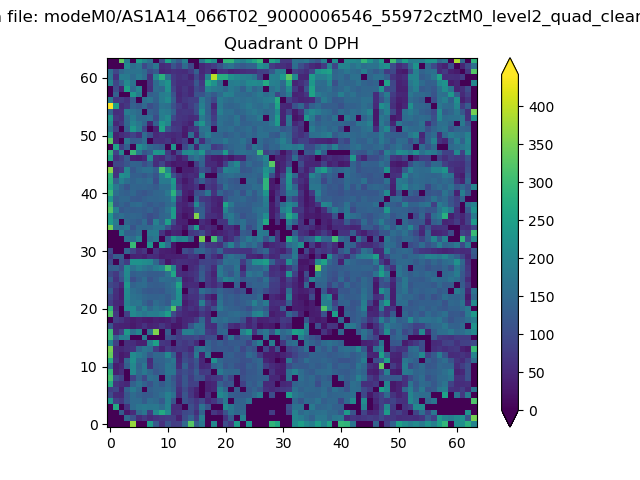 |
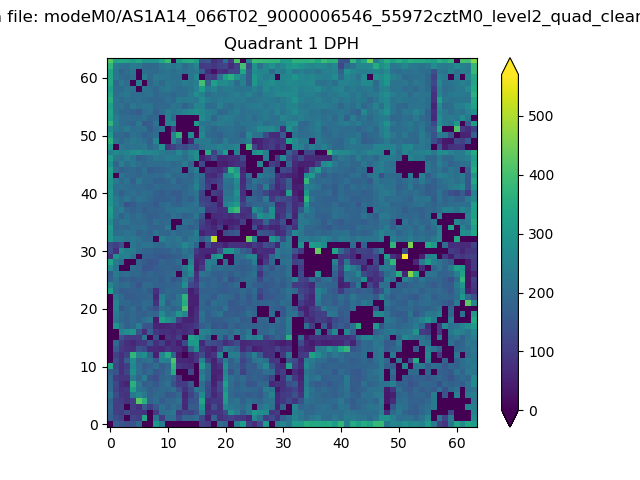 |
Quadrant B |
|---|---|---|---|
| Quadrant D | 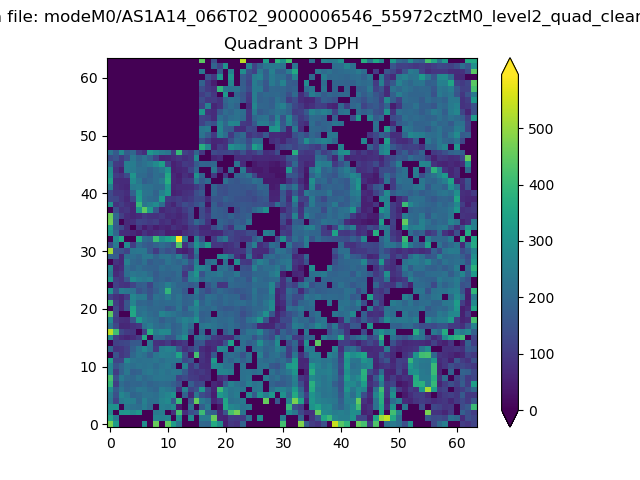 |
 |
Quadrant C |
| Plot type | Count rate plots | Images |
|---|---|---|
| Comparison with Poisson distribution Blue bars denote a histogram of data divided into 1 sec bins. Red curve is a Poisson curve with rate = median count rate of data. |
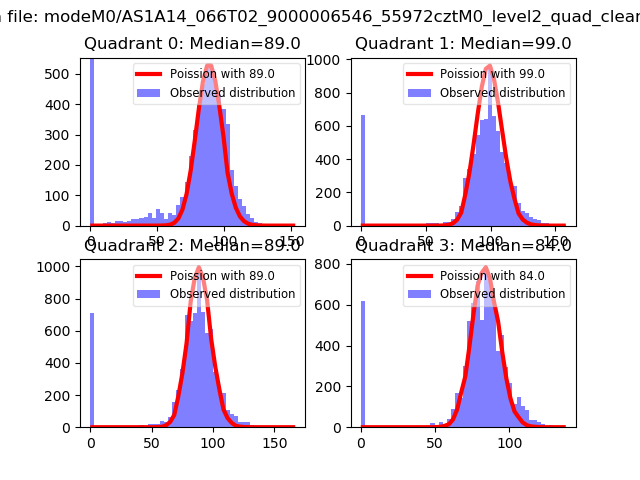 |
 |
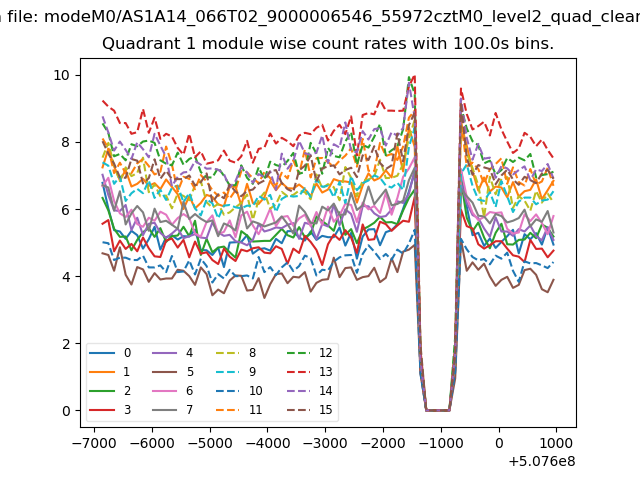
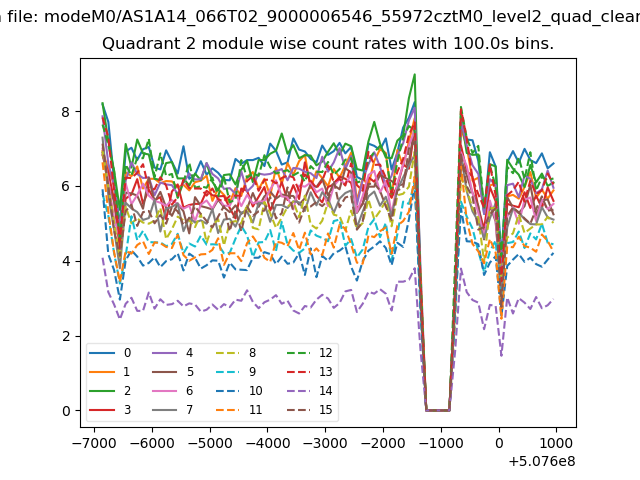
| Quadrant-wise count rates Data is divided into 100 sec bins |
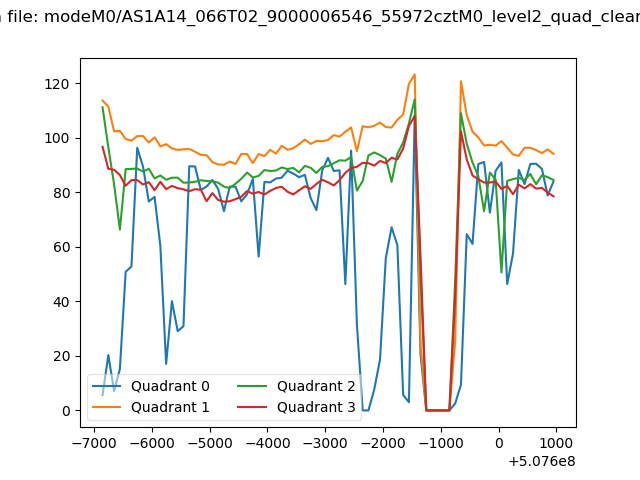 |
|
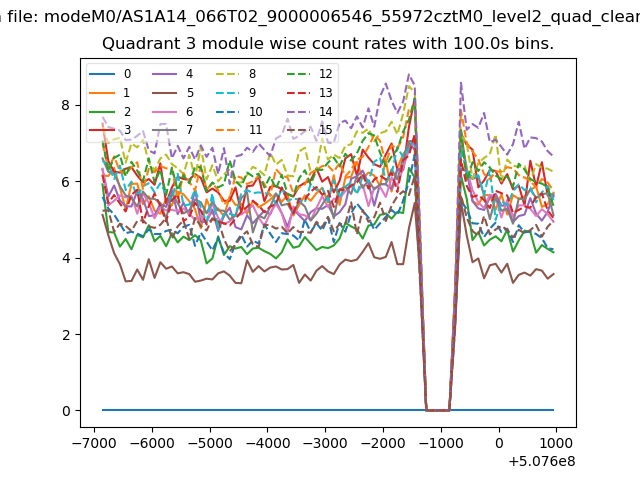
| Module-wise count rates for Quadrant A Data is divided into 100 sec bins |
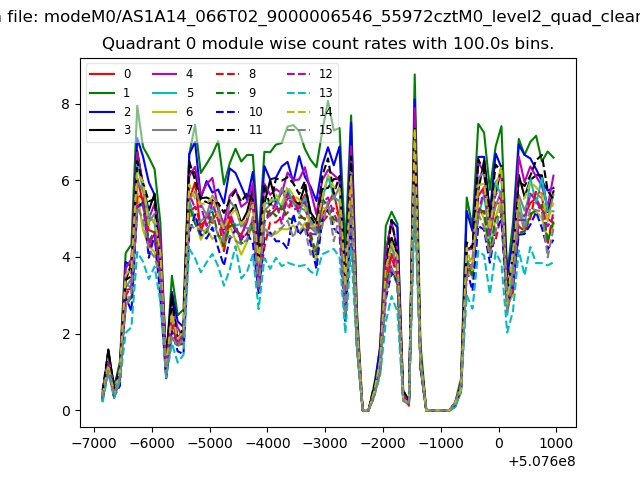 |
 |
| Module-wise count rates for Quadrant B Data is divided into 100 sec bins |
 |
 |
| Module-wise count rates for Quadrant C Data is divided into 100 sec bins |
 |
 |
| Module-wise count rates for Quadrant D Data is divided into 100 sec bins |
 |
 |
| Parameter | Plot |
|---|---|
| CZT HV Monitor |  |
| D_VDD | 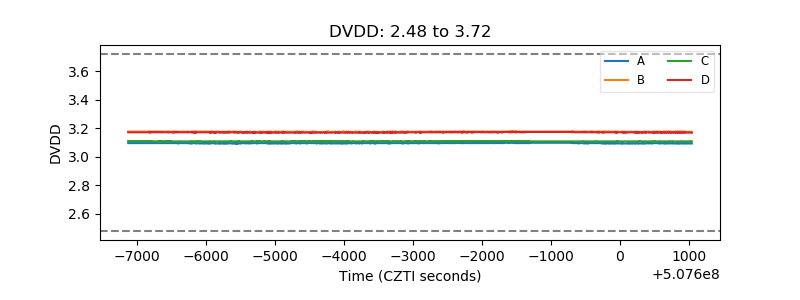 |
| Temperature 1 | 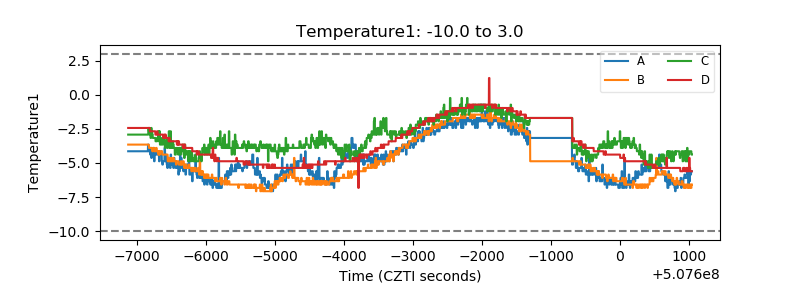 |
| Veto HV Monitor | 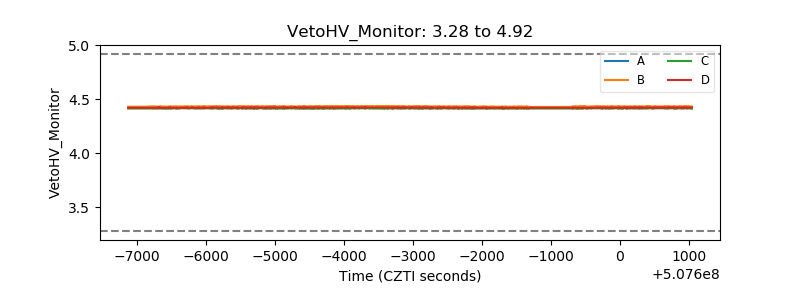 |
| Veto LLD | 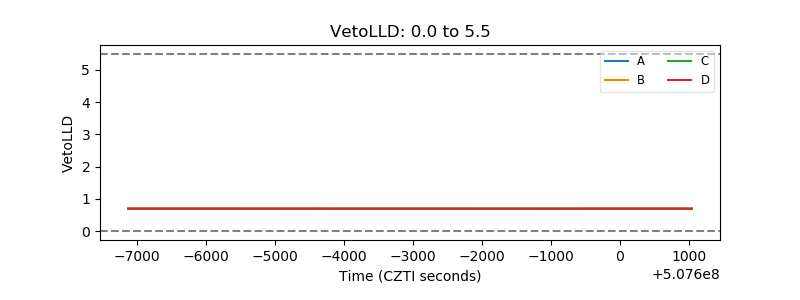 |
| Alpha Counter | 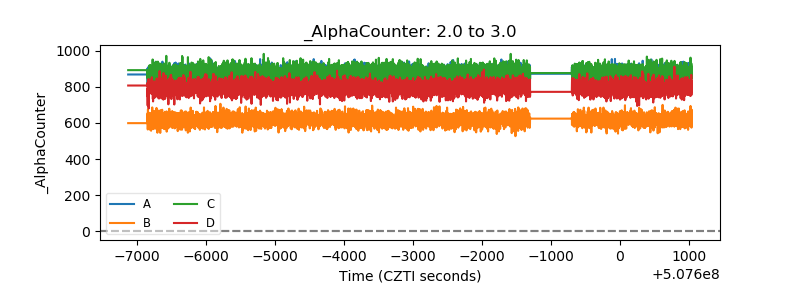 |
| _CPM_Rate | 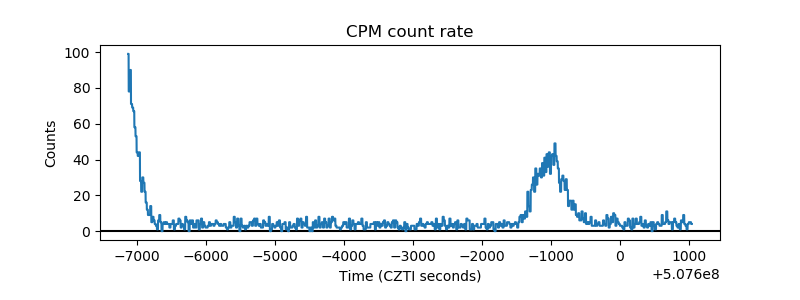 |
| CZT Counter | 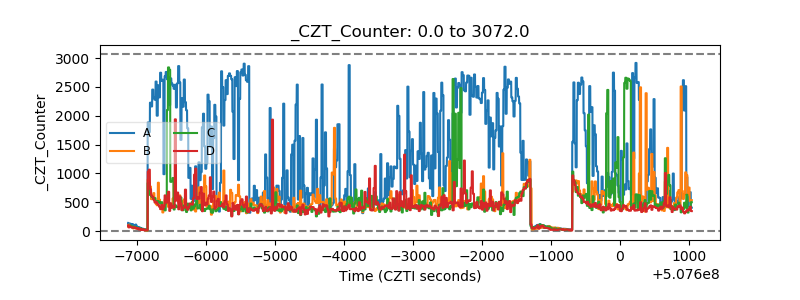 |
| +2.5 Volts monitor |  |
| +5 Volts monitor |  |
| _ROLL_ROT | 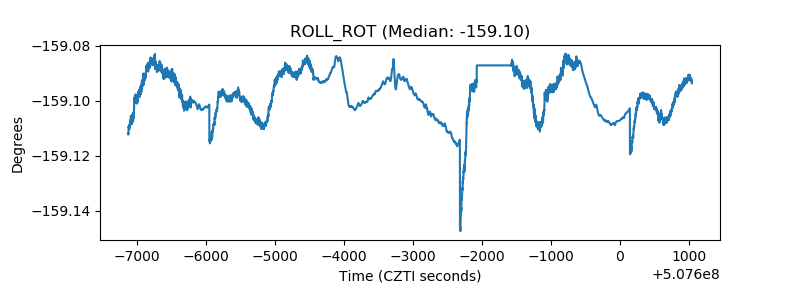 |
| _Roll_DEC | 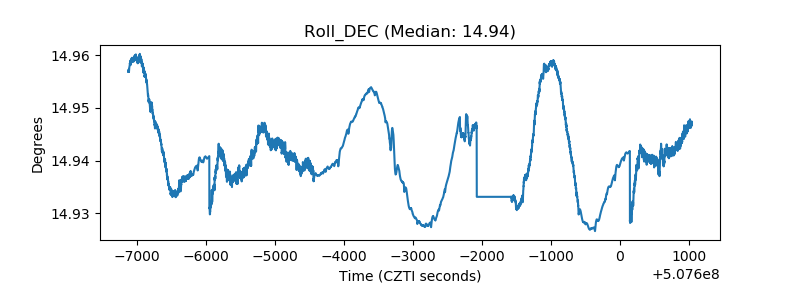 |
| _Roll_RA | 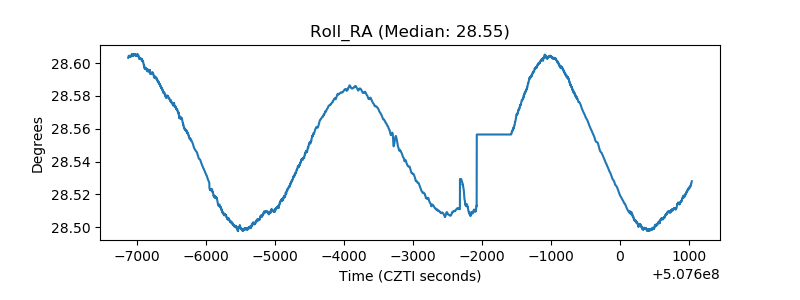 |
| Veto Counter | 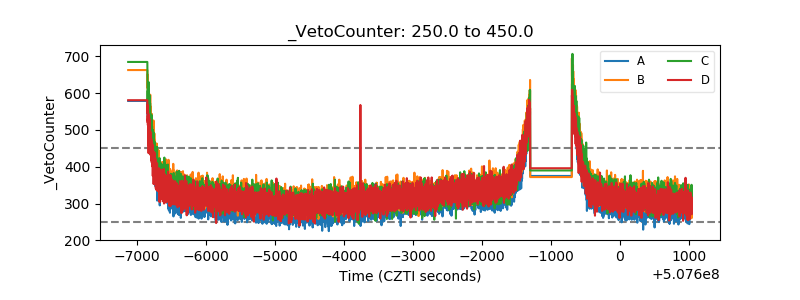 |