| Param | Original file | Final file |
|---|---|---|
| Filename | modeM0/AS1A14_066T02_9000006546_55974cztM0_level2.fits | modeM0/AS1A14_066T02_9000006546_55974cztM0_level2_quad_clean.evt |
| Size (bytes) | 566,706,240 | 106,211,520 |
| Size | 540.5 MB | 101.3 MB |
| Events in quadrant A | 8,312,774 | 660,401 |
| Events in quadrant B | 3,664,658 | 745,219 |
| Events in quadrant C | 4,666,757 | 652,752 |
| Events in quadrant D | 3,744,743 | 628,996 |
| Mode M0 | |||
|---|---|---|---|
| Quadrant | BADHDUFLAG | Total packets | Discarded packets |
| A | 0 | 30025 | 0 |
| B | 0 | 16165 | 0 |
| C | 0 | 19266 | 1 |
| D | 0 | 16869 | 0 |
| Mode SS | |||
|---|---|---|---|
| Quadrant | BADHDUFLAG | Total packets | Discarded packets |
| A | 0 | 152 | 0 |
| B | 0 | 152 | 0 |
| C | 0 | 152 | 0 |
| D | 0 | 152 | 0 |
| Quadrant | Total seconds | Saturated seconds | Saturation percentage |
|---|---|---|---|
| A | 7597 | 504 | 6.634198% |
| B | 7598 | 28 | 0.368518% |
| C | 7597 | 210 | 2.764249% |
| D | 7597 | 84 | 1.105700% |
Noise dominated data is calculated using 1-second bins in cleaned event files. If a bin has >2000 counts, and if more than 50% of those come from <1% of pixels, then it is considered to be noise-dominated and hence unusable.
| Quadrant | # 1 sec bins | Bins with >0 counts | Bins with >2000 counts | High rate bins dominated by noise | Noise dominated (total time) | Noise dominated (detector-on time) | Marked lightcurve |
|---|---|---|---|---|---|---|---|
| A | 7597 | 7597 | 645 | 645 | 8.49% | 8.49% | 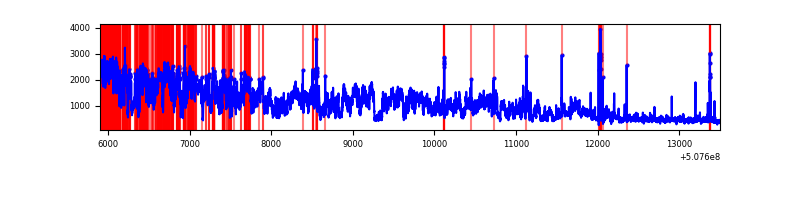 |
| B | 7598 | 7598 | 2 | 2 | 0.03% | 0.03% | 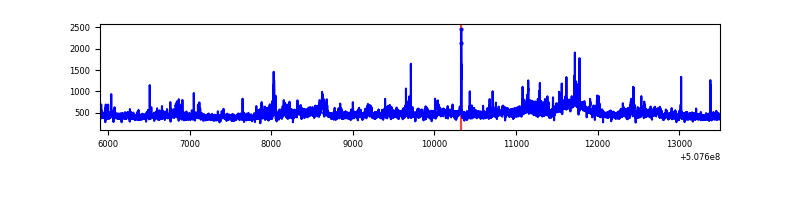 |
| C | 7597 | 7597 | 191 | 191 | 2.51% | 2.51% | 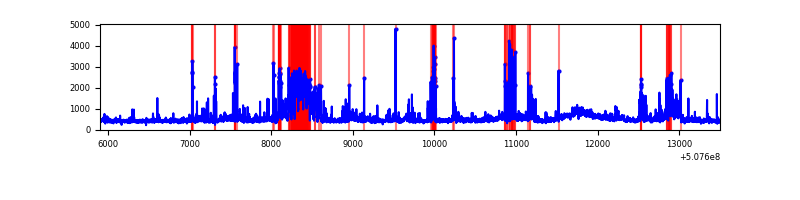 |
| D | 7597 | 7597 | 68 | 68 | 0.90% | 0.90% | 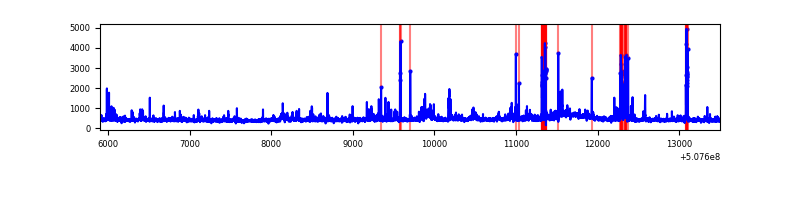 |
Top three noisy pixels from each quadrant. If the there are fewer than three noisy pixels in the level2.evt file, extra rows are filled as -1
| Pixel properties | Quadrant properties | ||||||
|---|---|---|---|---|---|---|---|
| Quadrant | DetID | PixID | Counts | Sigma | Mean | Median | Sigma |
| A | 12 | 115 | 4897481 | 25095.18 | 785 | 763 | 195.1 |
| A | 0 | 8 | 106928 | 544.08 | 785 | 763 | 195.1 |
| A | 7 | 64 | 48810 | 246.24 | 785 | 763 | 195.1 |
| B | 7 | 0 | 256961 | 1474.59 | 796 | 765 | 173.7 |
| B | 0 | 199 | 93081 | 531.34 | 796 | 765 | 173.7 |
| B | 2 | 249 | 90229 | 514.93 | 796 | 765 | 173.7 |
| C | 13 | 3 | 749988 | 3527.58 | 774 | 766 | 212.4 |
| C | 9 | 38 | 408425 | 1919.39 | 774 | 766 | 212.4 |
| C | 15 | 230 | 113199 | 529.37 | 774 | 766 | 212.4 |
| D | 11 | 129 | 176754 | 808.85 | 772 | 740 | 217.6 |
| D | 7 | 96 | 120483 | 550.27 | 772 | 740 | 217.6 |
| D | 2 | 249 | 115731 | 528.43 | 772 | 740 | 217.6 |
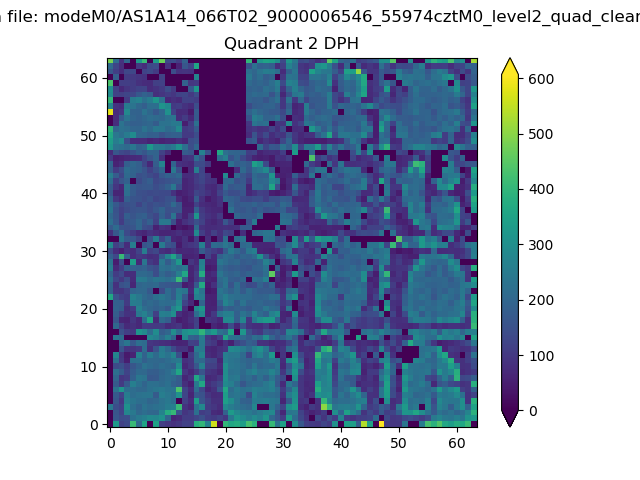
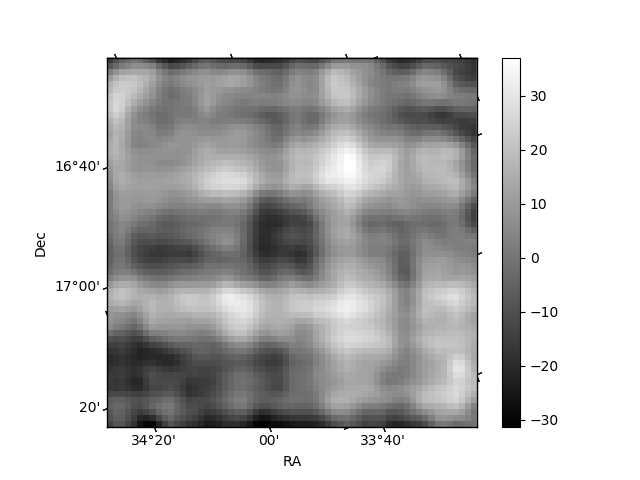
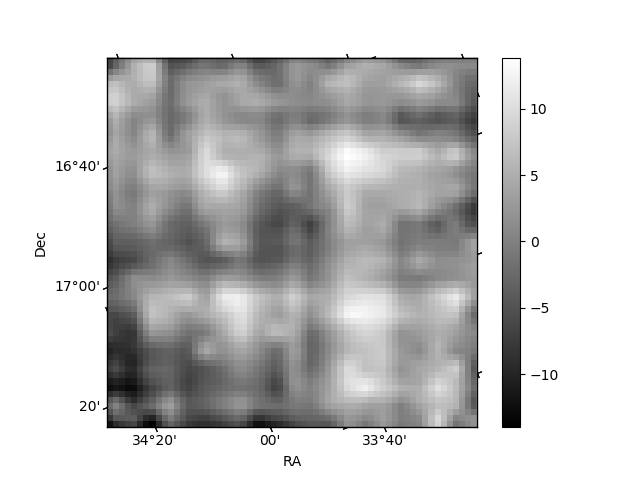
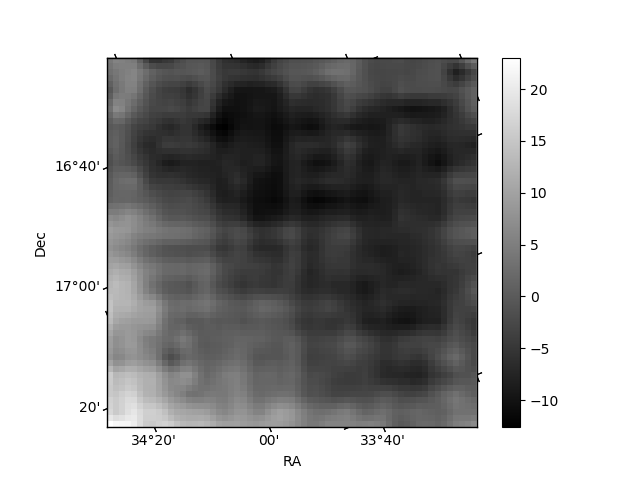
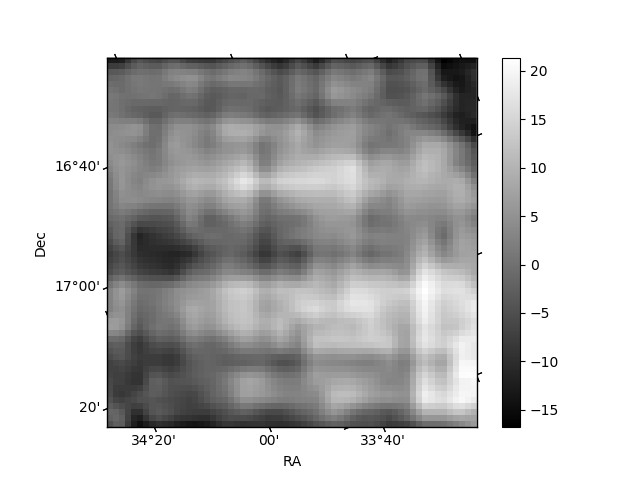
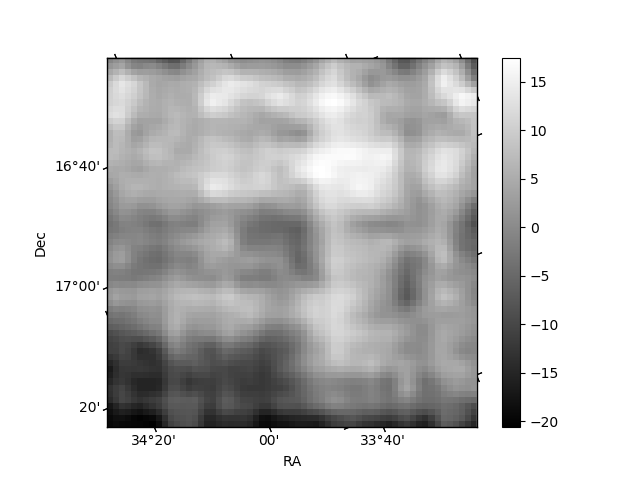
Histogram calculated using DETX and DETY for each event in the final _common_clean file
| Quadrant A | 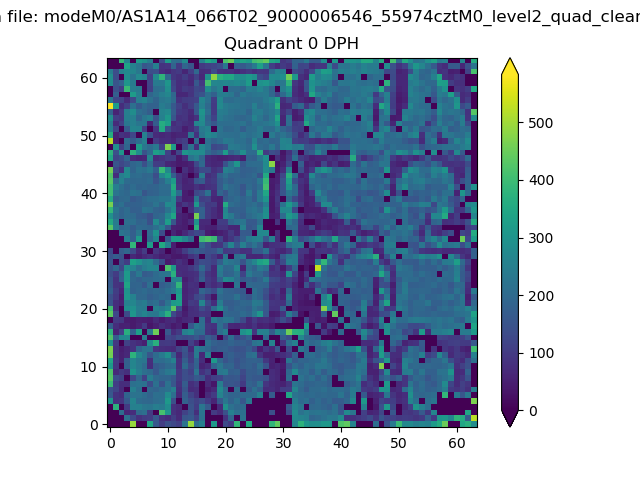 |
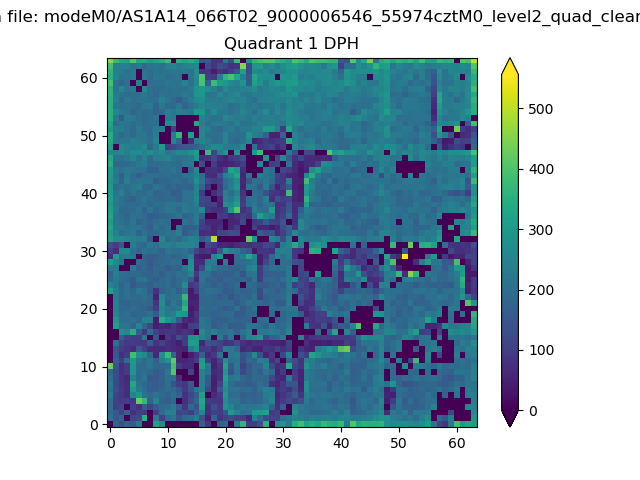 |
Quadrant B |
|---|---|---|---|
| Quadrant D | 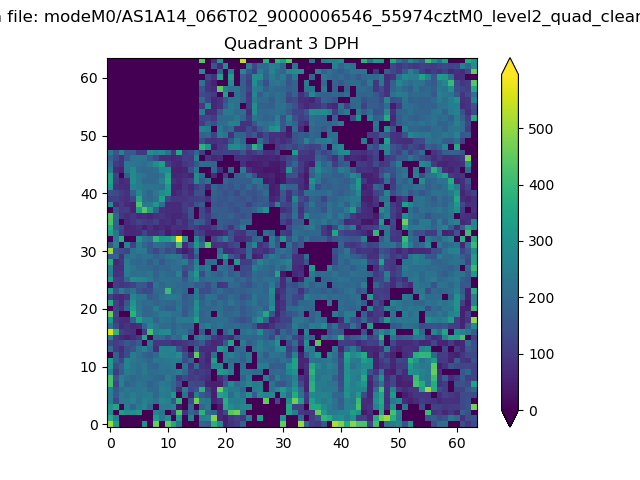 |
 |
Quadrant C |
| Plot type | Count rate plots | Images |
|---|---|---|
| Comparison with Poisson distribution Blue bars denote a histogram of data divided into 1 sec bins. Red curve is a Poisson curve with rate = median count rate of data. |
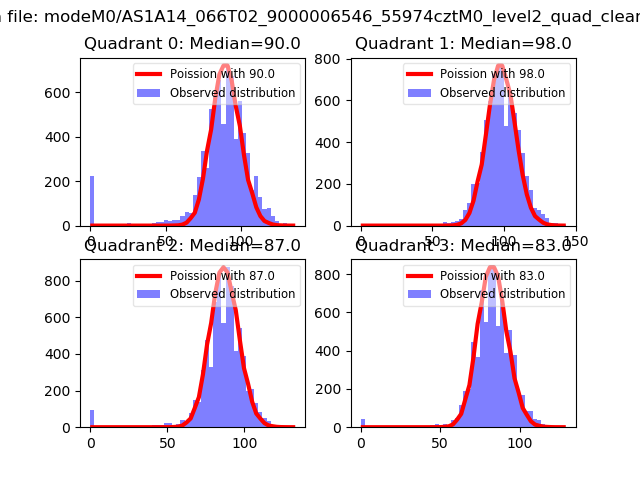 |
 |
| Quadrant-wise count rates Data is divided into 100 sec bins |
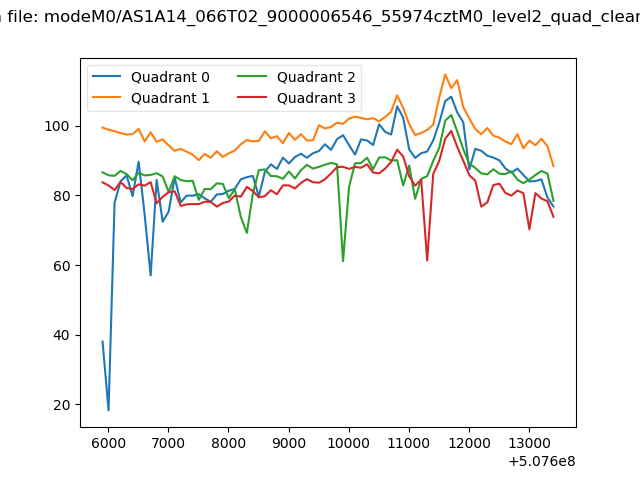 |
|
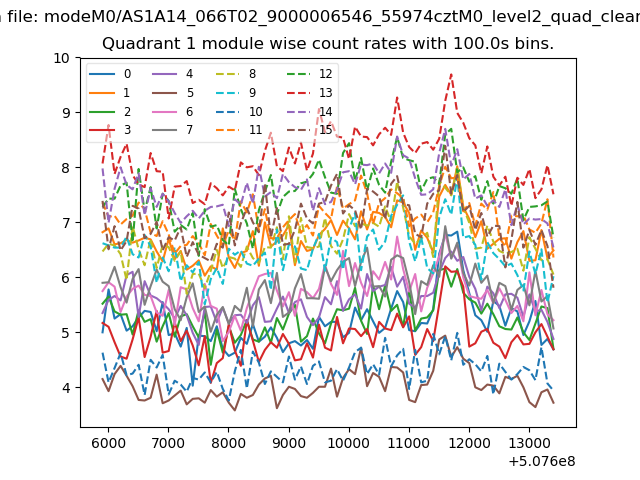
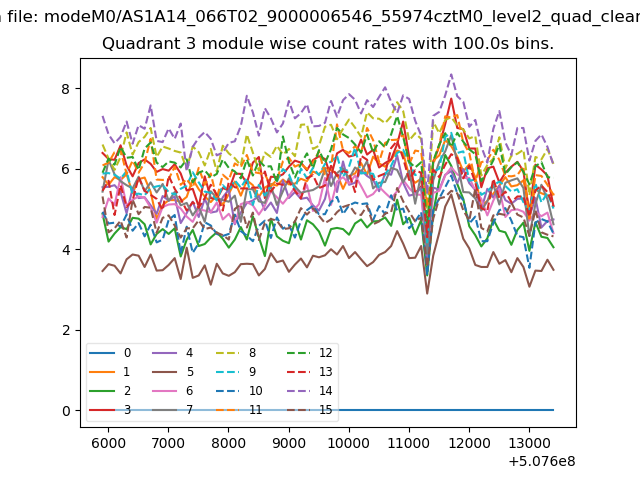
| Module-wise count rates for Quadrant A Data is divided into 100 sec bins |
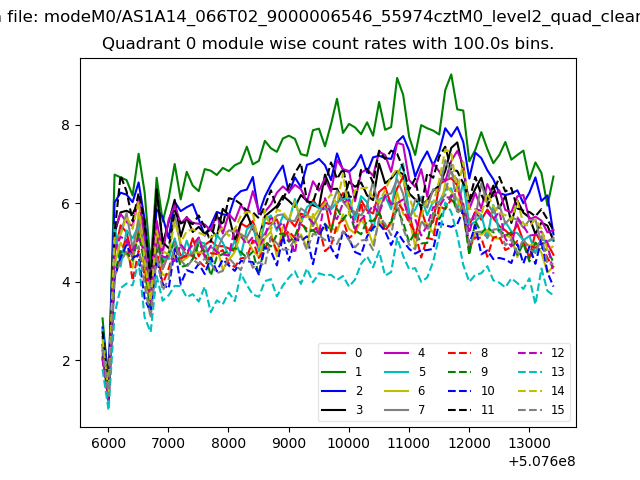 |
 |
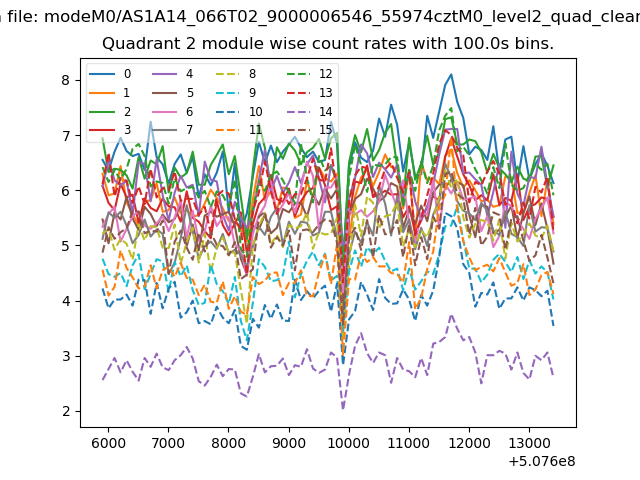
| Module-wise count rates for Quadrant B Data is divided into 100 sec bins |
 |
 |
| Module-wise count rates for Quadrant C Data is divided into 100 sec bins |
 |
 |
| Module-wise count rates for Quadrant D Data is divided into 100 sec bins |
 |
 |
| Parameter | Plot |
|---|---|
| CZT HV Monitor |  |
| D_VDD | 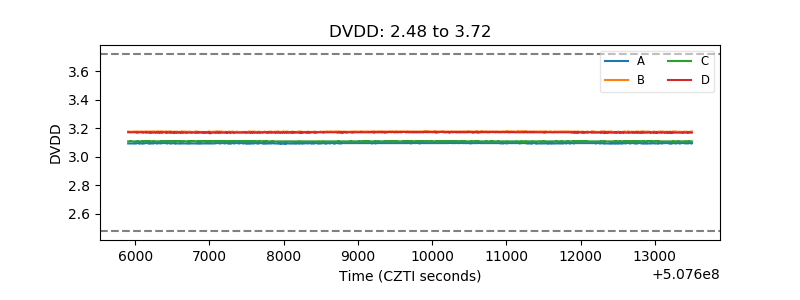 |
| Temperature 1 | 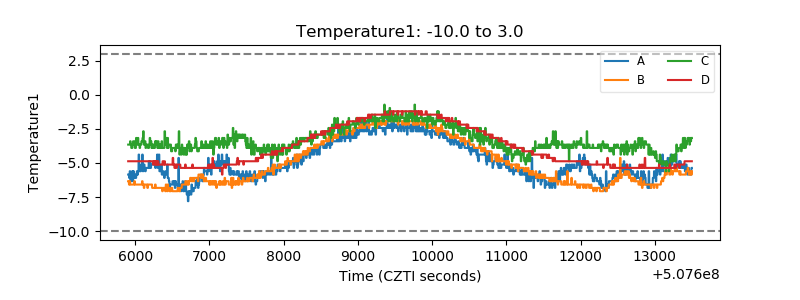 |
| Veto HV Monitor | 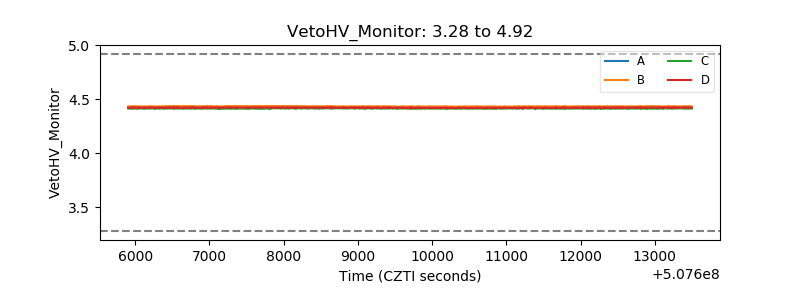 |
| Veto LLD | 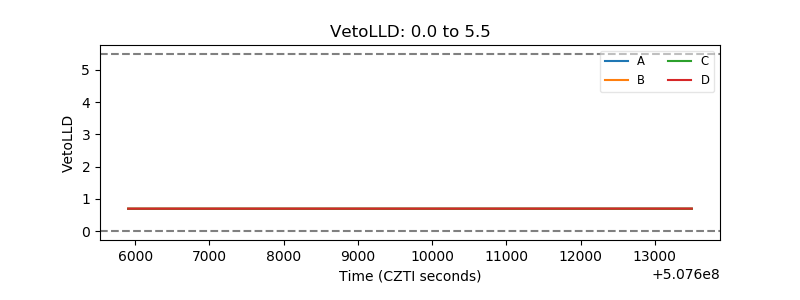 |
| Alpha Counter | 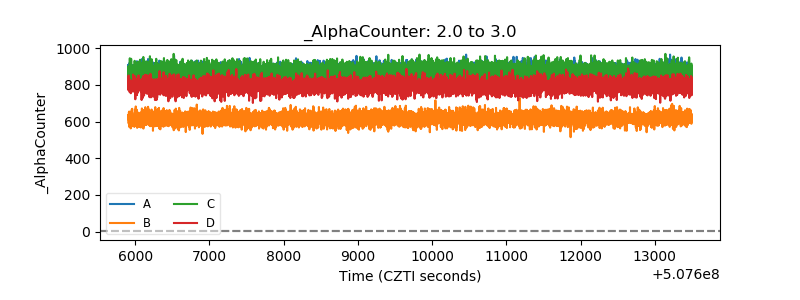 |
| _CPM_Rate | 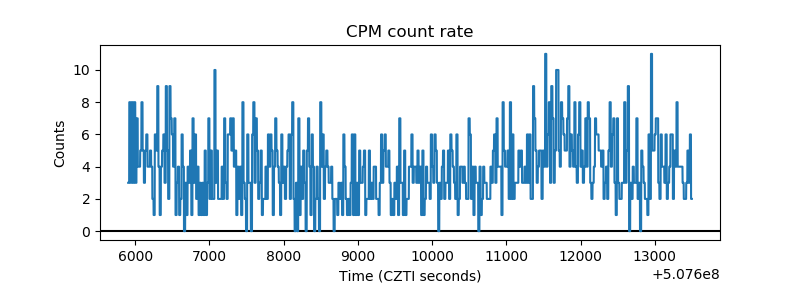 |
| CZT Counter | 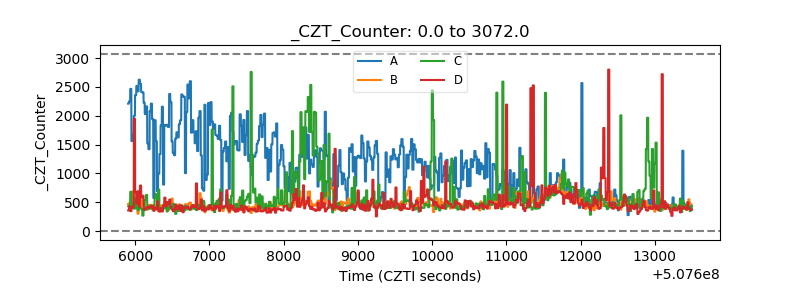 |
| +2.5 Volts monitor |  |
| +5 Volts monitor |  |
| _ROLL_ROT | 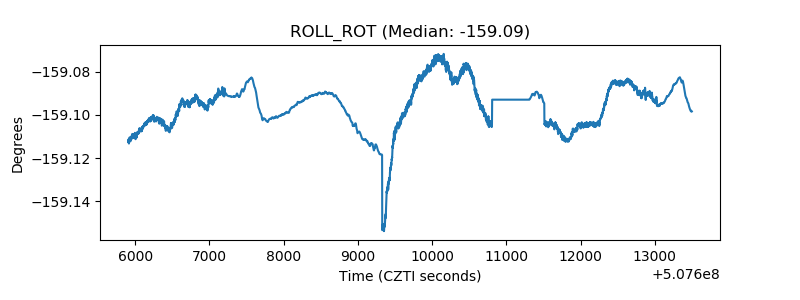 |
| _Roll_DEC | 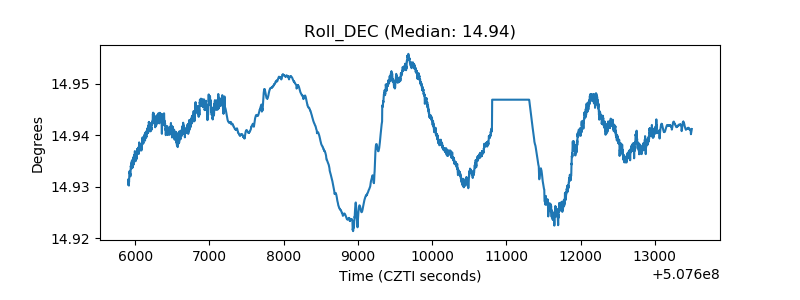 |
| _Roll_RA | 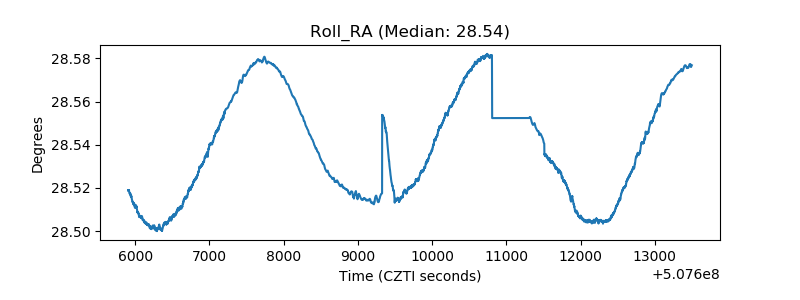 |
| Veto Counter | 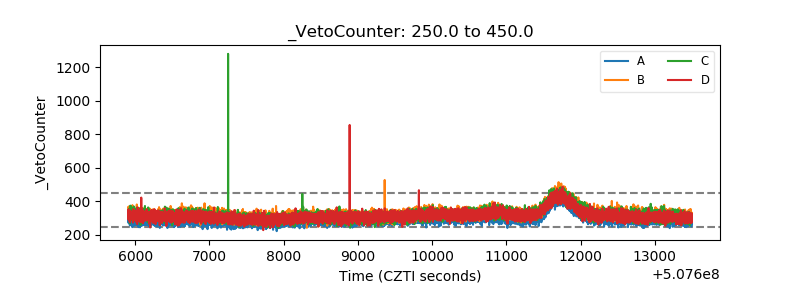 |