| Param | Original file | Final file |
|---|---|---|
| Filename | modeM0/AS1A14_066T02_9000006546_55975cztM0_level2.fits | modeM0/AS1A14_066T02_9000006546_55975cztM0_level2_quad_clean.evt |
| Size (bytes) | 567,092,160 | 119,753,280 |
| Size | 540.8 MB | 114.2 MB |
| Events in quadrant A | 5,377,547 | 766,633 |
| Events in quadrant B | 4,190,390 | 844,193 |
| Events in quadrant C | 4,573,466 | 750,778 |
| Events in quadrant D | 6,188,786 | 672,541 |
| Mode M0 | |||
|---|---|---|---|
| Quadrant | BADHDUFLAG | Total packets | Discarded packets |
| A | 0 | 21868 | 0 |
| B | 0 | 18471 | 0 |
| C | 0 | 20004 | 0 |
| D | 0 | 24643 | 0 |
| Mode SS | |||
|---|---|---|---|
| Quadrant | BADHDUFLAG | Total packets | Discarded packets |
| A | 0 | 170 | 0 |
| B | 0 | 170 | 0 |
| C | 0 | 170 | 0 |
| D | 0 | 170 | 0 |
| Quadrant | Total seconds | Saturated seconds | Saturation percentage |
|---|---|---|---|
| A | 8520 | 317 | 3.720657% |
| B | 8521 | 107 | 1.255721% |
| C | 8521 | 137 | 1.607793% |
| D | 8521 | 650 | 7.628213% |
Noise dominated data is calculated using 1-second bins in cleaned event files. If a bin has >2000 counts, and if more than 50% of those come from <1% of pixels, then it is considered to be noise-dominated and hence unusable.
| Quadrant | # 1 sec bins | Bins with >0 counts | Bins with >2000 counts | High rate bins dominated by noise | Noise dominated (total time) | Noise dominated (detector-on time) | Marked lightcurve |
|---|---|---|---|---|---|---|---|
| A | 8520 | 8520 | 277 | 277 | 3.25% | 3.25% | 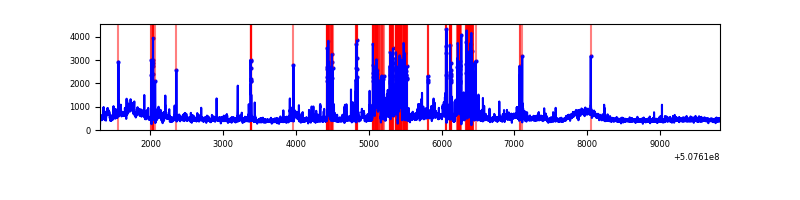 |
| B | 8521 | 8521 | 12 | 12 | 0.14% | 0.14% | 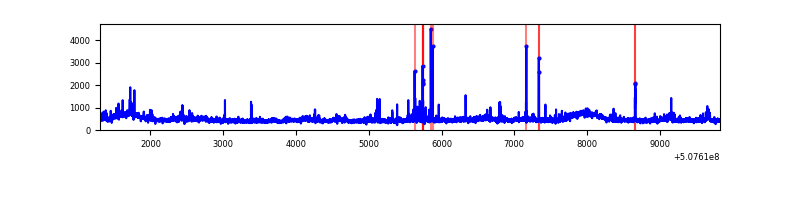 |
| C | 8521 | 8521 | 95 | 95 | 1.11% | 1.11% | 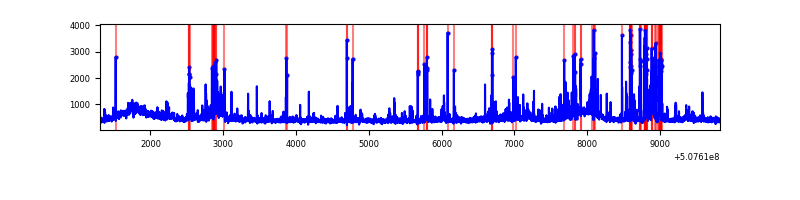 |
| D | 8521 | 8521 | 546 | 546 | 6.41% | 6.41% | 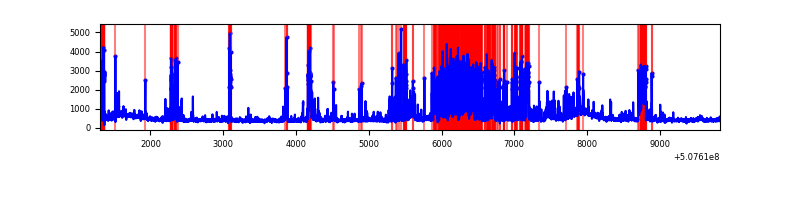 |
Top three noisy pixels from each quadrant. If the there are fewer than three noisy pixels in the level2.evt file, extra rows are filled as -1
| Pixel properties | Quadrant properties | ||||||
|---|---|---|---|---|---|---|---|
| Quadrant | DetID | PixID | Counts | Sigma | Mean | Median | Sigma |
| A | 7 | 64 | 911211 | 4037.03 | 916 | 890 | 225.5 |
| A | 12 | 115 | 324086 | 1433.29 | 916 | 890 | 225.5 |
| A | 0 | 8 | 262931 | 1162.08 | 916 | 890 | 225.5 |
| B | 7 | 0 | 164434 | 814.42 | 923 | 886 | 200.8 |
| B | 2 | 249 | 148755 | 736.35 | 923 | 886 | 200.8 |
| B | 0 | 199 | 67913 | 333.78 | 923 | 886 | 200.8 |
| C | 9 | 38 | 404422 | 1636.55 | 905 | 897 | 246.6 |
| C | 15 | 199 | 230447 | 930.97 | 905 | 897 | 246.6 |
| C | 13 | 3 | 167041 | 673.82 | 905 | 897 | 246.6 |
| D | 2 | 249 | 1592108 | 6474.91 | 877 | 841 | 245.8 |
| D | 11 | 129 | 590628 | 2399.86 | 877 | 841 | 245.8 |
| D | 7 | 96 | 202367 | 820.01 | 877 | 841 | 245.8 |
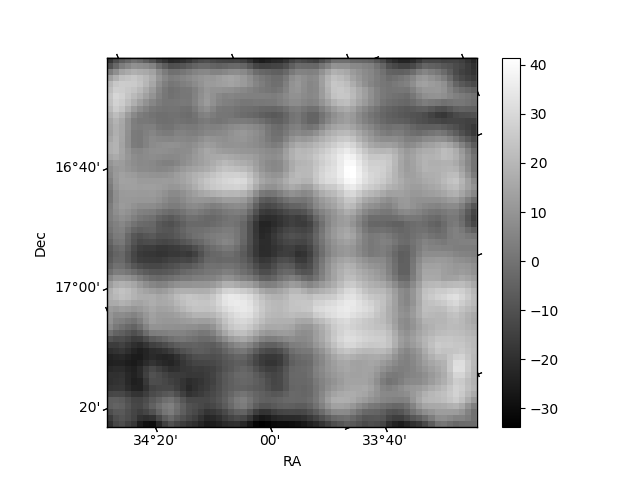
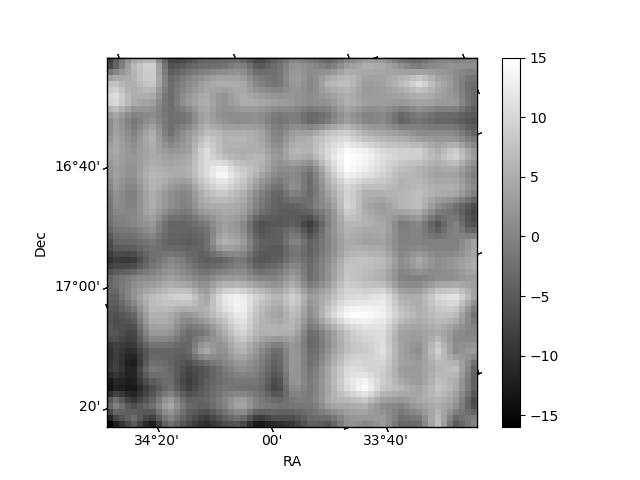
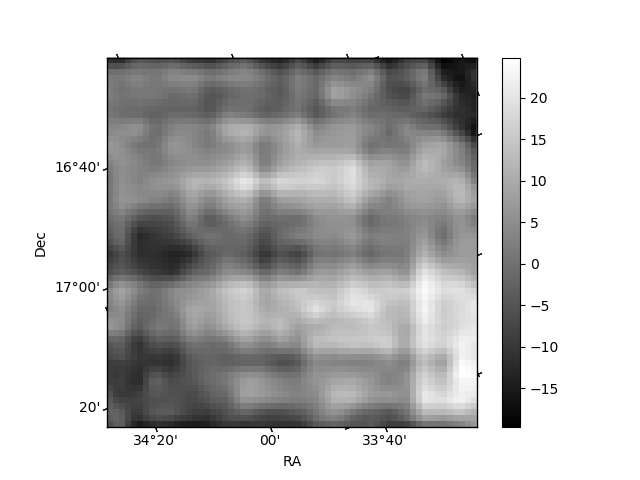
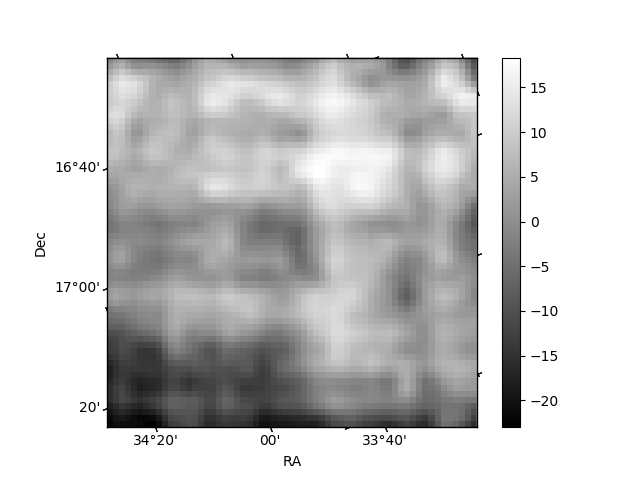
Histogram calculated using DETX and DETY for each event in the final _common_clean file
| Quadrant A | 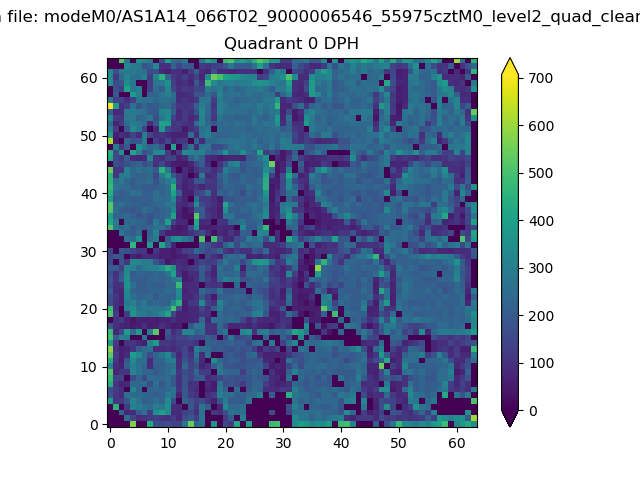 |
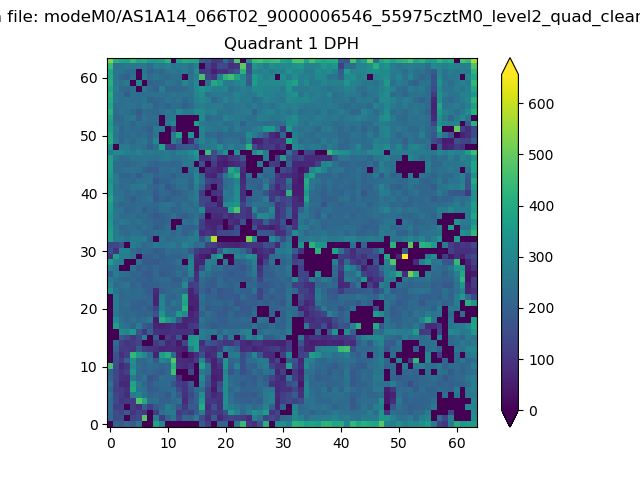 |
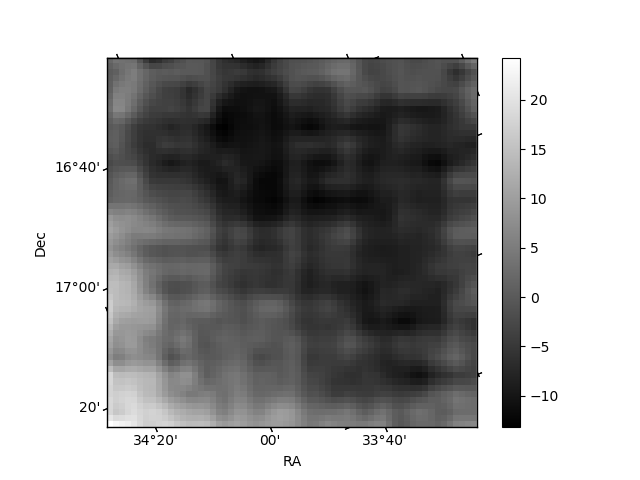
Quadrant B |
|---|---|---|---|
| Quadrant D | 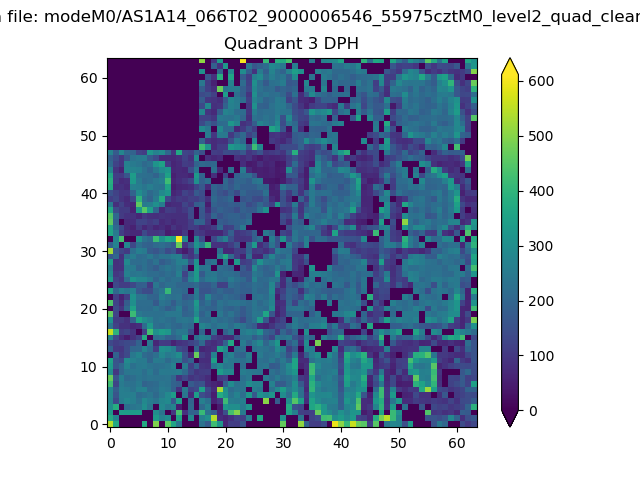 |
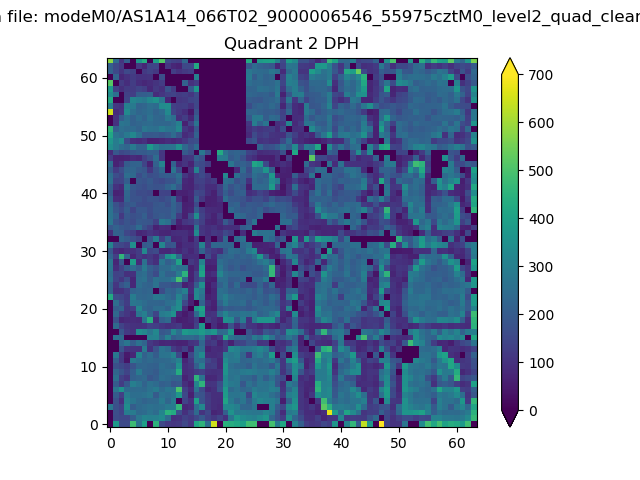 |
Quadrant C |
| Plot type | Count rate plots | Images |
|---|---|---|
| Comparison with Poisson distribution Blue bars denote a histogram of data divided into 1 sec bins. Red curve is a Poisson curve with rate = median count rate of data. |
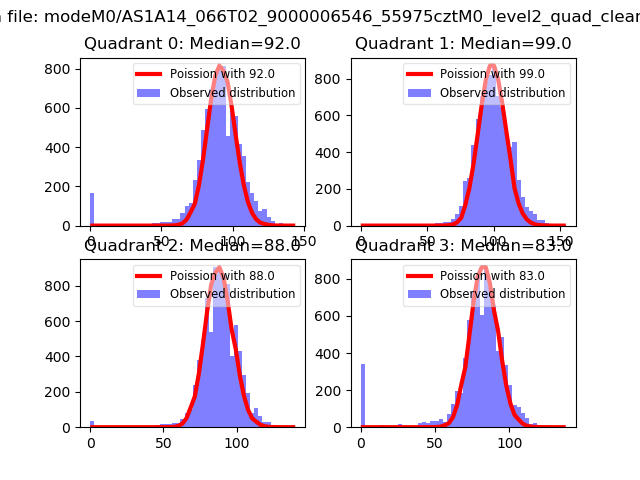 |
 |
| Quadrant-wise count rates Data is divided into 100 sec bins |
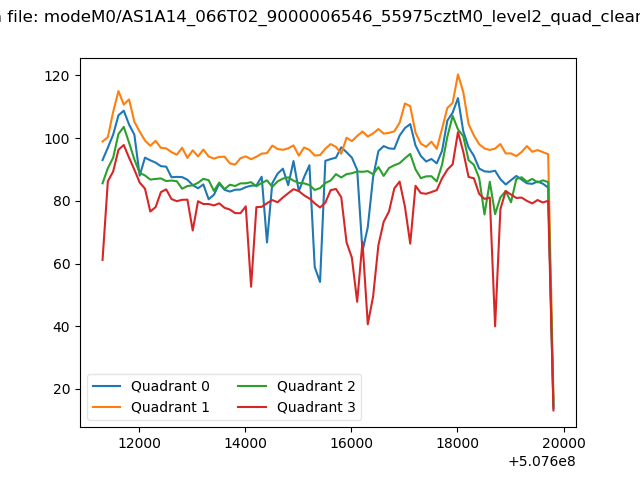 |
|
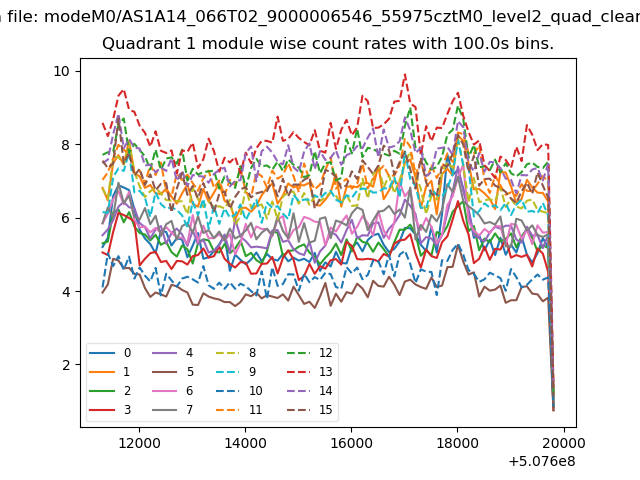
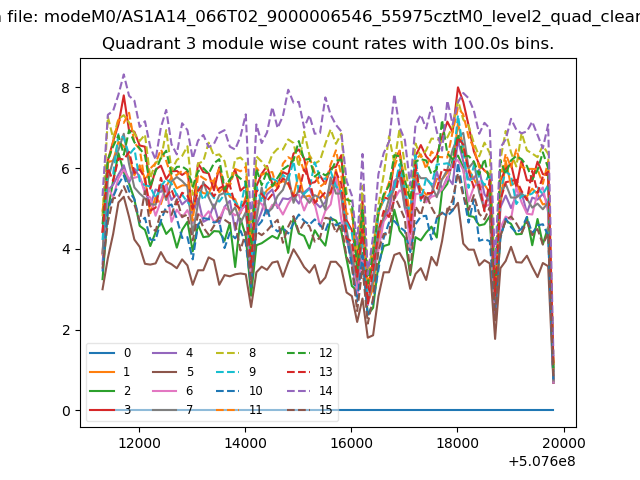
| Module-wise count rates for Quadrant A Data is divided into 100 sec bins |
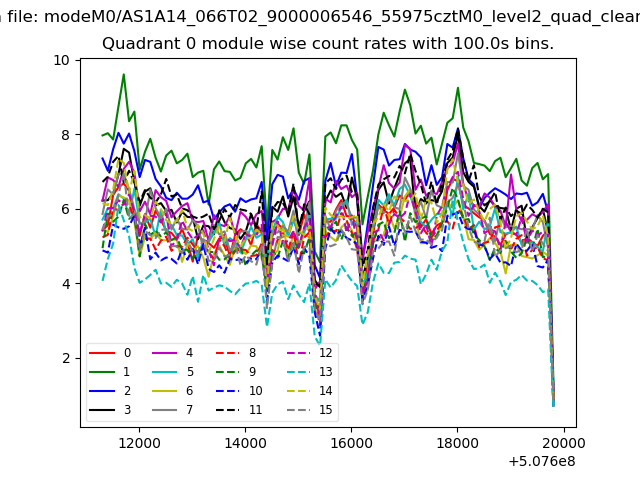 |
 |
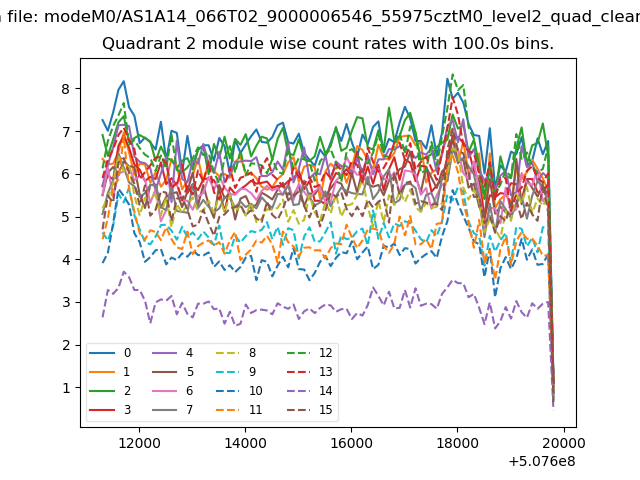
| Module-wise count rates for Quadrant B Data is divided into 100 sec bins |
 |
 |
| Module-wise count rates for Quadrant C Data is divided into 100 sec bins |
 |
 |
| Module-wise count rates for Quadrant D Data is divided into 100 sec bins |
 |
 |
| Parameter | Plot |
|---|---|
| CZT HV Monitor | 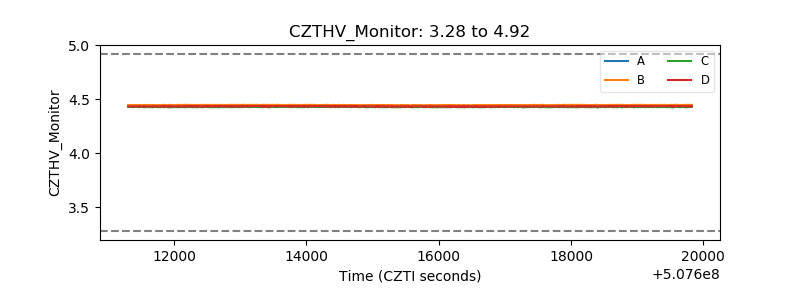 |
| D_VDD | 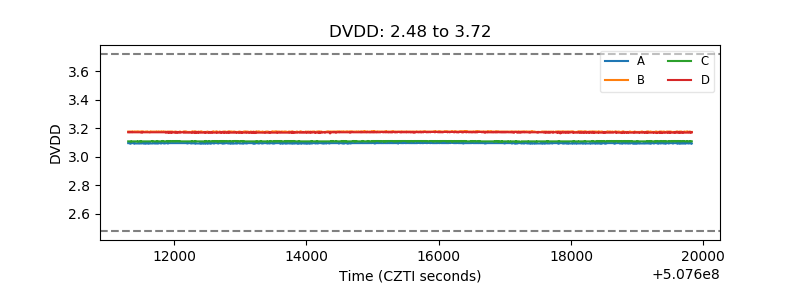 |
| Temperature 1 | 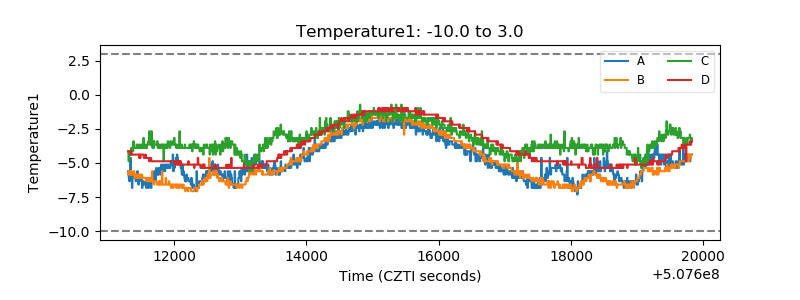 |
| Veto HV Monitor | 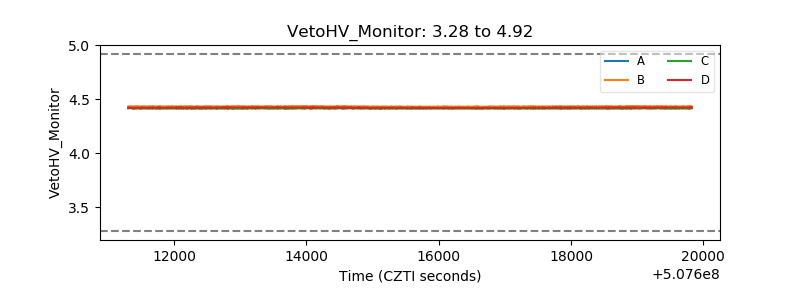 |
| Veto LLD | 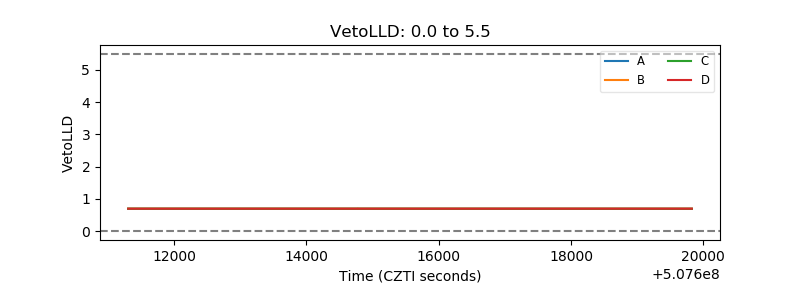 |
| Alpha Counter | 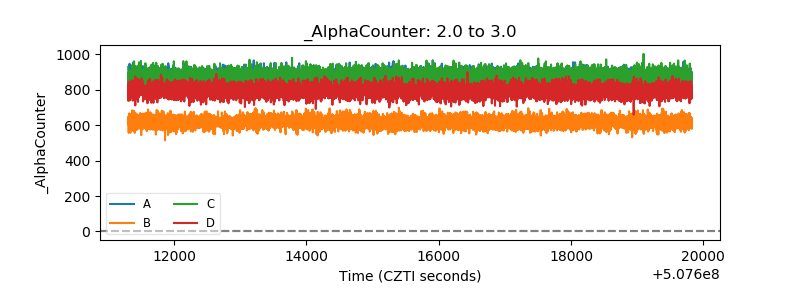 |
| _CPM_Rate | 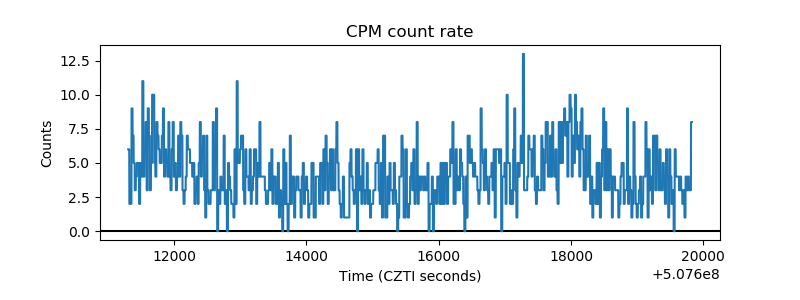 |
| CZT Counter | 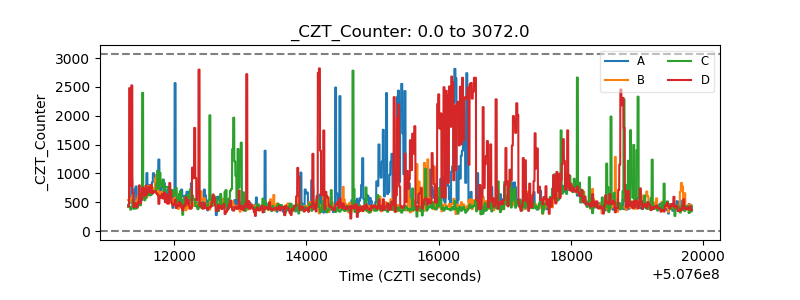 |
| +2.5 Volts monitor |  |
| +5 Volts monitor | 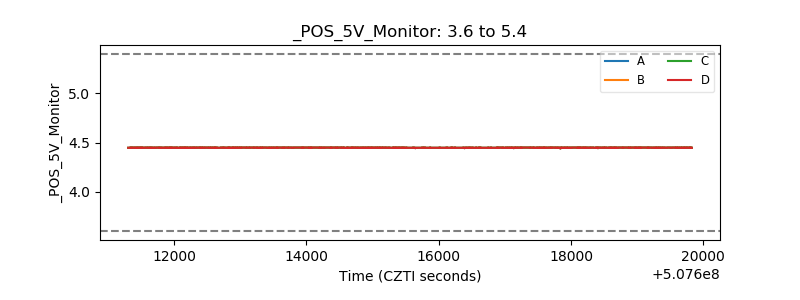 |
| _ROLL_ROT | 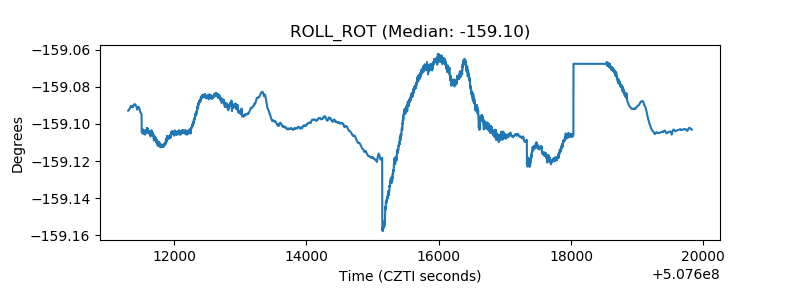 |
| _Roll_DEC | 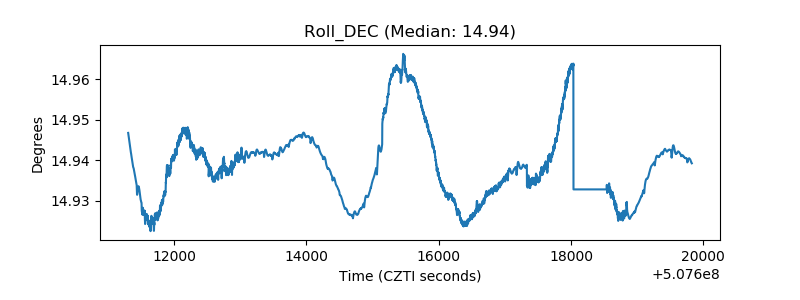 |
| _Roll_RA | 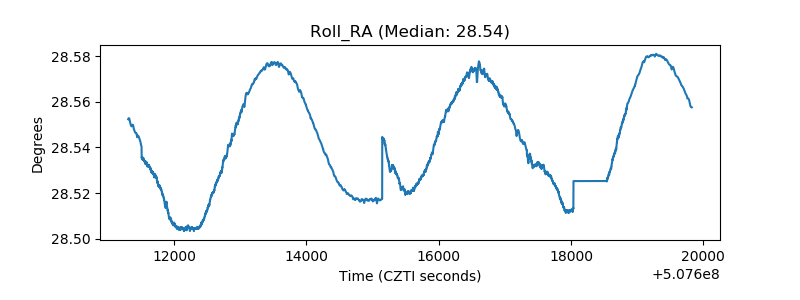 |
| Veto Counter | 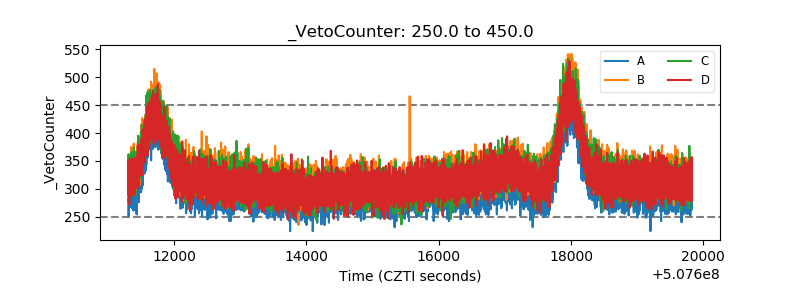 |