| Param | Original file | Final file |
|---|---|---|
| Filename | modeM0/AS1A14_066T02_9000006546_55978cztM0_level2.fits | modeM0/AS1A14_066T02_9000006546_55978cztM0_level2_quad_clean.evt |
| Size (bytes) | 1,290,608,640 | 255,248,640 |
| Size | 1.2 GB | 243.4 MB |
| Events in quadrant A | 14,045,713 | 1,609,116 |
| Events in quadrant B | 8,973,286 | 1,802,793 |
| Events in quadrant C | 9,230,552 | 1,598,329 |
| Events in quadrant D | 14,080,264 | 1,431,598 |
| Mode M9 | |||
|---|---|---|---|
| Quadrant | BADHDUFLAG | Total packets | Discarded packets |
| A | 0 | 13 | 0 |
| B | 0 | 13 | 0 |
| C | 0 | 13 | 0 |
| D | 0 | 13 | 0 |
| Mode M0 | |||
|---|---|---|---|
| Quadrant | BADHDUFLAG | Total packets | Discarded packets |
| A | 0 | 54778 | 4 |
| B | 0 | 40220 | 4 |
| C | 0 | 41924 | 4 |
| D | 0 | 54940 | 4 |
| Mode SS | |||
|---|---|---|---|
| Quadrant | BADHDUFLAG | Total packets | Discarded packets |
| A | 0 | 380 | 0 |
| B | 0 | 380 | 0 |
| C | 0 | 380 | 0 |
| D | 0 | 380 | 0 |
| Quadrant | Total seconds | Saturated seconds | Saturation percentage |
|---|---|---|---|
| A | 18660 | 1418 | 7.599143% |
| B | 18660 | 427 | 2.288317% |
| C | 18661 | 487 | 2.609721% |
| D | 18661 | 1320 | 7.073576% |
Noise dominated data is calculated using 1-second bins in cleaned event files. If a bin has >2000 counts, and if more than 50% of those come from <1% of pixels, then it is considered to be noise-dominated and hence unusable.
| Quadrant | # 1 sec bins | Bins with >0 counts | Bins with >2000 counts | High rate bins dominated by noise | Noise dominated (total time) | Noise dominated (detector-on time) | Marked lightcurve |
|---|---|---|---|---|---|---|---|
| A | 20000 | 18663 | 957 | 957 | 4.79% | 5.13% | 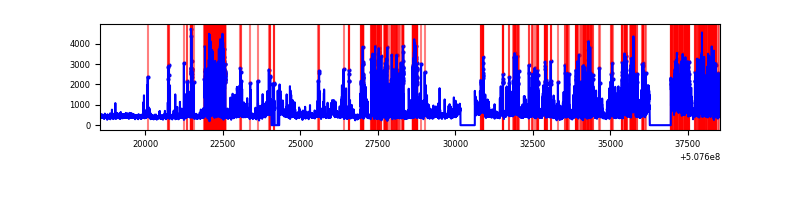 |
| B | 20000 | 18663 | 35 | 35 | 0.17% | 0.19% | 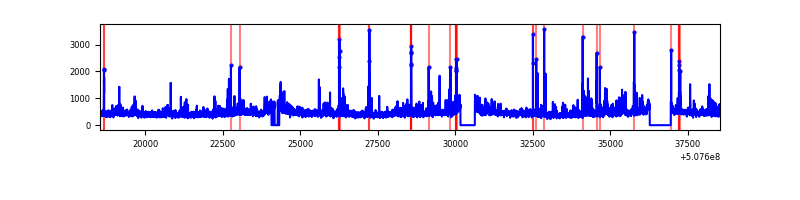 |
| C | 20001 | 18666 | 276 | 276 | 1.38% | 1.48% | 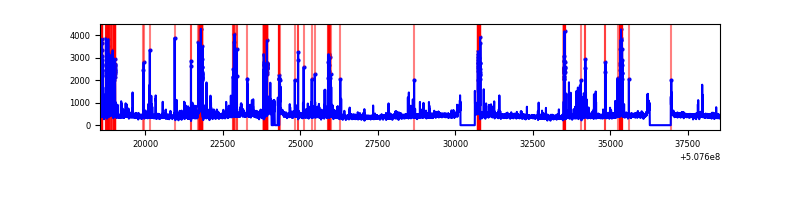 |
| D | 20001 | 18665 | 1042 | 1042 | 5.21% | 5.58% | 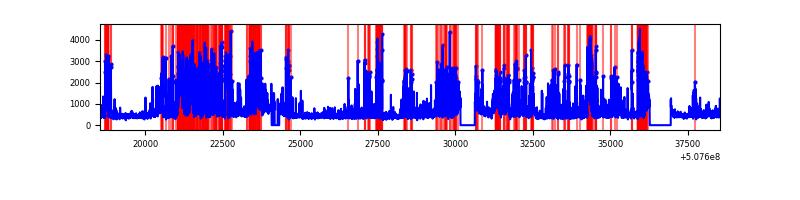 |
Top three noisy pixels from each quadrant. If the there are fewer than three noisy pixels in the level2.evt file, extra rows are filled as -1
| Pixel properties | Quadrant properties | ||||||
|---|---|---|---|---|---|---|---|
| Quadrant | DetID | PixID | Counts | Sigma | Mean | Median | Sigma |
| A | 4 | 249 | 3140176 | 6596.94 | 1935 | 1885 | 475.7 |
| A | 7 | 64 | 1380708 | 2898.4 | 1935 | 1885 | 475.7 |
| A | 0 | 8 | 1132892 | 2377.47 | 1935 | 1885 | 475.7 |
| B | 2 | 249 | 436646 | 1048.97 | 1952 | 1878 | 414.5 |
| B | 0 | 199 | 318074 | 762.89 | 1952 | 1878 | 414.5 |
| B | 0 | 213 | 196509 | 469.59 | 1952 | 1878 | 414.5 |
| C | 9 | 38 | 462622 | 883.96 | 1912 | 1895 | 521.2 |
| C | 13 | 3 | 379850 | 725.15 | 1912 | 1895 | 521.2 |
| C | 2 | 12 | 326444 | 622.68 | 1912 | 1895 | 521.2 |
| D | 11 | 129 | 2224622 | 4171.54 | 1886 | 1800 | 532.9 |
| D | 2 | 249 | 1347684 | 2525.8 | 1886 | 1800 | 532.9 |
| D | 6 | 42 | 865223 | 1620.37 | 1886 | 1800 | 532.9 |
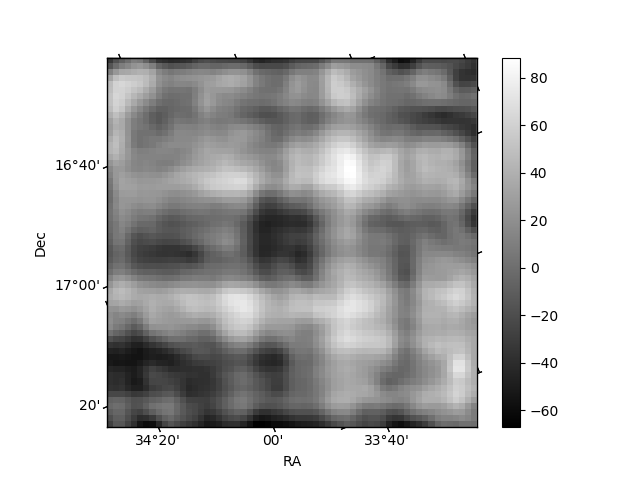
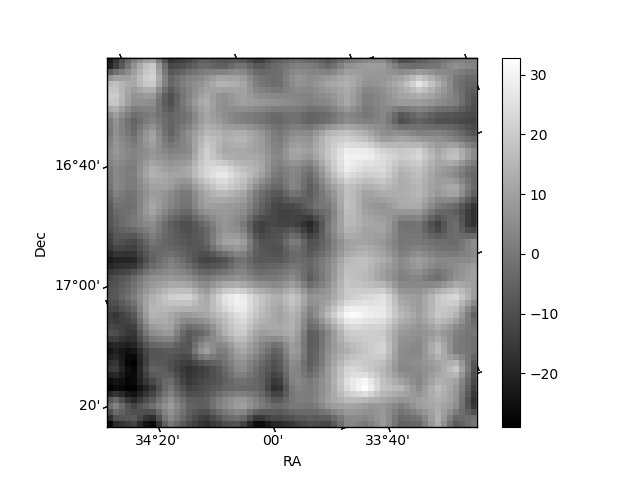
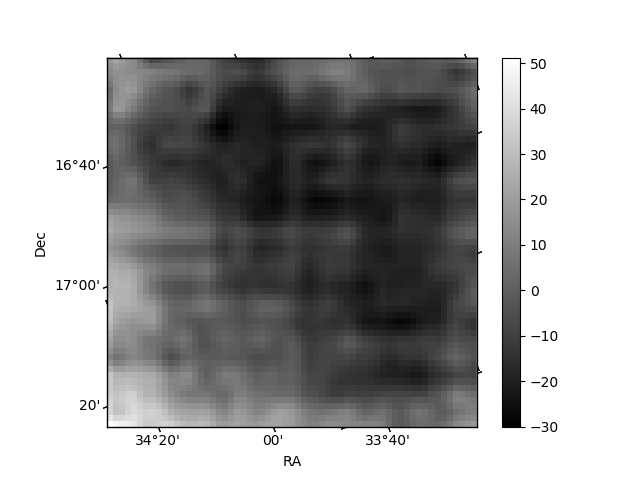
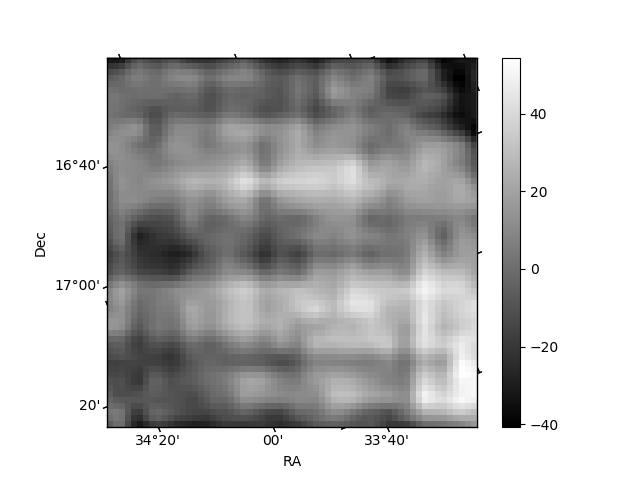
Histogram calculated using DETX and DETY for each event in the final _common_clean file
| Quadrant A | 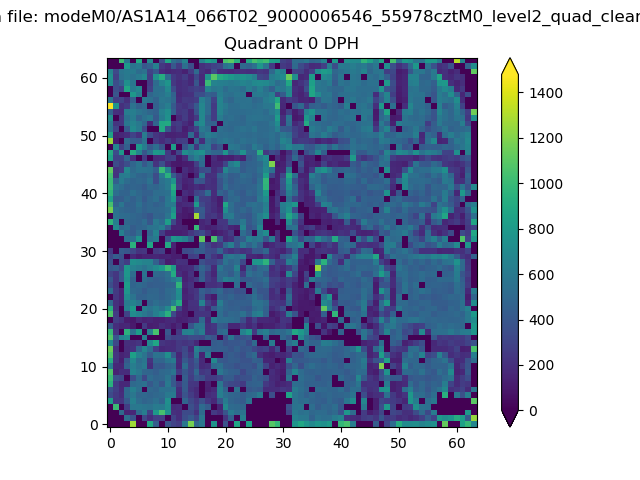 |
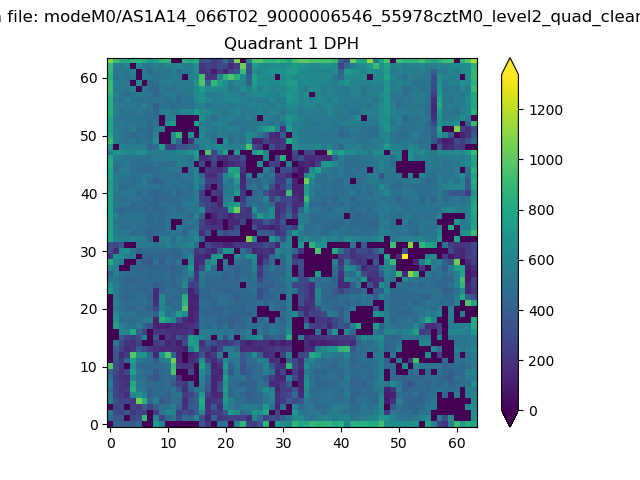 |
Quadrant B |
|---|---|---|---|
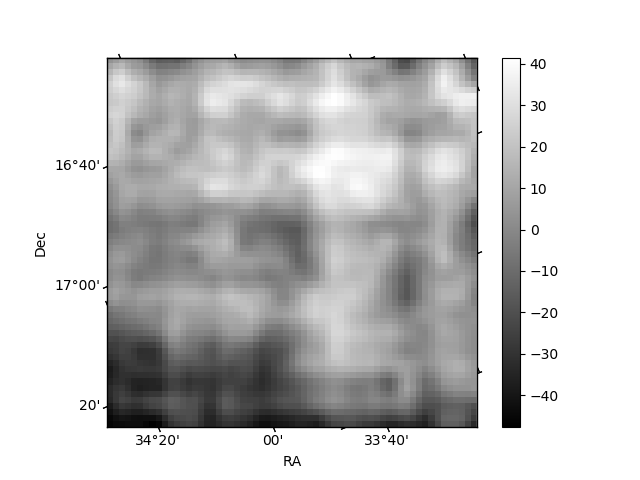
| Quadrant D | 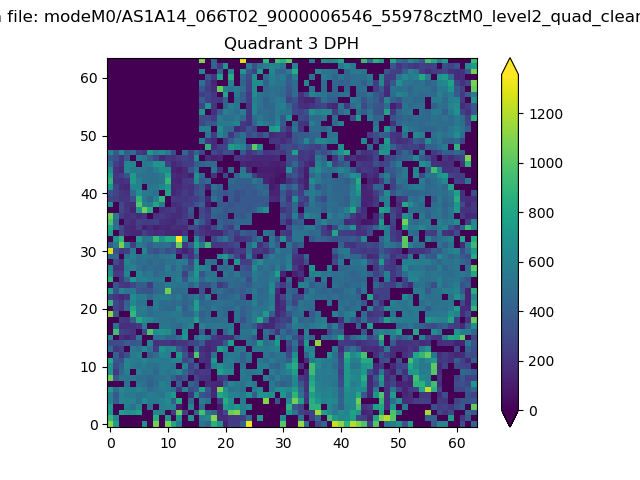 |
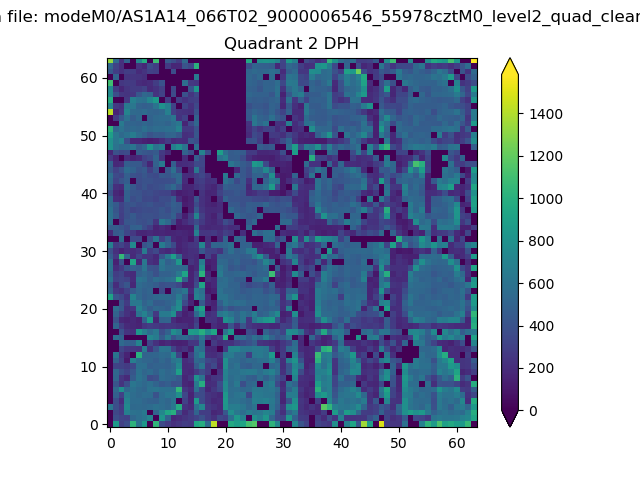 |
Quadrant C |
| Plot type | Count rate plots | Images |
|---|---|---|
| Comparison with Poisson distribution Blue bars denote a histogram of data divided into 1 sec bins. Red curve is a Poisson curve with rate = median count rate of data. |
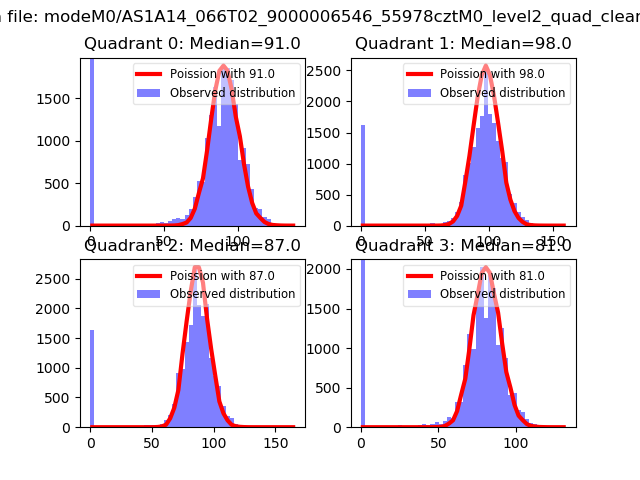 |
 |
| Quadrant-wise count rates Data is divided into 100 sec bins |
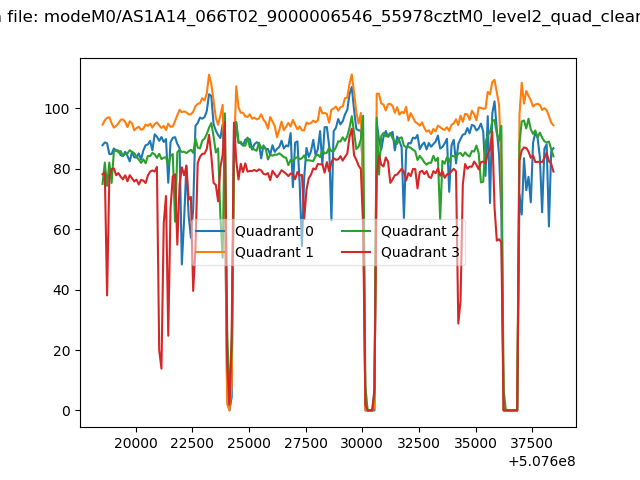 |
|
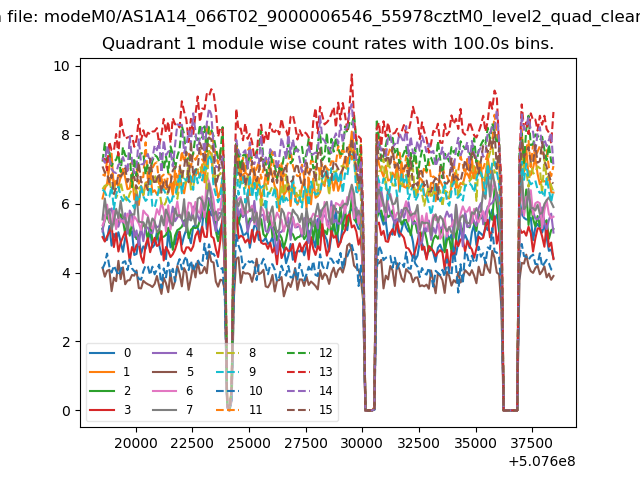
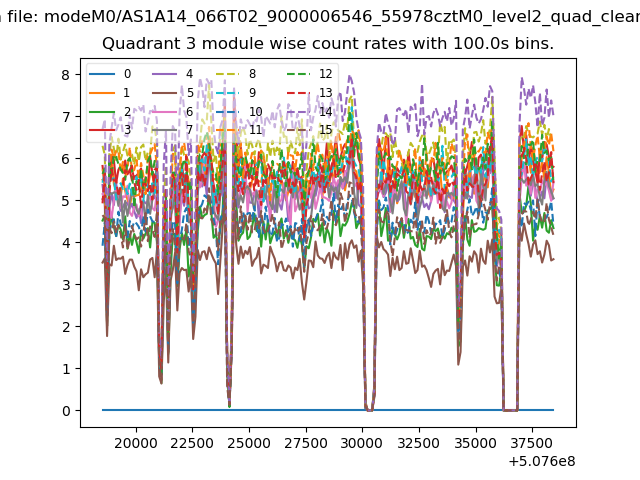
| Module-wise count rates for Quadrant A Data is divided into 100 sec bins |
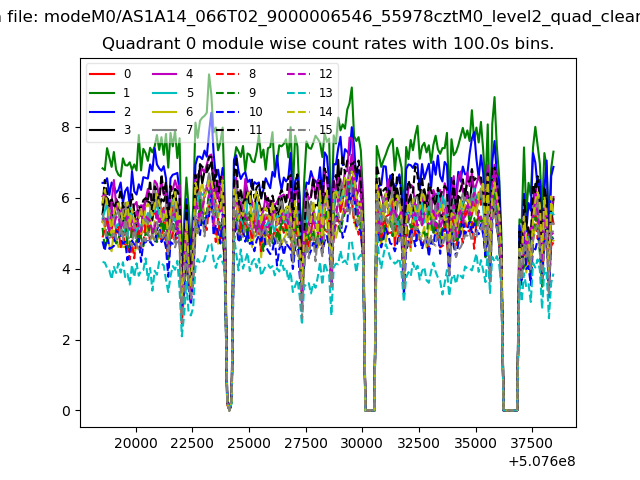 |
 |
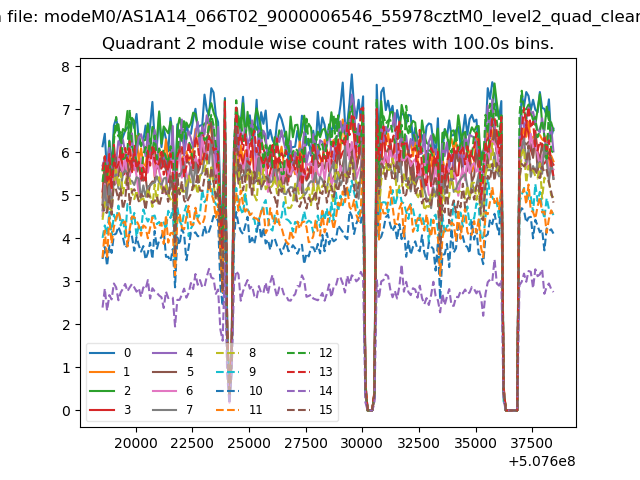
| Module-wise count rates for Quadrant B Data is divided into 100 sec bins |
 |
 |
| Module-wise count rates for Quadrant C Data is divided into 100 sec bins |
 |
 |
| Module-wise count rates for Quadrant D Data is divided into 100 sec bins |
 |
 |
| Parameter | Plot |
|---|---|
| CZT HV Monitor | 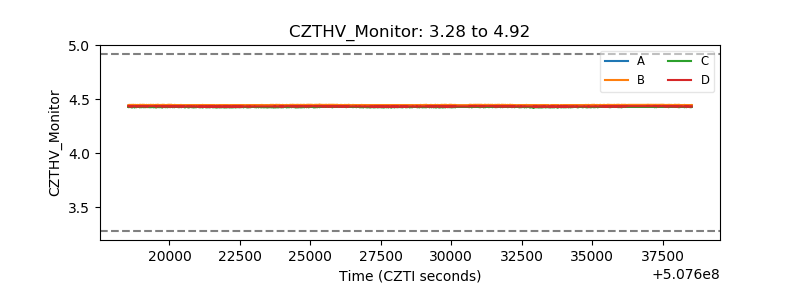 |
| D_VDD | 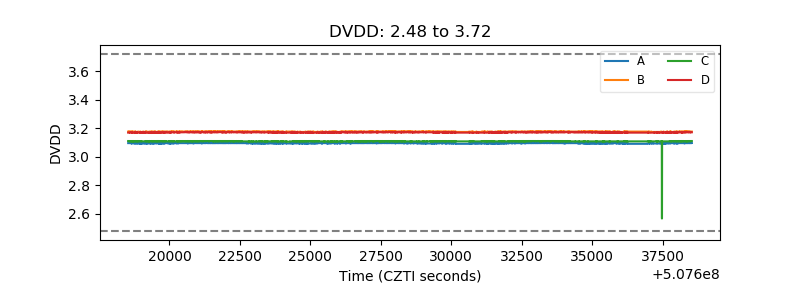 |
| Temperature 1 | 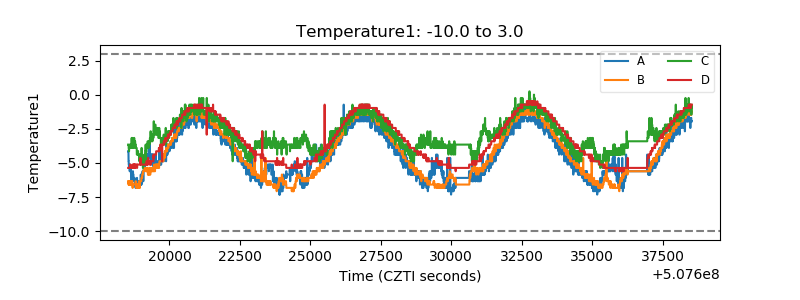 |
| Veto HV Monitor | 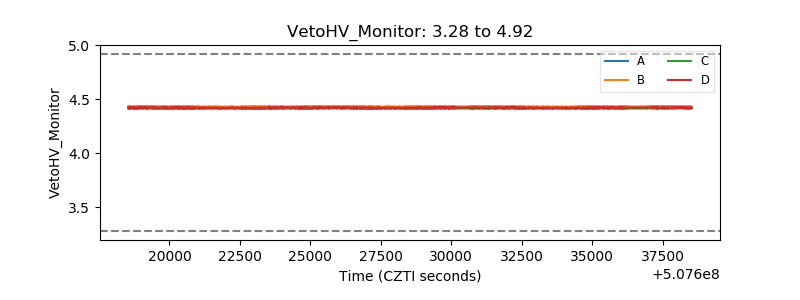 |
| Veto LLD | 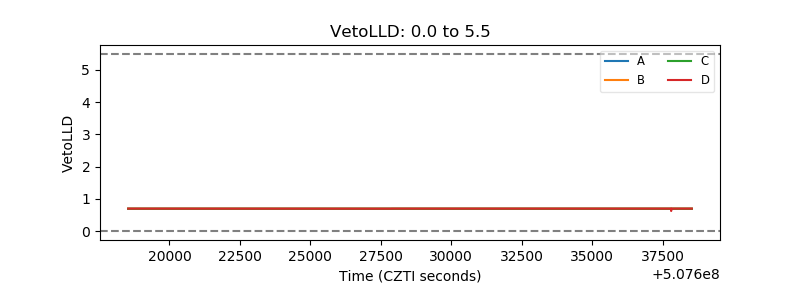 |
| Alpha Counter | 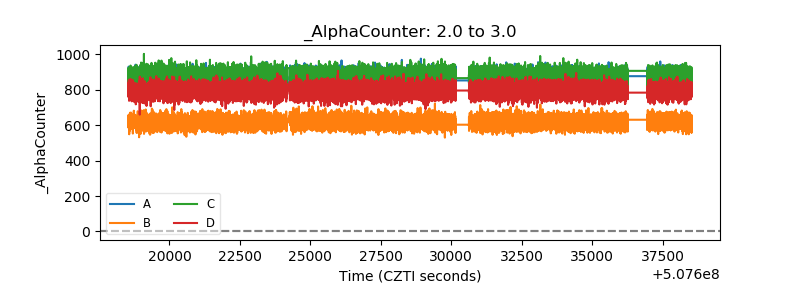 |
| _CPM_Rate | 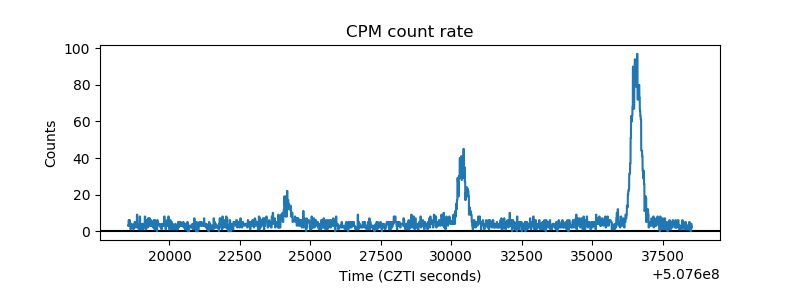 |
| CZT Counter | 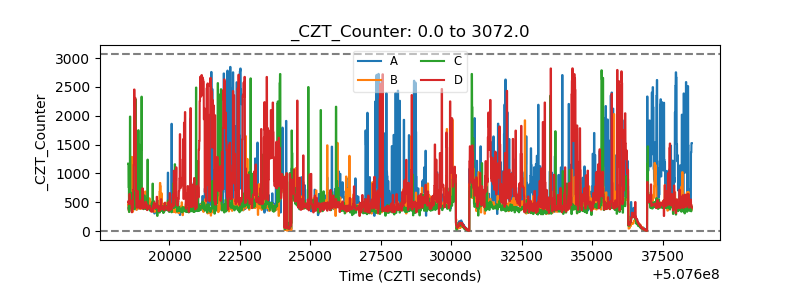 |
| +2.5 Volts monitor | 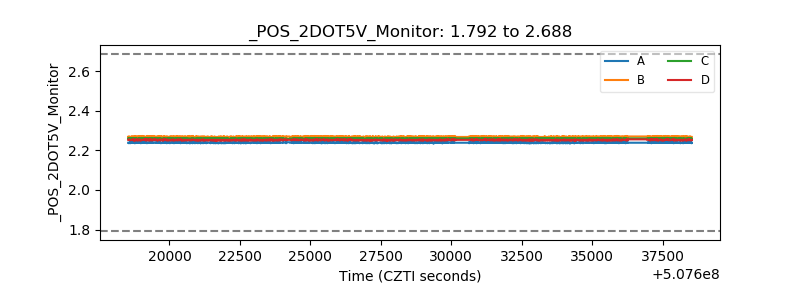 |
| +5 Volts monitor |  |
| _ROLL_ROT | 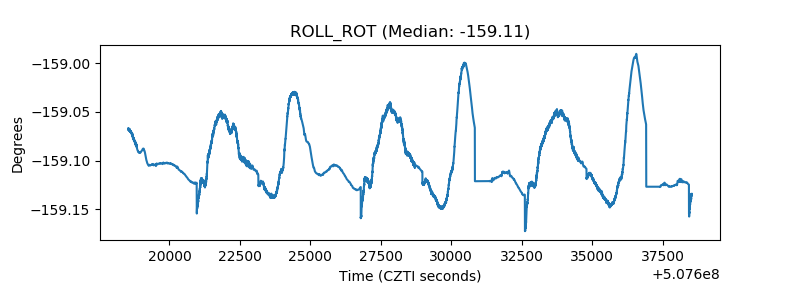 |
| _Roll_DEC | 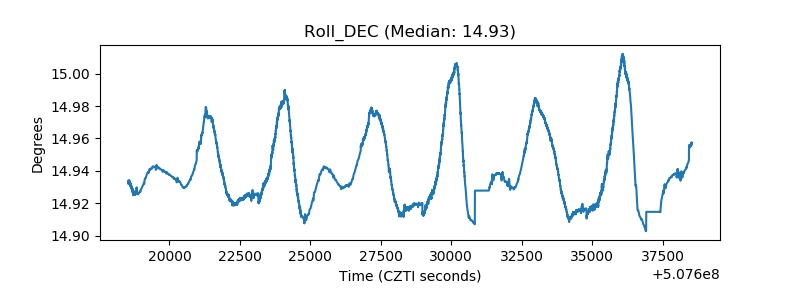 |
| _Roll_RA | 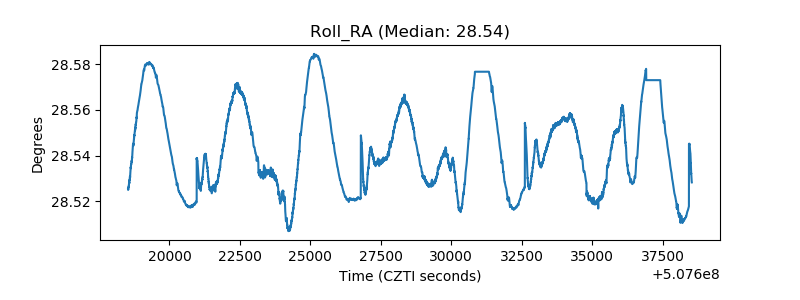 |
| Veto Counter | 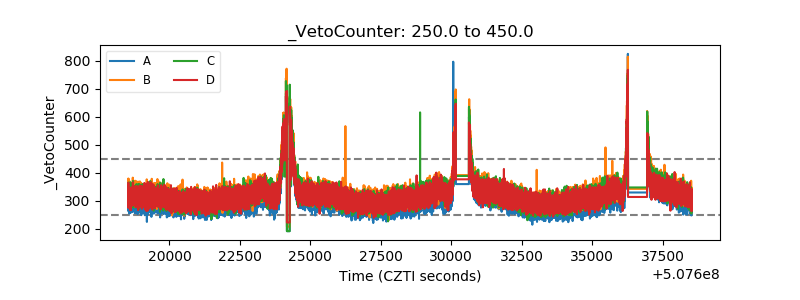 |