| Param | Original file | Final file |
|---|---|---|
| Filename | modeM0/AS1A14_066T02_9000006546_55979cztM0_level2.fits | modeM0/AS1A14_066T02_9000006546_55979cztM0_level2_quad_clean.evt |
| Size (bytes) | 552,280,320 | 86,123,520 |
| Size | 526.7 MB | 82.1 MB |
| Events in quadrant A | 10,416,855 | 402,050 |
| Events in quadrant B | 3,113,077 | 640,252 |
| Events in quadrant C | 3,000,230 | 573,179 |
| Events in quadrant D | 3,414,092 | 543,994 |
| Mode M9 | |||
|---|---|---|---|
| Quadrant | BADHDUFLAG | Total packets | Discarded packets |
| A | 0 | 8 | 0 |
| B | 0 | 8 | 0 |
| C | 0 | 8 | 0 |
| D | 0 | 8 | 0 |
| Mode M0 | |||
|---|---|---|---|
| Quadrant | BADHDUFLAG | Total packets | Discarded packets |
| A | 0 | 35368 | 1 |
| B | 0 | 13920 | 1 |
| C | 0 | 13846 | 1 |
| D | 0 | 14683 | 1 |
| Mode SS | |||
|---|---|---|---|
| Quadrant | BADHDUFLAG | Total packets | Discarded packets |
| A | 0 | 130 | 0 |
| B | 0 | 130 | 0 |
| C | 0 | 130 | 0 |
| D | 0 | 130 | 0 |
| Quadrant | Total seconds | Saturated seconds | Saturation percentage |
|---|---|---|---|
| A | 6423 | 2514 | 39.140589% |
| B | 6423 | 87 | 1.354507% |
| C | 6423 | 63 | 0.980850% |
| D | 6424 | 101 | 1.572229% |
Noise dominated data is calculated using 1-second bins in cleaned event files. If a bin has >2000 counts, and if more than 50% of those come from <1% of pixels, then it is considered to be noise-dominated and hence unusable.
| Quadrant | # 1 sec bins | Bins with >0 counts | Bins with >2000 counts | High rate bins dominated by noise | Noise dominated (total time) | Noise dominated (detector-on time) | Marked lightcurve |
|---|---|---|---|---|---|---|---|
| A | 7248 | 6423 | 2274 | 2274 | 31.37% | 35.40% | 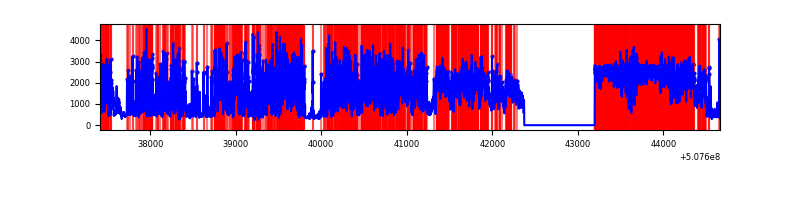 |
| B | 7248 | 6423 | 10 | 10 | 0.14% | 0.16% | 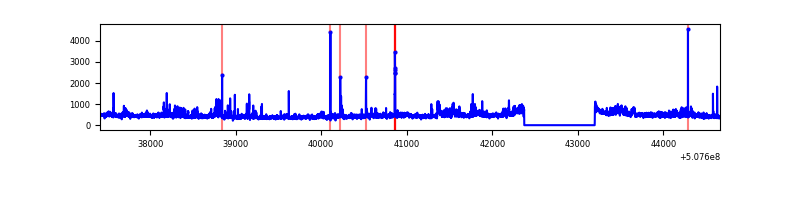 |
| C | 7248 | 6424 | 22 | 22 | 0.30% | 0.34% | 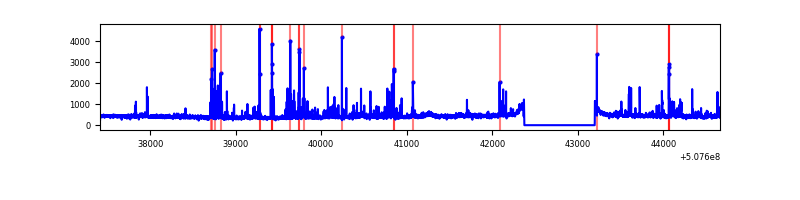 |
| D | 7249 | 6424 | 57 | 57 | 0.79% | 0.89% | 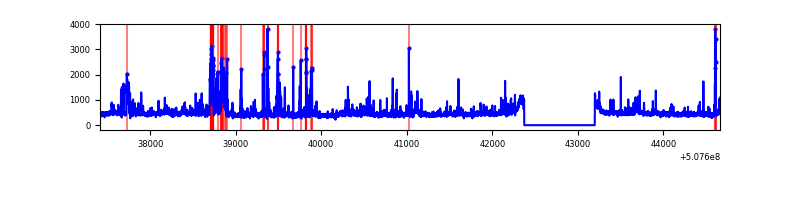 |
Top three noisy pixels from each quadrant. If the there are fewer than three noisy pixels in the level2.evt file, extra rows are filled as -1
| Pixel properties | Quadrant properties | ||||||
|---|---|---|---|---|---|---|---|
| Quadrant | DetID | PixID | Counts | Sigma | Mean | Median | Sigma |
| A | 12 | 115 | 3938916 | 26969.24 | 580 | 564 | 146.0 |
| A | 4 | 249 | 3532852 | 24188.57 | 580 | 564 | 146.0 |
| A | 7 | 64 | 408022 | 2790.21 | 580 | 564 | 146.0 |
| B | 2 | 249 | 159610 | 1096.79 | 672 | 646 | 144.9 |
| B | 0 | 199 | 115911 | 795.28 | 672 | 646 | 144.9 |
| B | 0 | 213 | 82325 | 563.55 | 672 | 646 | 144.9 |
| C | 2 | 12 | 126106 | 689.24 | 661 | 654 | 182.0 |
| C | 14 | 254 | 86761 | 473.08 | 661 | 654 | 182.0 |
| C | 6 | 223 | 56411 | 306.33 | 661 | 654 | 182.0 |
| D | 11 | 129 | 264000 | 1389.62 | 665 | 636 | 189.5 |
| D | 7 | 129 | 155519 | 817.23 | 665 | 636 | 189.5 |
| D | 2 | 249 | 135439 | 711.28 | 665 | 636 | 189.5 |
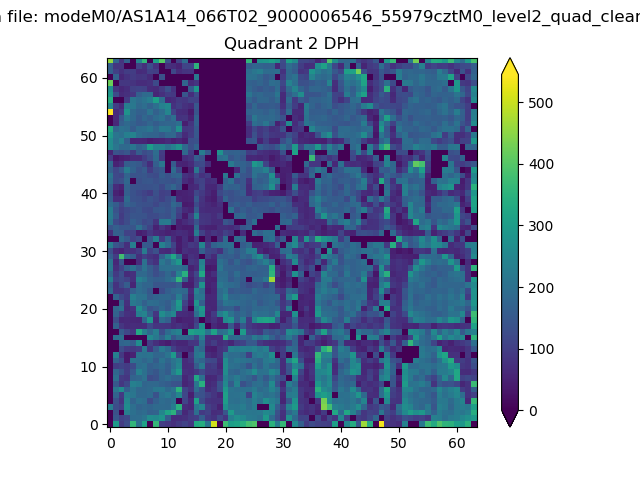
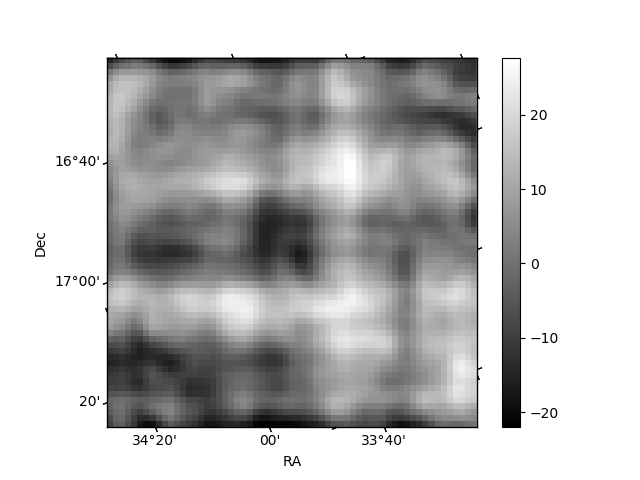
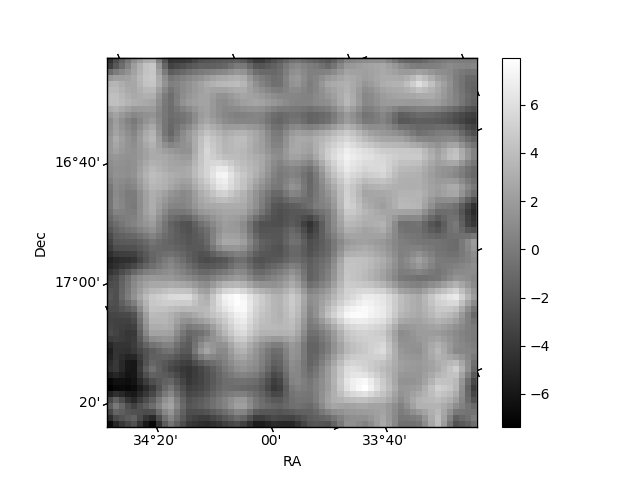
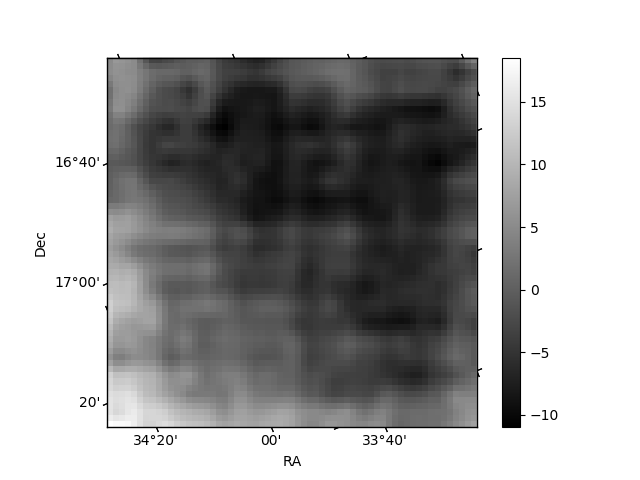
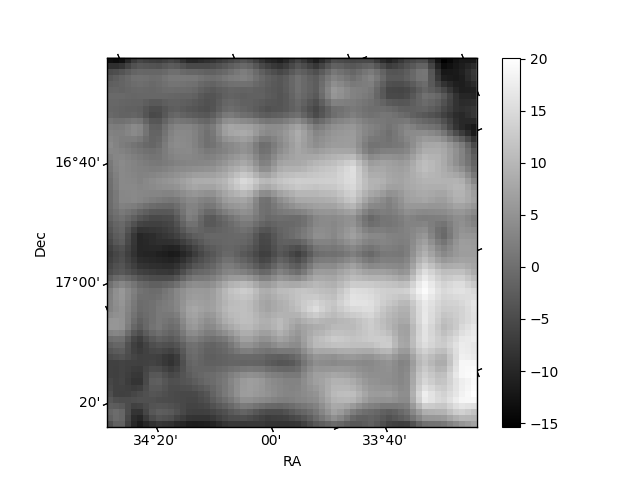
Histogram calculated using DETX and DETY for each event in the final _common_clean file
| Quadrant A | 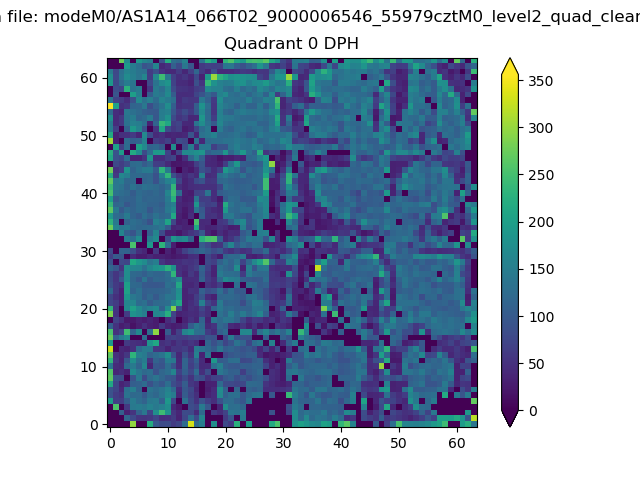 |
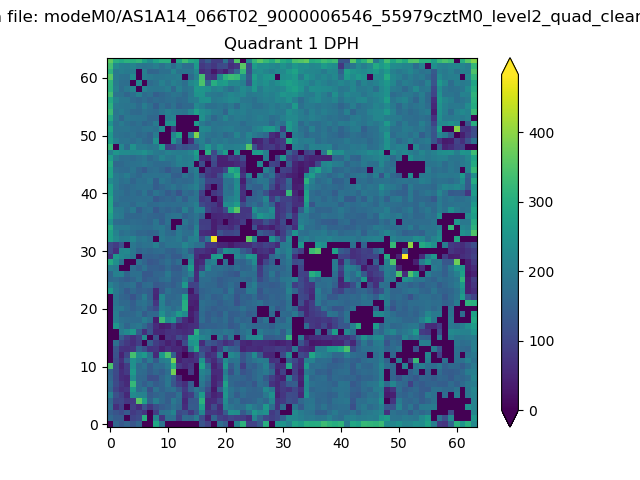 |
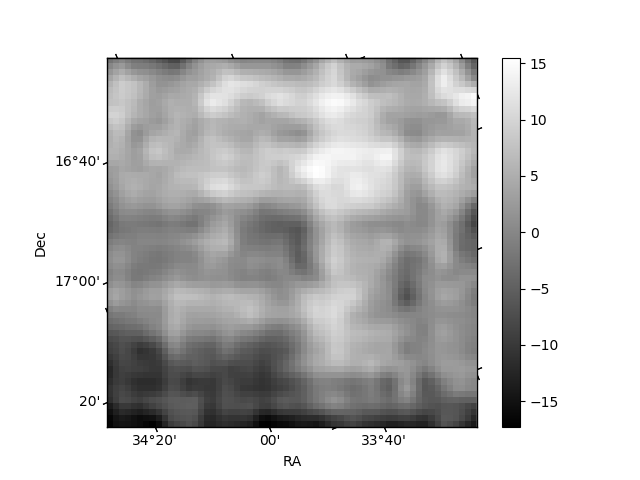
Quadrant B |
|---|---|---|---|
| Quadrant D | 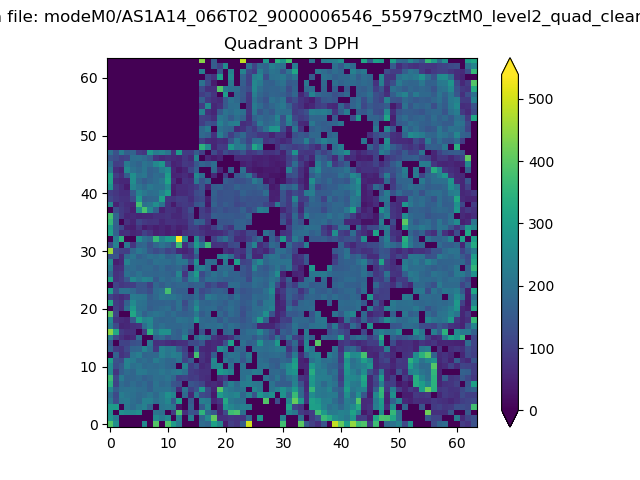 |
 |
Quadrant C |
| Plot type | Count rate plots | Images |
|---|---|---|
| Comparison with Poisson distribution Blue bars denote a histogram of data divided into 1 sec bins. Red curve is a Poisson curve with rate = median count rate of data. |
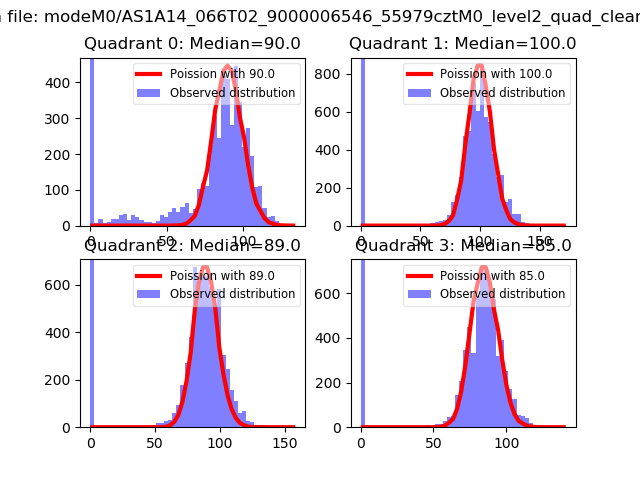 |
 |
| Quadrant-wise count rates Data is divided into 100 sec bins |
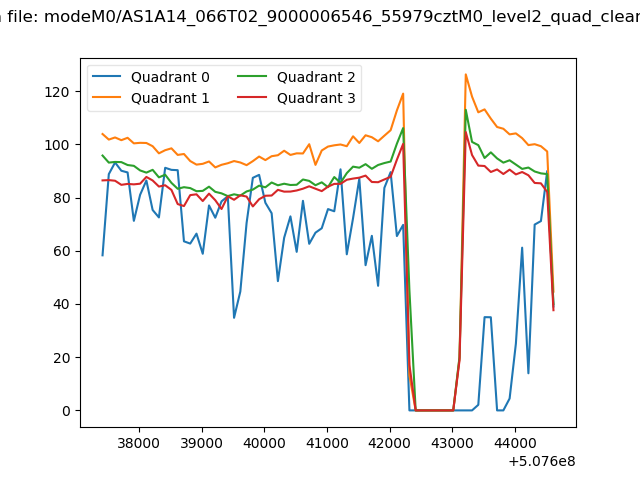 |
|
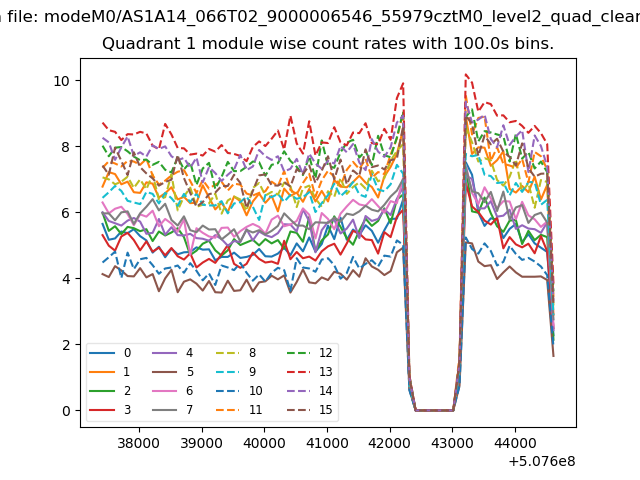
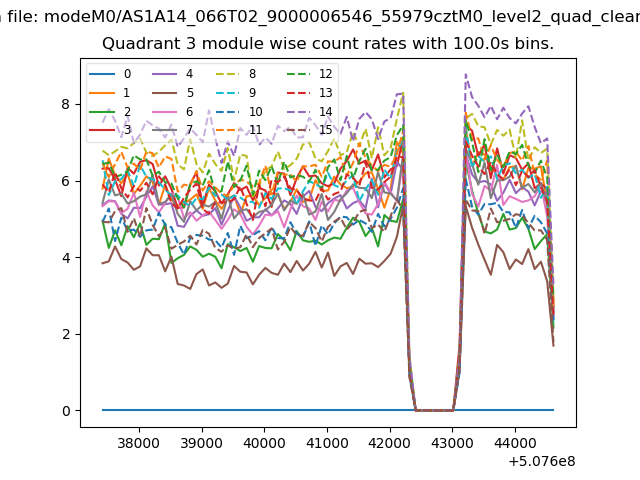
| Module-wise count rates for Quadrant A Data is divided into 100 sec bins |
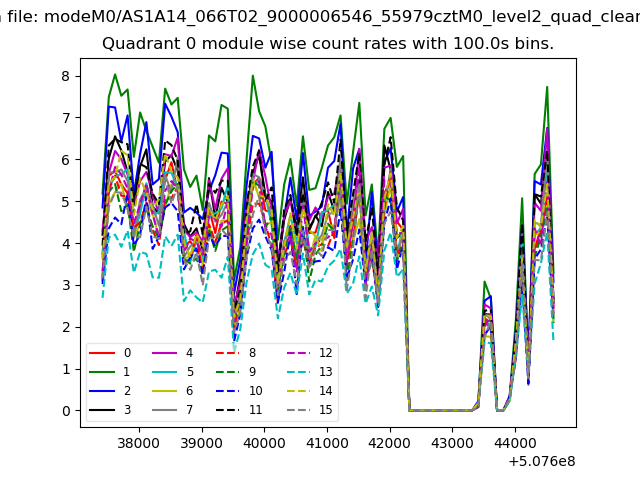 |
 |
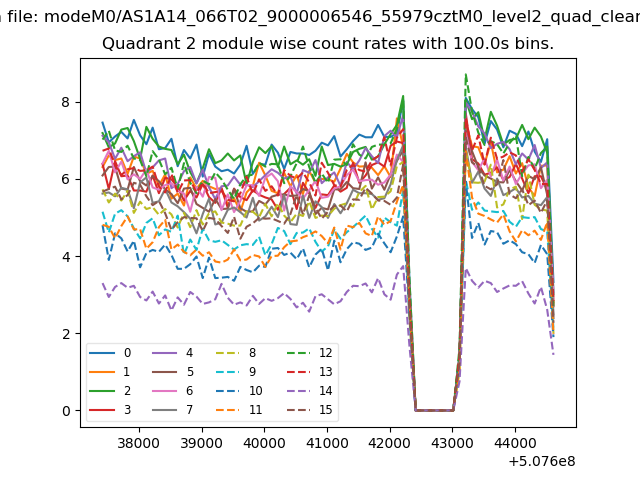
| Module-wise count rates for Quadrant B Data is divided into 100 sec bins |
 |
 |
| Module-wise count rates for Quadrant C Data is divided into 100 sec bins |
 |
 |
| Module-wise count rates for Quadrant D Data is divided into 100 sec bins |
 |
 |
| Parameter | Plot |
|---|---|
| CZT HV Monitor | 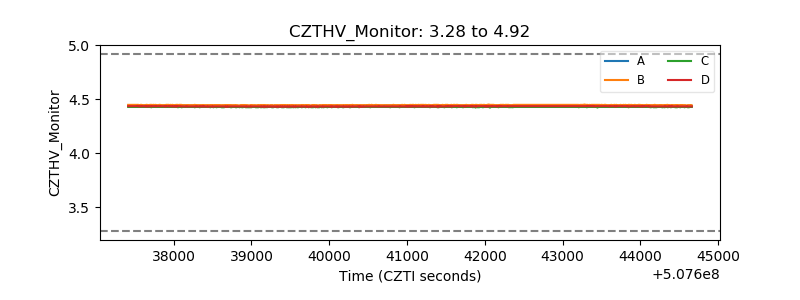 |
| D_VDD | 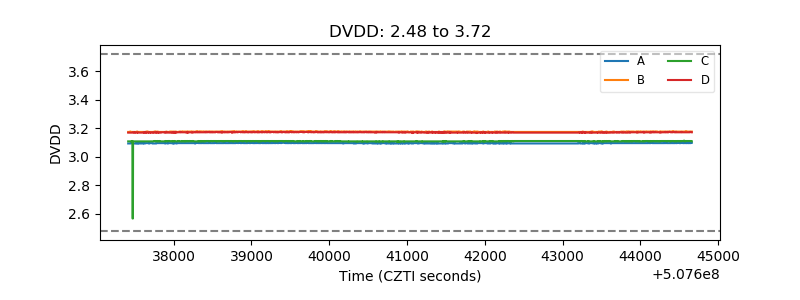 |
| Temperature 1 | 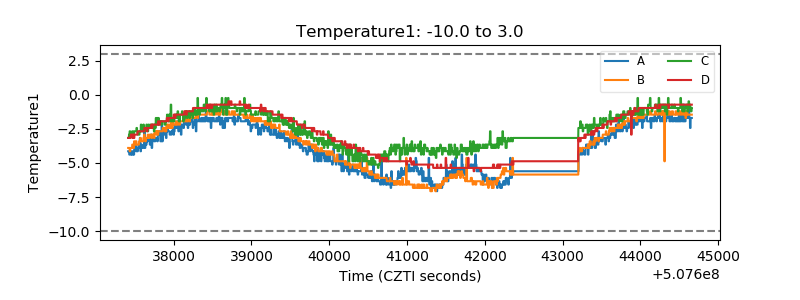 |
| Veto HV Monitor |  |
| Veto LLD | 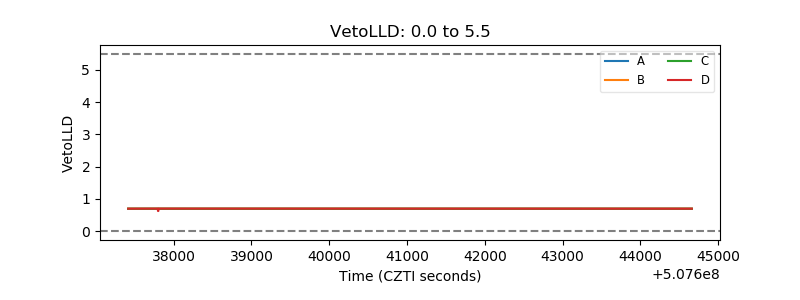 |
| Alpha Counter | 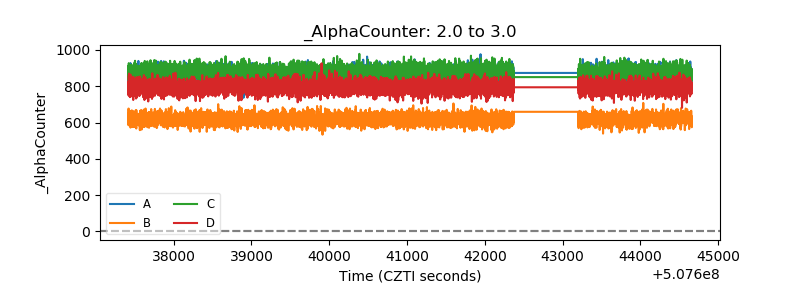 |
| _CPM_Rate | 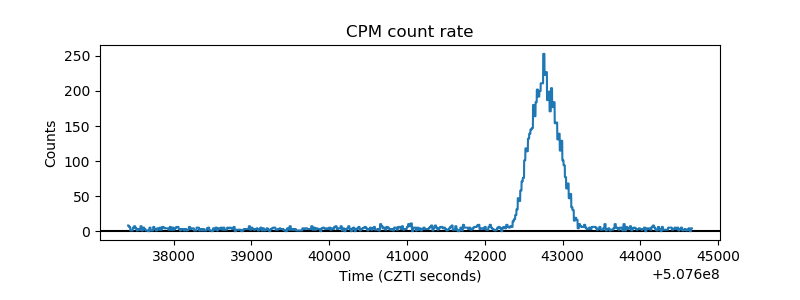 |
| CZT Counter | 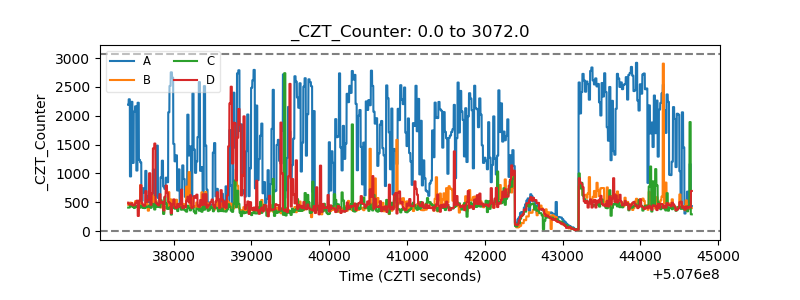 |
| +2.5 Volts monitor |  |
| +5 Volts monitor |  |
| _ROLL_ROT | 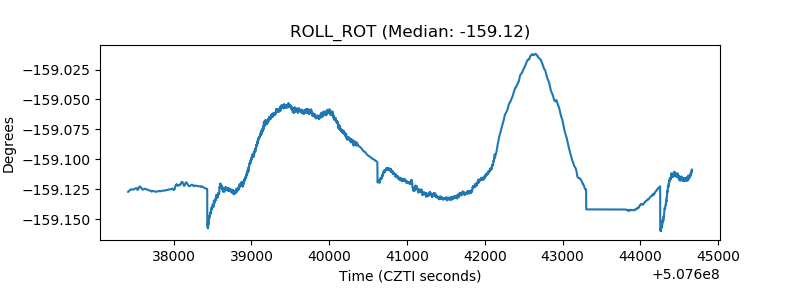 |
| _Roll_DEC | 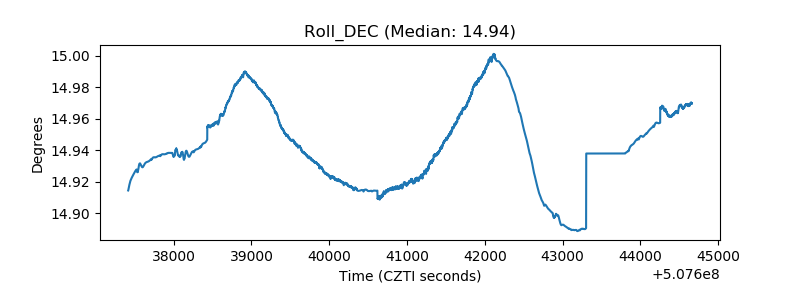 |
| _Roll_RA | 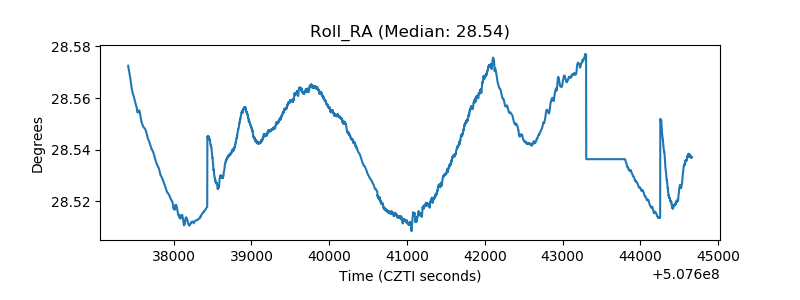 |
| Veto Counter | 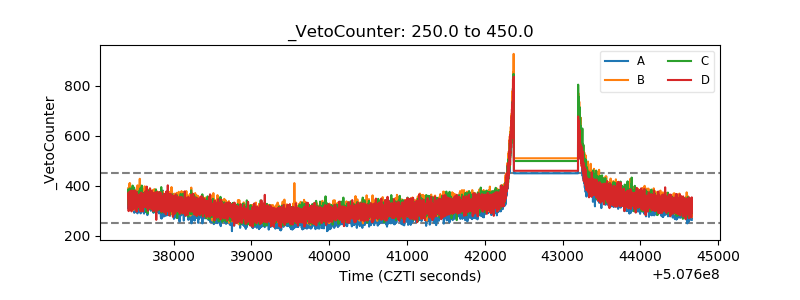 |