| Param | Original file | Final file |
|---|---|---|
| Filename | modeM0/AS1A14_066T02_9000006546_55981cztM0_level2.fits | modeM0/AS1A14_066T02_9000006546_55981cztM0_level2_quad_clean.evt |
| Size (bytes) | 444,147,840 | 89,064,000 |
| Size | 423.6 MB | 84.9 MB |
| Events in quadrant A | 5,754,284 | 540,953 |
| Events in quadrant B | 2,996,426 | 632,763 |
| Events in quadrant C | 3,208,051 | 561,185 |
| Events in quadrant D | 3,990,841 | 521,083 |
| Mode M9 | |||
|---|---|---|---|
| Quadrant | BADHDUFLAG | Total packets | Discarded packets |
| A | 0 | 10 | 0 |
| B | 0 | 10 | 0 |
| C | 0 | 10 | 0 |
| D | 0 | 10 | 0 |
| Mode M0 | |||
|---|---|---|---|
| Quadrant | BADHDUFLAG | Total packets | Discarded packets |
| A | 0 | 21455 | 1 |
| B | 0 | 13467 | 1 |
| C | 0 | 14362 | 1 |
| D | 0 | 16300 | 1 |
| Mode SS | |||
|---|---|---|---|
| Quadrant | BADHDUFLAG | Total packets | Discarded packets |
| A | 0 | 128 | 0 |
| B | 0 | 128 | 0 |
| C | 0 | 128 | 0 |
| D | 0 | 128 | 0 |
| Quadrant | Total seconds | Saturated seconds | Saturation percentage |
|---|---|---|---|
| A | 6317 | 737 | 11.666931% |
| B | 6317 | 63 | 0.997309% |
| C | 6318 | 83 | 1.313707% |
| D | 6318 | 276 | 4.368471% |
Noise dominated data is calculated using 1-second bins in cleaned event files. If a bin has >2000 counts, and if more than 50% of those come from <1% of pixels, then it is considered to be noise-dominated and hence unusable.
| Quadrant | # 1 sec bins | Bins with >0 counts | Bins with >2000 counts | High rate bins dominated by noise | Noise dominated (total time) | Noise dominated (detector-on time) | Marked lightcurve |
|---|---|---|---|---|---|---|---|
| A | 7307 | 6317 | 657 | 657 | 8.99% | 10.40% | 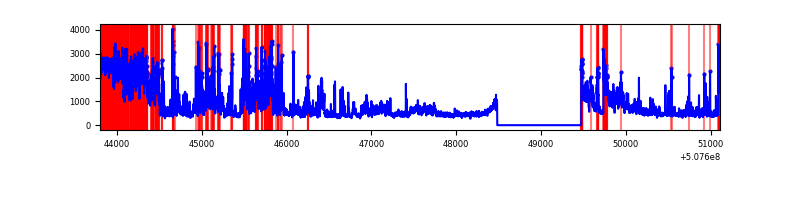 |
| B | 7307 | 6318 | 5 | 5 | 0.07% | 0.08% | 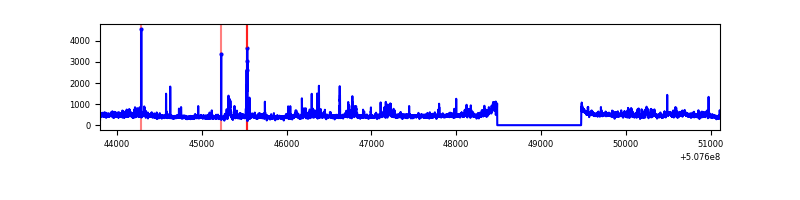 |
| C | 7308 | 6319 | 71 | 71 | 0.97% | 1.12% | 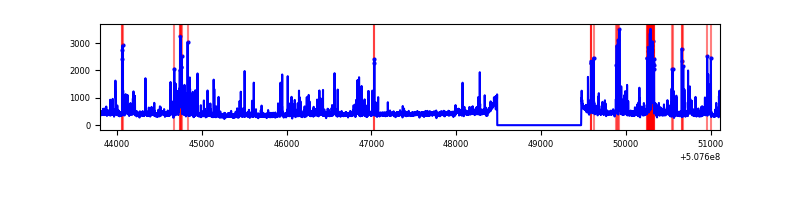 |
| D | 7308 | 6319 | 252 | 252 | 3.45% | 3.99% | 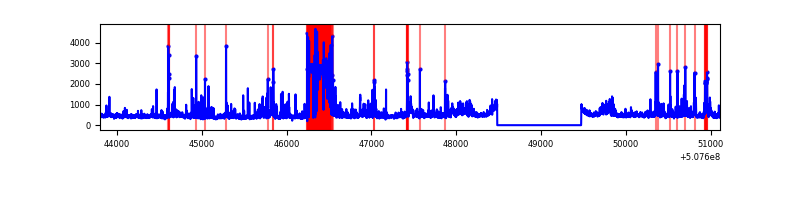 |
Top three noisy pixels from each quadrant. If the there are fewer than three noisy pixels in the level2.evt file, extra rows are filled as -1
| Pixel properties | Quadrant properties | ||||||
|---|---|---|---|---|---|---|---|
| Quadrant | DetID | PixID | Counts | Sigma | Mean | Median | Sigma |
| A | 12 | 115 | 2431157 | 15372.89 | 635 | 619 | 158.1 |
| A | 7 | 64 | 378802 | 2391.97 | 635 | 619 | 158.1 |
| A | 4 | 249 | 173146 | 1091.21 | 635 | 619 | 158.1 |
| B | 0 | 213 | 156296 | 1116.08 | 652 | 631 | 139.5 |
| B | 0 | 199 | 68183 | 484.33 | 652 | 631 | 139.5 |
| B | 0 | 229 | 39620 | 279.54 | 652 | 631 | 139.5 |
| C | 2 | 12 | 554049 | 3131.97 | 637 | 630 | 176.7 |
| C | 6 | 223 | 35114 | 195.16 | 637 | 630 | 176.7 |
| C | 12 | 189 | 25857 | 142.77 | 637 | 630 | 176.7 |
| D | 2 | 249 | 824296 | 4496.39 | 633 | 604 | 183.2 |
| D | 11 | 129 | 141789 | 770.7 | 633 | 604 | 183.2 |
| D | 8 | 245 | 103511 | 561.75 | 633 | 604 | 183.2 |
Histogram calculated using DETX and DETY for each event in the final _common_clean file
| Quadrant A |  |
 |
Quadrant B |
|---|---|---|---|
| Quadrant D |  |
 |
Quadrant C |
| Plot type | Count rate plots | Images |
|---|---|---|
| Comparison with Poisson distribution Blue bars denote a histogram of data divided into 1 sec bins. Red curve is a Poisson curve with rate = median count rate of data. |
 |
 |
| Quadrant-wise count rates Data is divided into 100 sec bins |
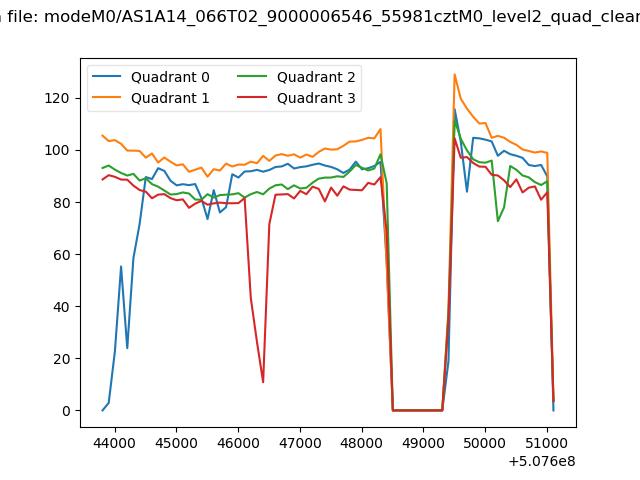 |
|
| Module-wise count rates for Quadrant A Data is divided into 100 sec bins |
 |
 |
| Module-wise count rates for Quadrant B Data is divided into 100 sec bins |
 |
 |
| Module-wise count rates for Quadrant C Data is divided into 100 sec bins |
 |
 |
| Module-wise count rates for Quadrant D Data is divided into 100 sec bins |
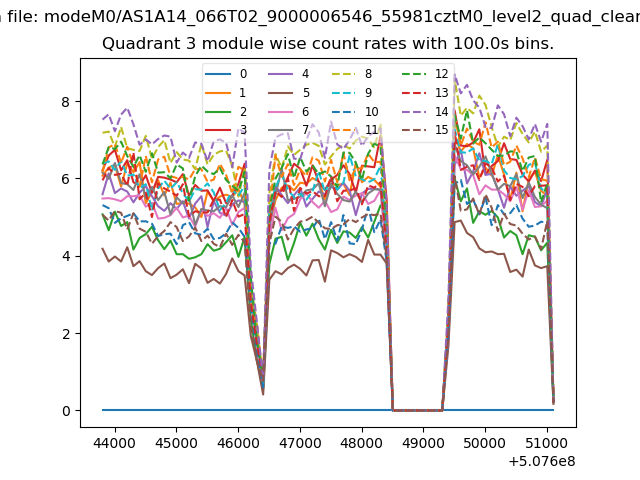 |
 |
| Parameter | Plot |
|---|---|
| CZT HV Monitor |  |
| D_VDD | 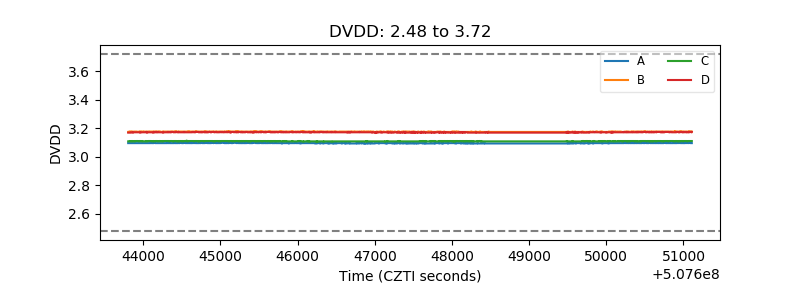 |
| Temperature 1 | 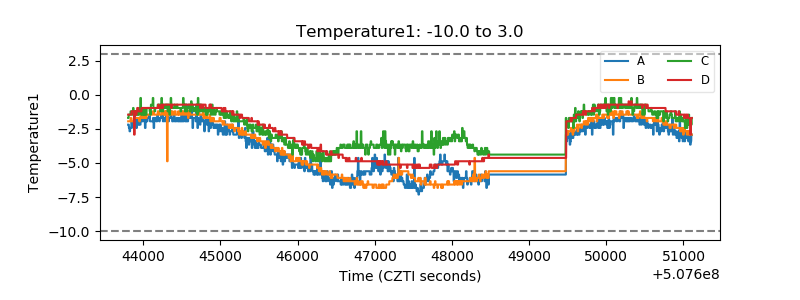 |
| Veto HV Monitor | 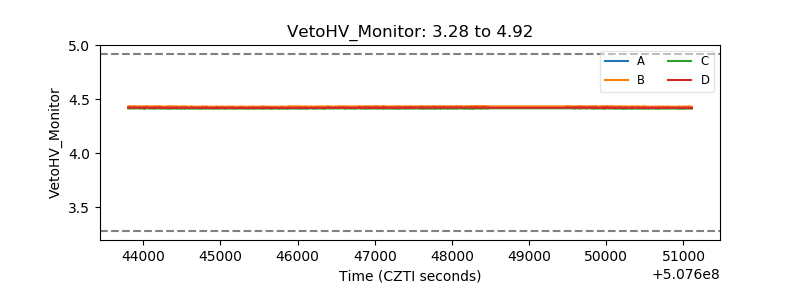 |
| Veto LLD | 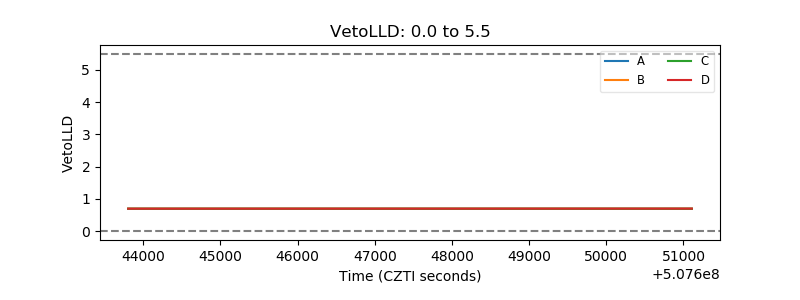 |
| Alpha Counter |  |
| _CPM_Rate |  |
| CZT Counter | 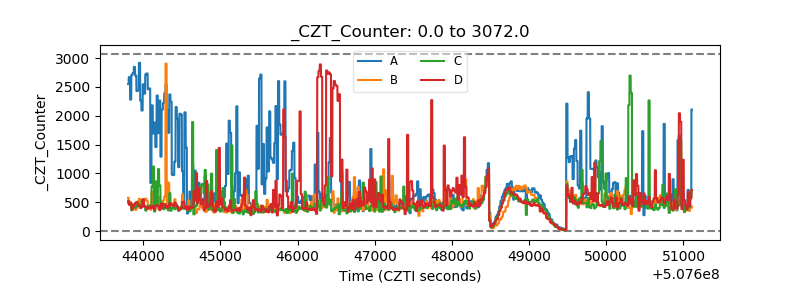 |
| +2.5 Volts monitor |  |
| +5 Volts monitor |  |
| _ROLL_ROT | 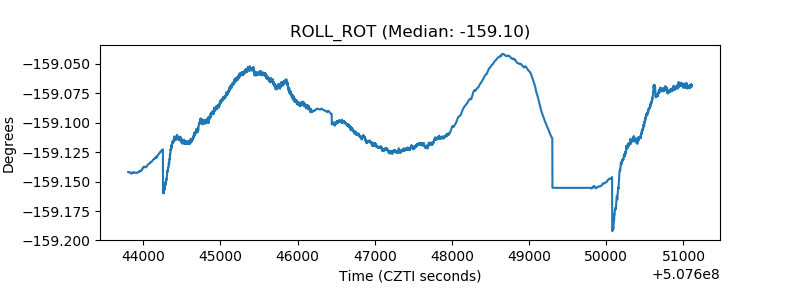 |
| _Roll_DEC | 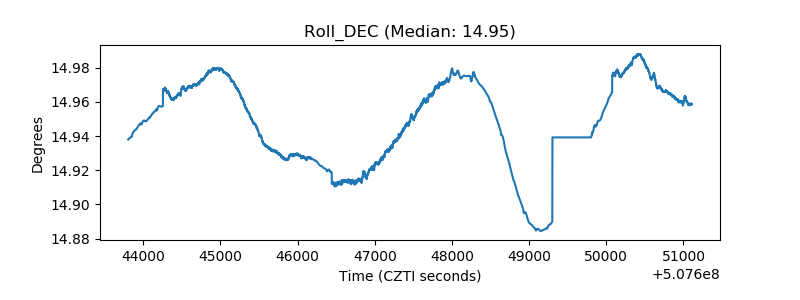 |
| _Roll_RA | 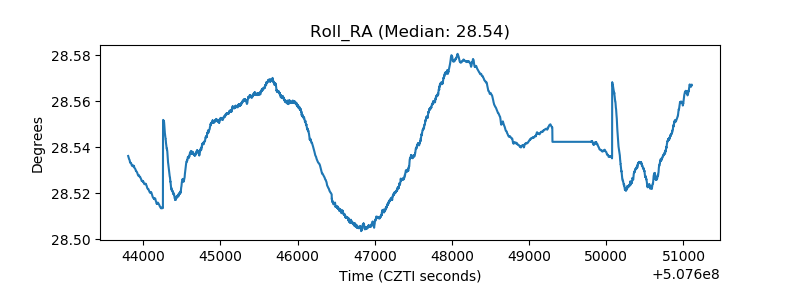 |
| Veto Counter | 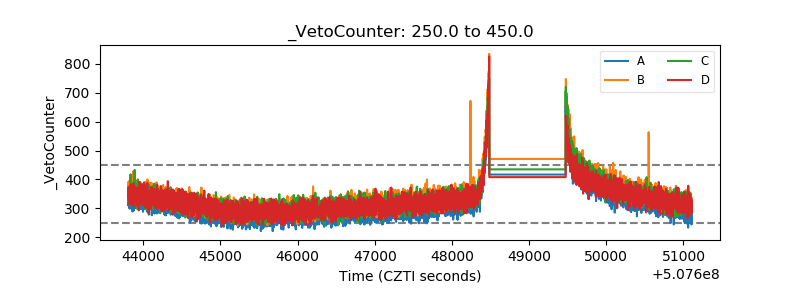 |