| Param | Original file | Final file |
|---|---|---|
| Filename | modeM0/AS1A14_066T02_9000006546_55982cztM0_level2.fits | modeM0/AS1A14_066T02_9000006546_55982cztM0_level2_quad_clean.evt |
| Size (bytes) | 399,807,360 | 93,026,880 |
| Size | 381.3 MB | 88.7 MB |
| Events in quadrant A | 4,426,338 | 603,564 |
| Events in quadrant B | 3,128,154 | 648,685 |
| Events in quadrant C | 3,417,959 | 570,299 |
| Events in quadrant D | 3,332,931 | 551,303 |
| Mode M9 | |||
|---|---|---|---|
| Quadrant | BADHDUFLAG | Total packets | Discarded packets |
| A | 0 | 11 | 0 |
| B | 0 | 11 | 0 |
| C | 0 | 11 | 0 |
| D | 0 | 11 | 0 |
| Mode M0 | |||
|---|---|---|---|
| Quadrant | BADHDUFLAG | Total packets | Discarded packets |
| A | 0 | 17548 | 7 |
| B | 0 | 13816 | 1 |
| C | 0 | 14893 | 1 |
| D | 0 | 14490 | 1 |
| Mode SS | |||
|---|---|---|---|
| Quadrant | BADHDUFLAG | Total packets | Discarded packets |
| A | 0 | 128 | 0 |
| B | 0 | 128 | 0 |
| C | 0 | 128 | 0 |
| D | 0 | 128 | 0 |
| Quadrant | Total seconds | Saturated seconds | Saturation percentage |
|---|---|---|---|
| A | 6353 | 193 | 3.037935% |
| B | 6353 | 79 | 1.243507% |
| C | 6353 | 176 | 2.770345% |
| D | 6354 | 76 | 1.196097% |
Noise dominated data is calculated using 1-second bins in cleaned event files. If a bin has >2000 counts, and if more than 50% of those come from <1% of pixels, then it is considered to be noise-dominated and hence unusable.
| Quadrant | # 1 sec bins | Bins with >0 counts | Bins with >2000 counts | High rate bins dominated by noise | Noise dominated (total time) | Noise dominated (detector-on time) | Marked lightcurve |
|---|---|---|---|---|---|---|---|
| A | 7418 | 6353 | 174 | 174 | 2.35% | 2.74% | 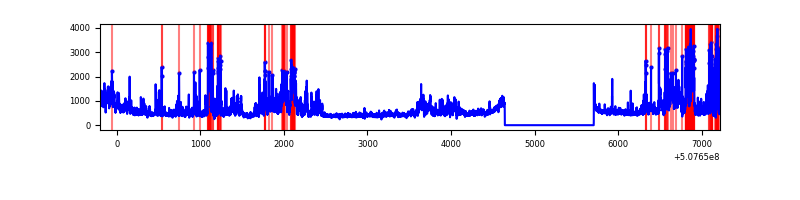 |
| B | 7418 | 6353 | 5 | 5 | 0.07% | 0.08% | 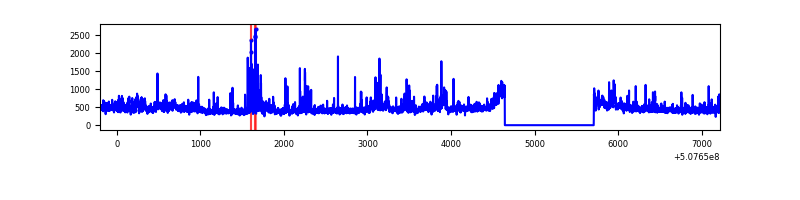 |
| C | 7418 | 6354 | 130 | 130 | 1.75% | 2.05% | 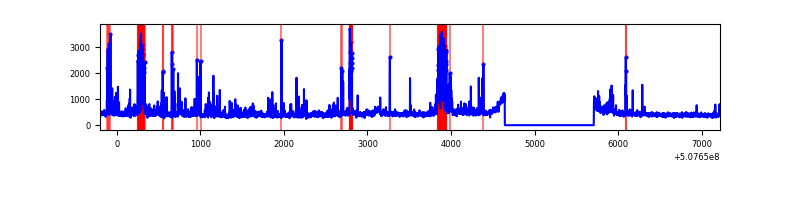 |
| D | 7419 | 6355 | 38 | 38 | 0.51% | 0.60% | 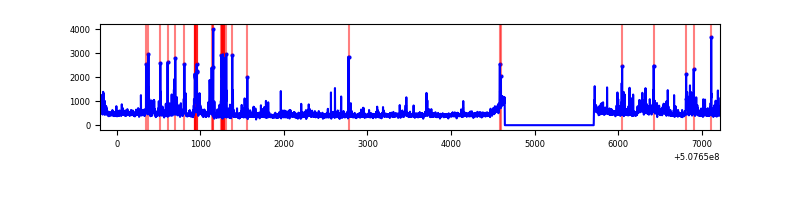 |
Top three noisy pixels from each quadrant. If the there are fewer than three noisy pixels in the level2.evt file, extra rows are filled as -1
| Pixel properties | Quadrant properties | ||||||
|---|---|---|---|---|---|---|---|
| Quadrant | DetID | PixID | Counts | Sigma | Mean | Median | Sigma |
| A | 12 | 115 | 970680 | 5797.08 | 673 | 657 | 167.3 |
| A | 7 | 64 | 497667 | 2970.25 | 673 | 657 | 167.3 |
| A | 15 | 32 | 90696 | 538.09 | 673 | 657 | 167.3 |
| B | 0 | 199 | 113443 | 792.91 | 668 | 643 | 142.3 |
| B | 1 | 207 | 98763 | 689.72 | 668 | 643 | 142.3 |
| B | 0 | 213 | 88508 | 617.63 | 668 | 643 | 142.3 |
| C | 2 | 12 | 424168 | 2349.84 | 652 | 645 | 180.2 |
| C | 12 | 252 | 242649 | 1342.71 | 652 | 645 | 180.2 |
| C | 14 | 254 | 97019 | 534.71 | 652 | 645 | 180.2 |
| D | 2 | 249 | 221611 | 1174.52 | 659 | 628 | 188.1 |
| D | 3 | 12 | 120700 | 638.18 | 659 | 628 | 188.1 |
| D | 6 | 239 | 91897 | 485.09 | 659 | 628 | 188.1 |
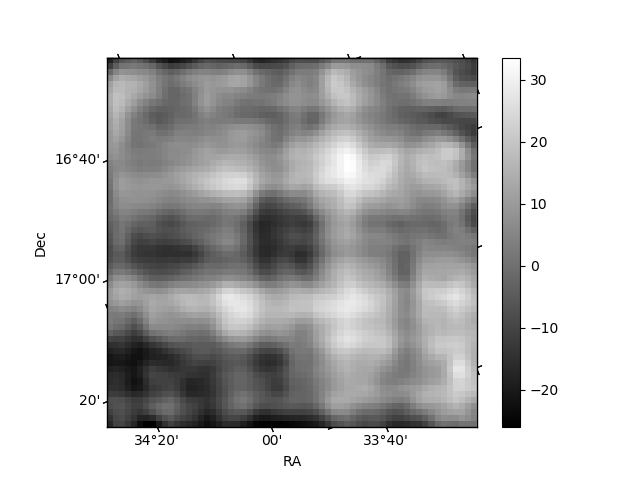
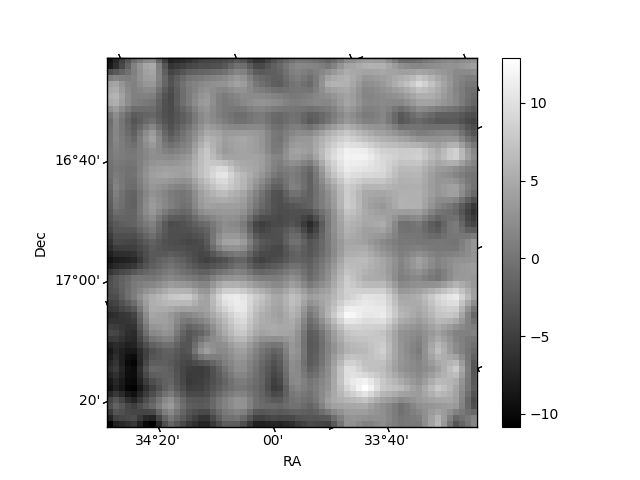
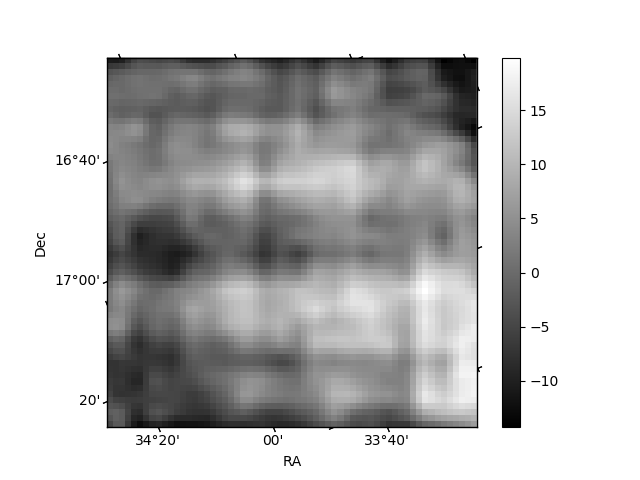
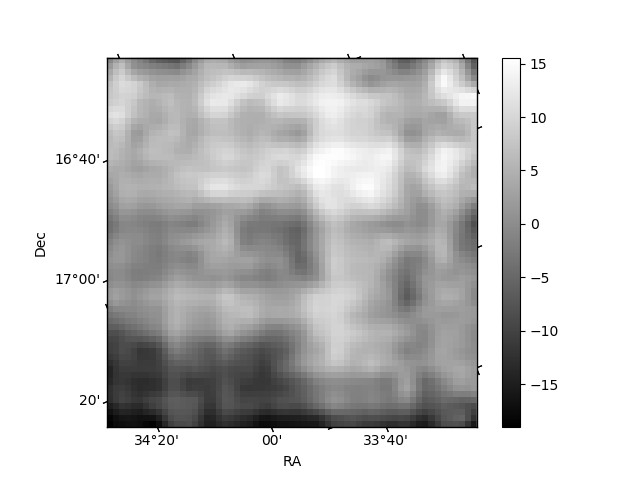
Histogram calculated using DETX and DETY for each event in the final _common_clean file
| Quadrant A | 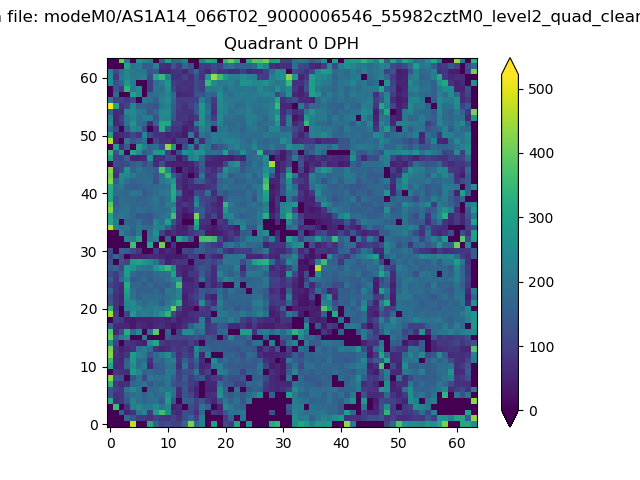 |
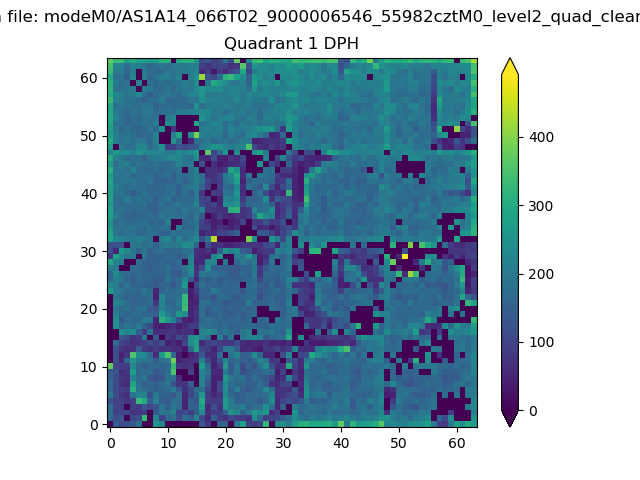 |
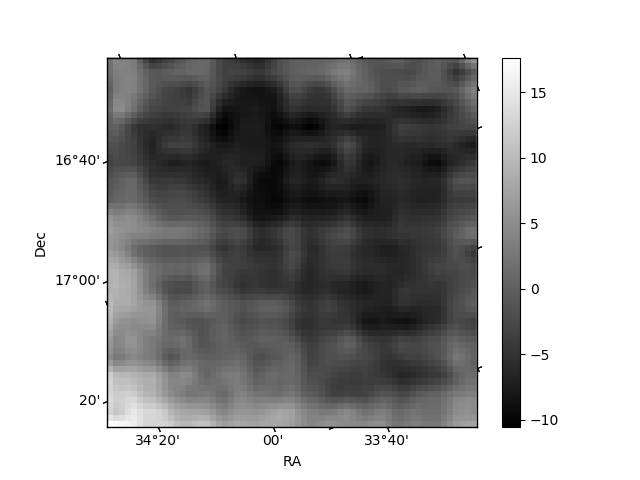
Quadrant B |
|---|---|---|---|
| Quadrant D | 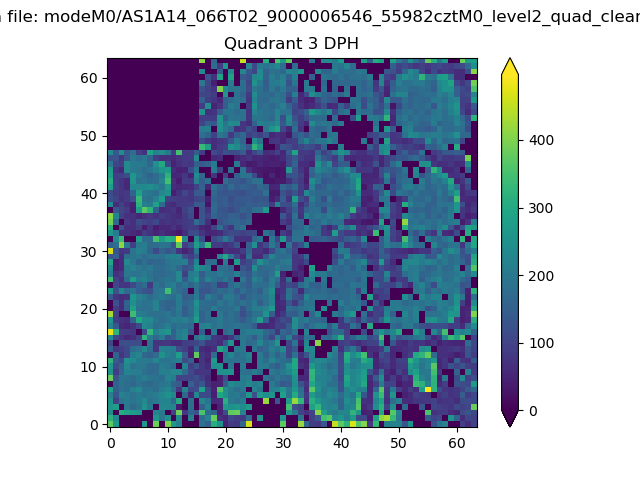 |
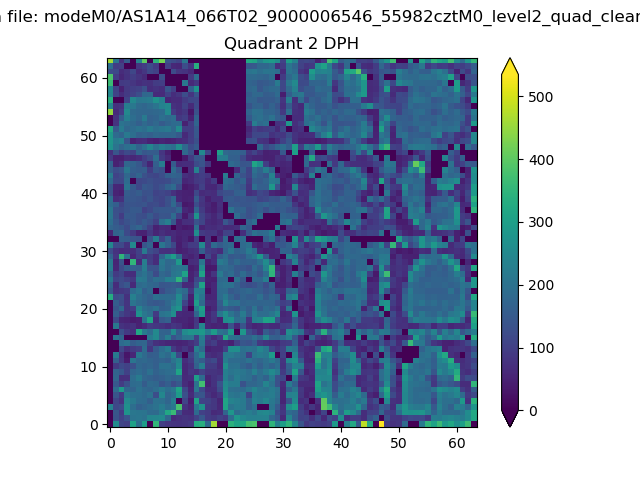 |
Quadrant C |
| Plot type | Count rate plots | Images |
|---|---|---|
| Comparison with Poisson distribution Blue bars denote a histogram of data divided into 1 sec bins. Red curve is a Poisson curve with rate = median count rate of data. |
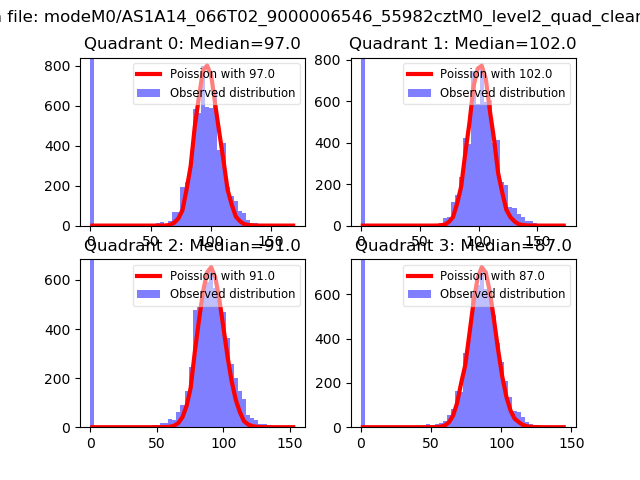 |
 |
| Quadrant-wise count rates Data is divided into 100 sec bins |
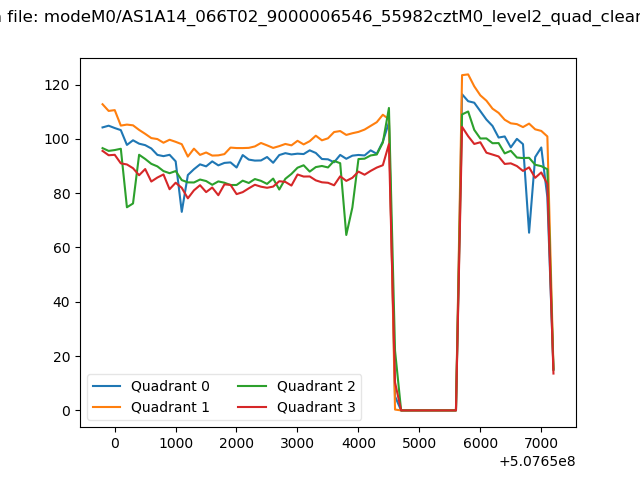 |
|
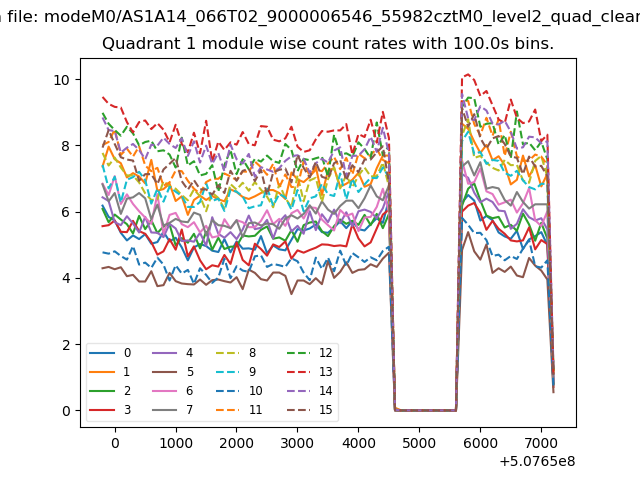
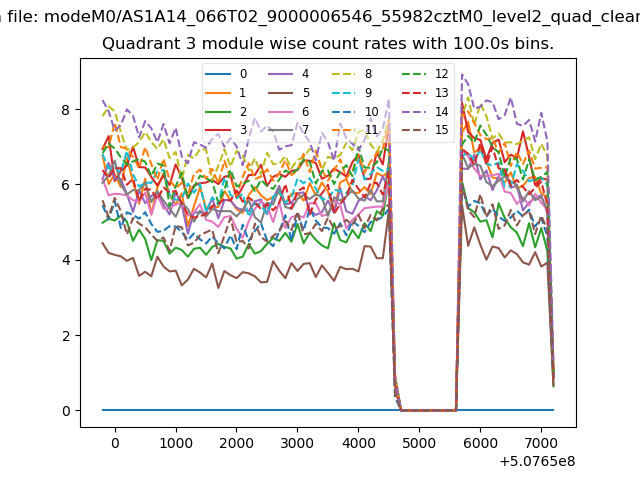
| Module-wise count rates for Quadrant A Data is divided into 100 sec bins |
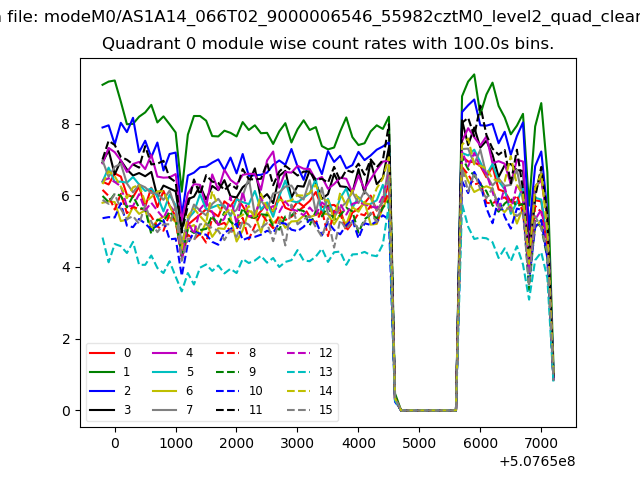 |
 |
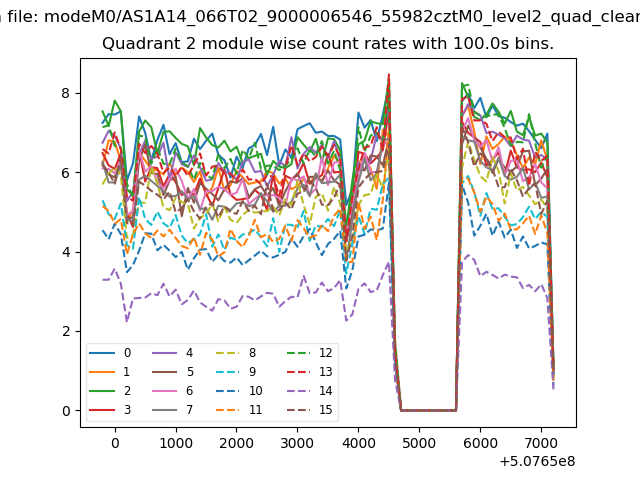
| Module-wise count rates for Quadrant B Data is divided into 100 sec bins |
 |
 |
| Module-wise count rates for Quadrant C Data is divided into 100 sec bins |
 |
 |
| Module-wise count rates for Quadrant D Data is divided into 100 sec bins |
 |
 |
| Parameter | Plot |
|---|---|
| CZT HV Monitor | 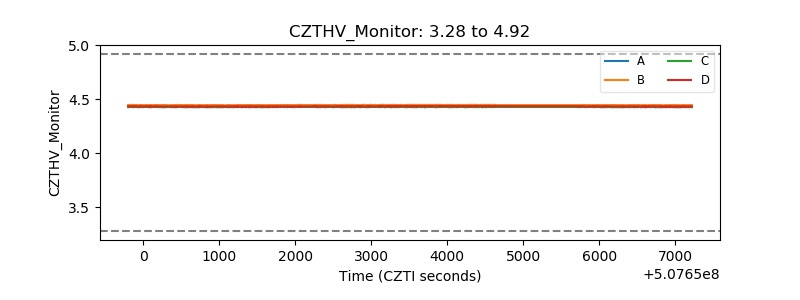 |
| D_VDD | 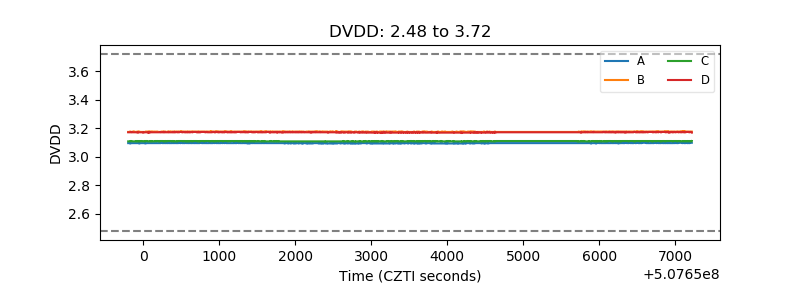 |
| Temperature 1 | 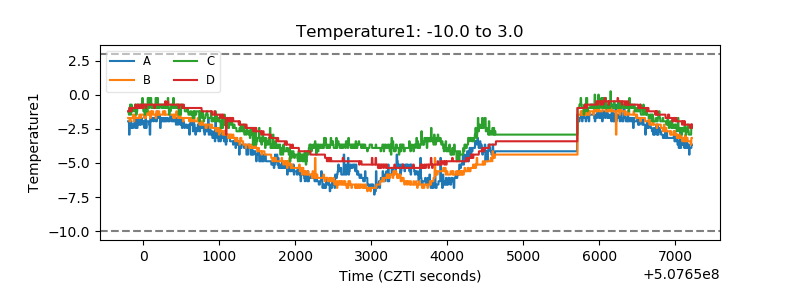 |
| Veto HV Monitor | 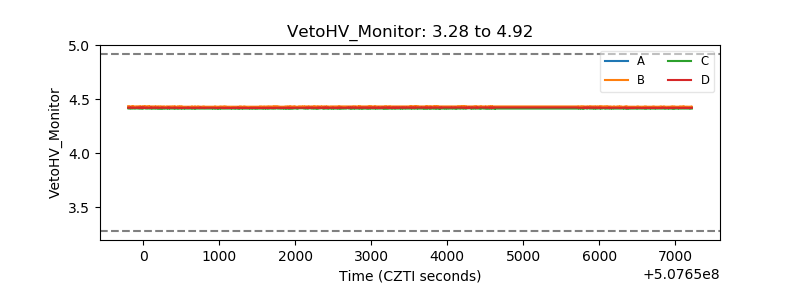 |
| Veto LLD | 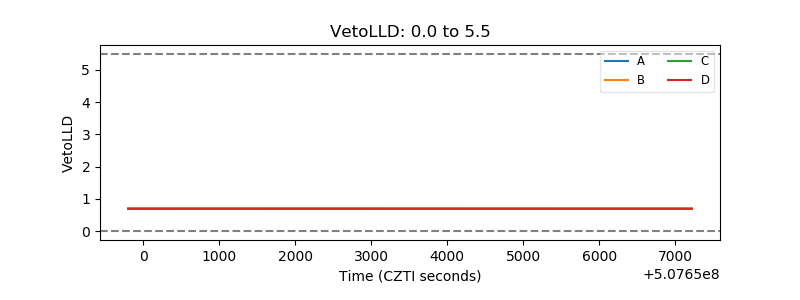 |
| Alpha Counter | 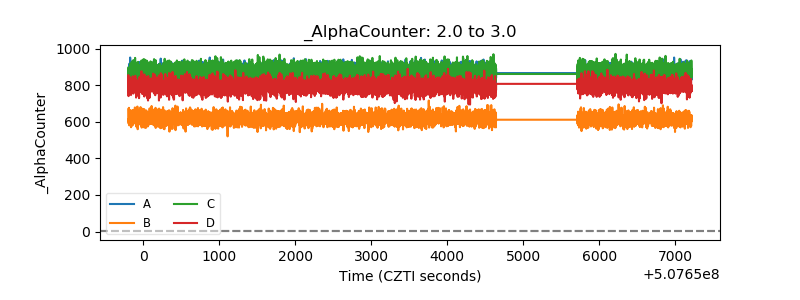 |
| _CPM_Rate | 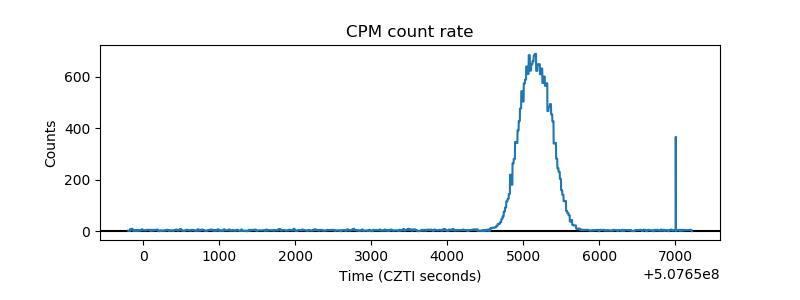 |
| CZT Counter | 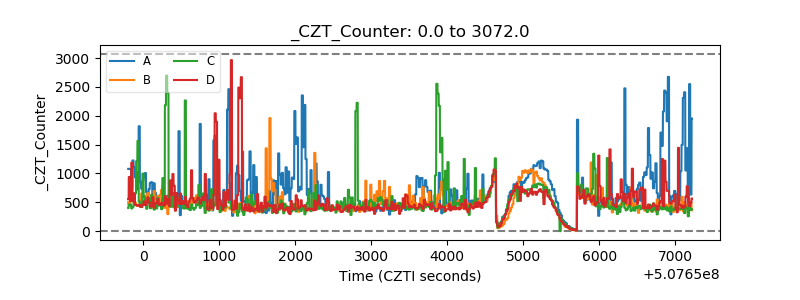 |
| +2.5 Volts monitor | 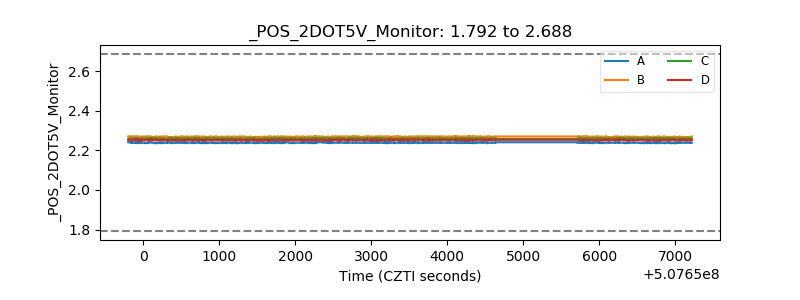 |
| +5 Volts monitor | 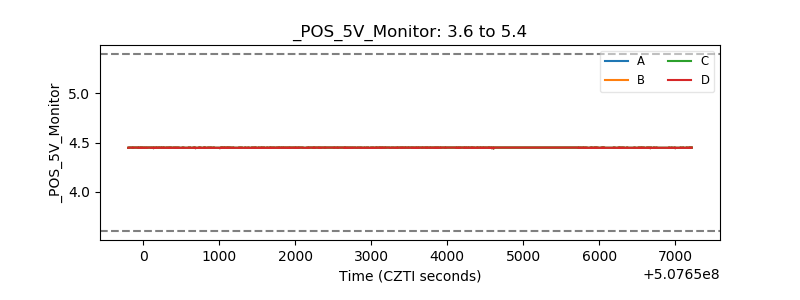 |
| _ROLL_ROT | 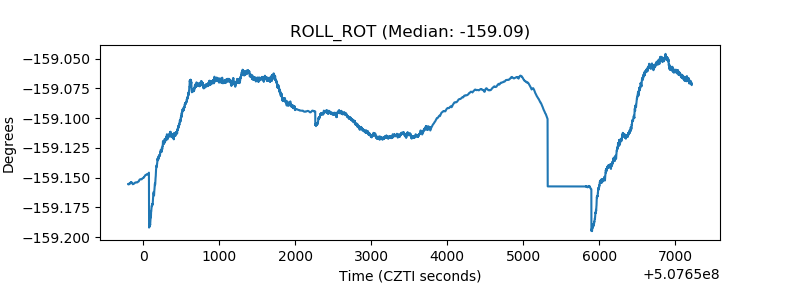 |
| _Roll_DEC | 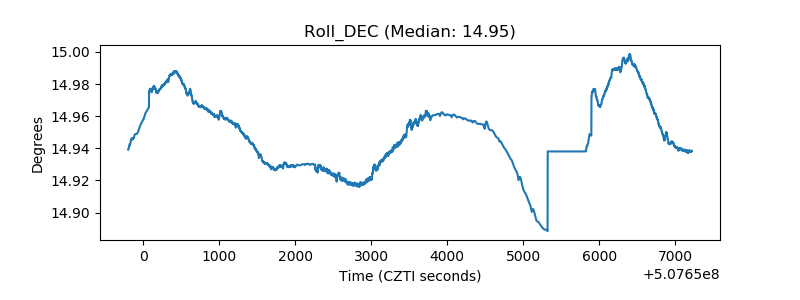 |
| _Roll_RA | 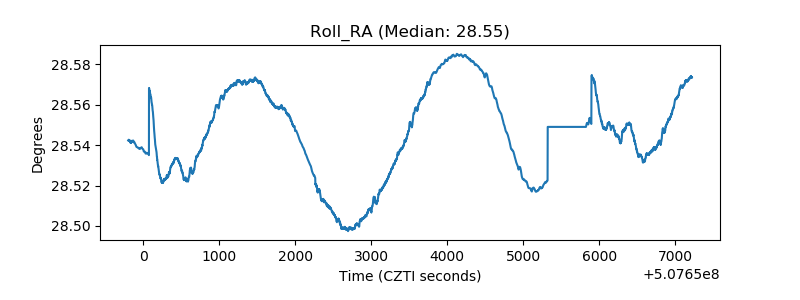 |
| Veto Counter | 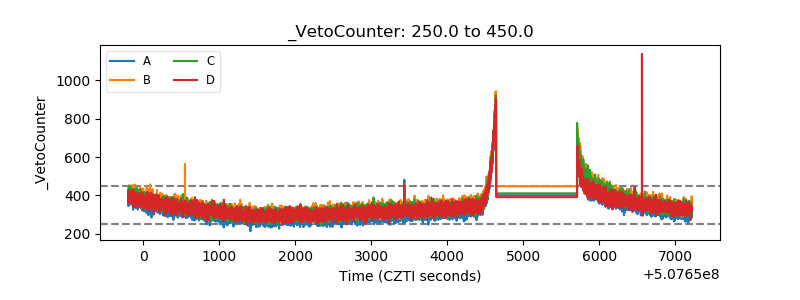 |