| Param | Original file | Final file |
|---|---|---|
| Filename | modeM0/AS1A14_066T02_9000006546_55983cztM0_level2.fits | modeM0/AS1A14_066T02_9000006546_55983cztM0_level2_quad_clean.evt |
| Size (bytes) | 404,265,600 | 92,868,480 |
| Size | 385.5 MB | 88.6 MB |
| Events in quadrant A | 3,944,461 | 606,606 |
| Events in quadrant B | 3,413,079 | 654,710 |
| Events in quadrant C | 3,284,981 | 576,070 |
| Events in quadrant D | 3,833,045 | 535,791 |
| Mode M9 | |||
|---|---|---|---|
| Quadrant | BADHDUFLAG | Total packets | Discarded packets |
| A | 0 | 11 | 0 |
| B | 0 | 11 | 0 |
| C | 0 | 11 | 0 |
| D | 0 | 11 | 0 |
| Mode M0 | |||
|---|---|---|---|
| Quadrant | BADHDUFLAG | Total packets | Discarded packets |
| A | 0 | 16173 | 1 |
| B | 0 | 14622 | 1 |
| C | 0 | 14637 | 1 |
| D | 0 | 15852 | 1 |
| Mode SS | |||
|---|---|---|---|
| Quadrant | BADHDUFLAG | Total packets | Discarded packets |
| A | 0 | 128 | 0 |
| B | 0 | 128 | 0 |
| C | 0 | 128 | 0 |
| D | 0 | 128 | 0 |
| Quadrant | Total seconds | Saturated seconds | Saturation percentage |
|---|---|---|---|
| A | 6286 | 208 | 3.308941% |
| B | 6286 | 76 | 1.209036% |
| C | 6286 | 137 | 2.179446% |
| D | 6286 | 203 | 3.229399% |
Noise dominated data is calculated using 1-second bins in cleaned event files. If a bin has >2000 counts, and if more than 50% of those come from <1% of pixels, then it is considered to be noise-dominated and hence unusable.
| Quadrant | # 1 sec bins | Bins with >0 counts | Bins with >2000 counts | High rate bins dominated by noise | Noise dominated (total time) | Noise dominated (detector-on time) | Marked lightcurve |
|---|---|---|---|---|---|---|---|
| A | 7436 | 6287 | 184 | 184 | 2.47% | 2.93% | 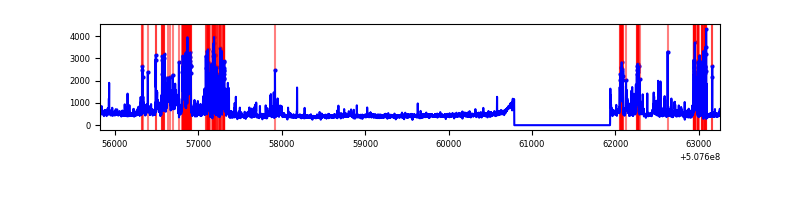 |
| B | 7436 | 6287 | 17 | 17 | 0.23% | 0.27% | 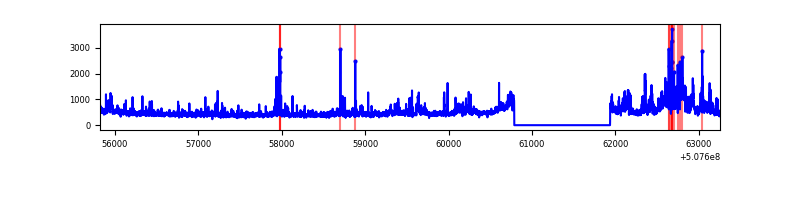 |
| C | 7436 | 6286 | 114 | 114 | 1.53% | 1.81% | 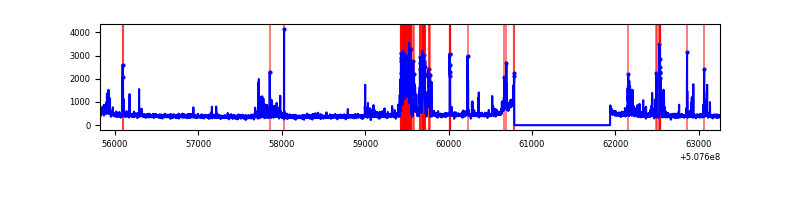 |
| D | 7436 | 6286 | 147 | 147 | 1.98% | 2.34% | 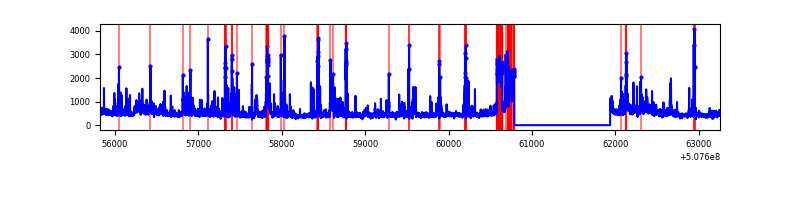 |
Top three noisy pixels from each quadrant. If the there are fewer than three noisy pixels in the level2.evt file, extra rows are filled as -1
| Pixel properties | Quadrant properties | ||||||
|---|---|---|---|---|---|---|---|
| Quadrant | DetID | PixID | Counts | Sigma | Mean | Median | Sigma |
| A | 7 | 64 | 531733 | 3167.44 | 672 | 654 | 167.7 |
| A | 15 | 32 | 226687 | 1348.1 | 672 | 654 | 167.7 |
| A | 8 | 249 | 202238 | 1202.28 | 672 | 654 | 167.7 |
| B | 5 | 172 | 282232 | 1949.31 | 670 | 646 | 144.5 |
| B | 0 | 199 | 115677 | 796.31 | 670 | 646 | 144.5 |
| B | 0 | 171 | 92775 | 637.77 | 670 | 646 | 144.5 |
| C | 14 | 80 | 614884 | 3388.08 | 653 | 646 | 181.3 |
| C | 6 | 223 | 44834 | 243.73 | 653 | 646 | 181.3 |
| C | 2 | 12 | 36298 | 196.65 | 653 | 646 | 181.3 |
| D | 11 | 129 | 514506 | 2796.06 | 644 | 615 | 183.8 |
| D | 2 | 249 | 197770 | 1072.71 | 644 | 615 | 183.8 |
| D | 14 | 52 | 118471 | 641.25 | 644 | 615 | 183.8 |
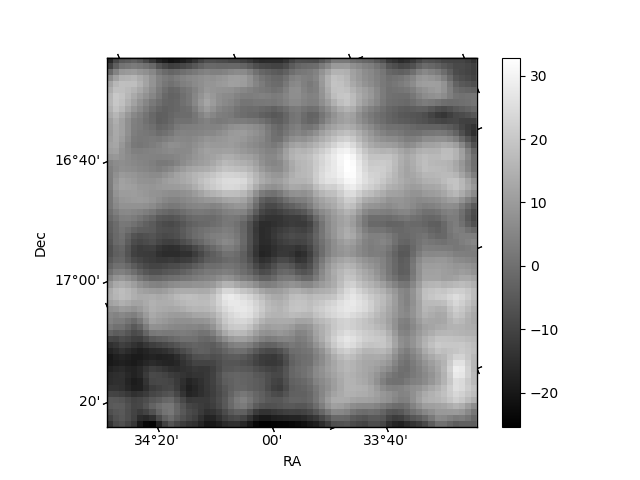
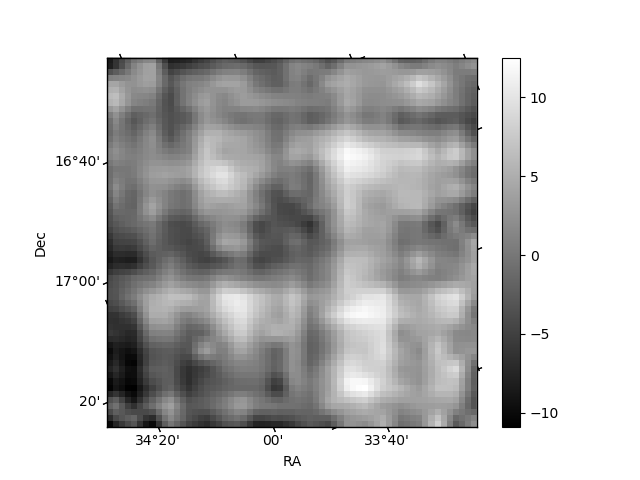
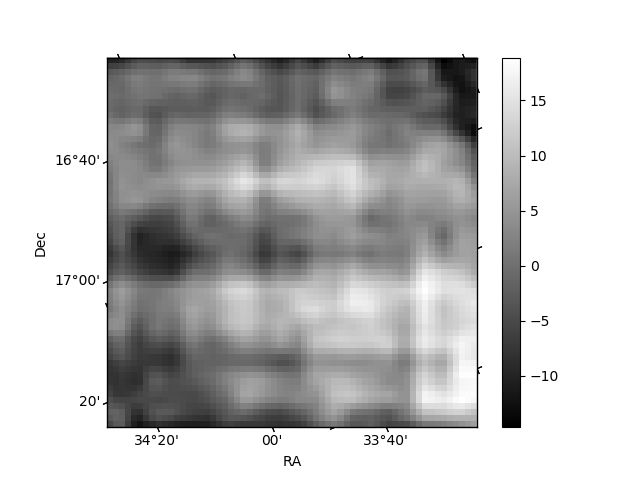
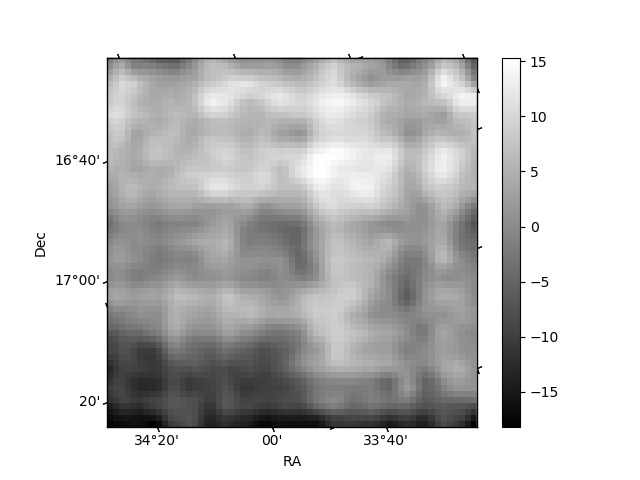
Histogram calculated using DETX and DETY for each event in the final _common_clean file
| Quadrant A | 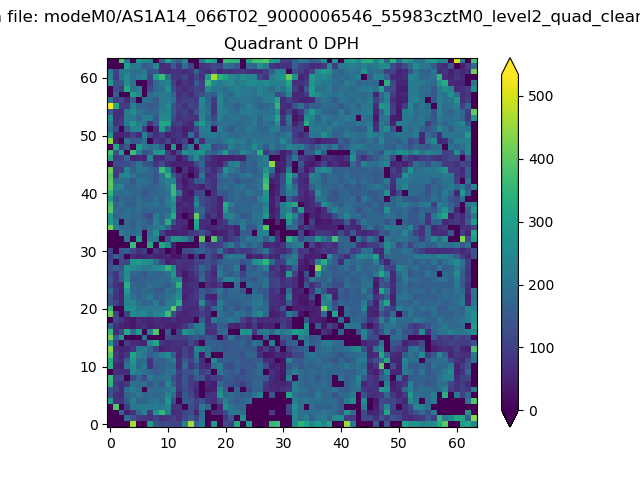 |
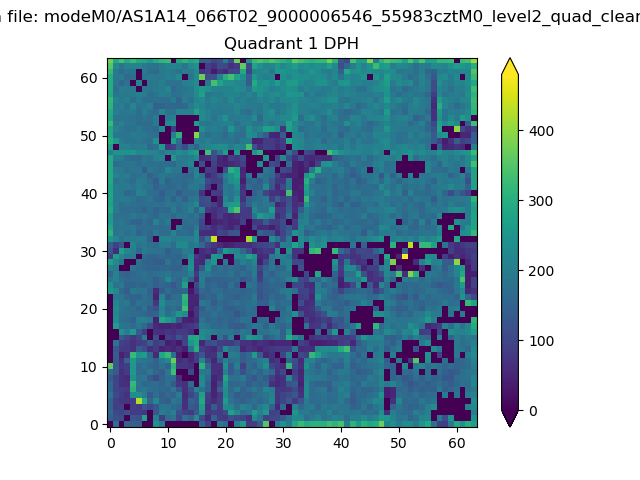 |
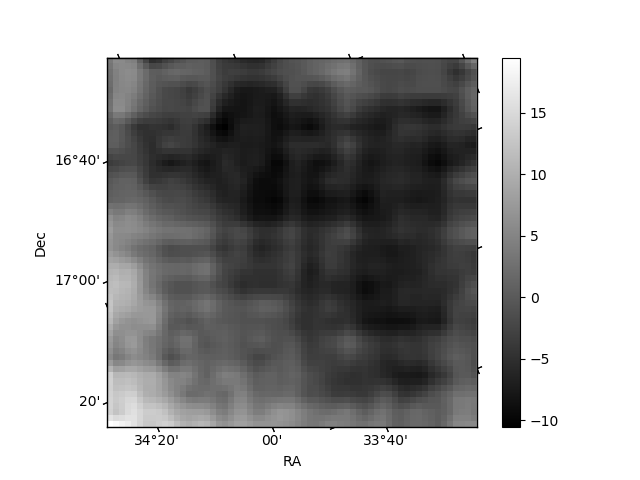
Quadrant B |
|---|---|---|---|
| Quadrant D | 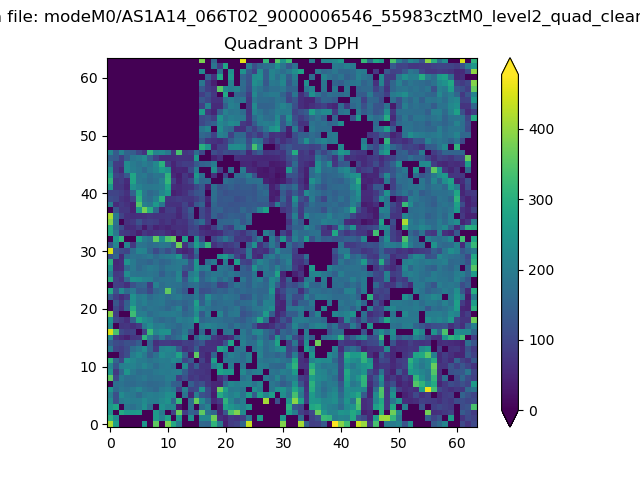 |
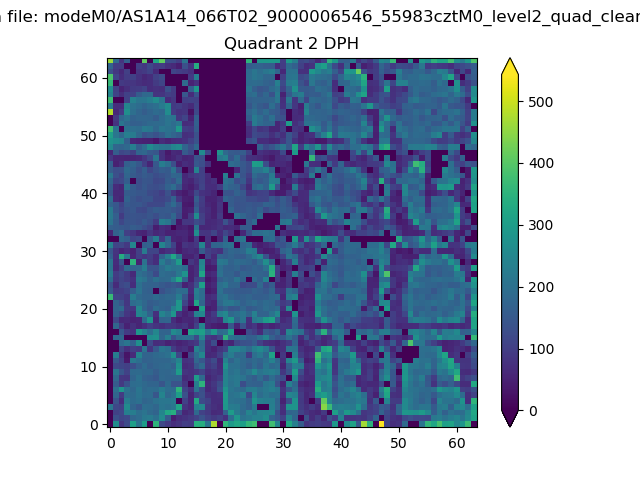 |
Quadrant C |
| Plot type | Count rate plots | Images |
|---|---|---|
| Comparison with Poisson distribution Blue bars denote a histogram of data divided into 1 sec bins. Red curve is a Poisson curve with rate = median count rate of data. |
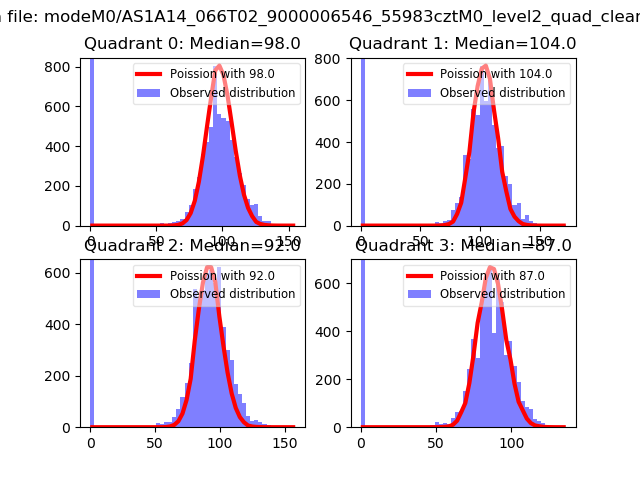 |
 |
| Quadrant-wise count rates Data is divided into 100 sec bins |
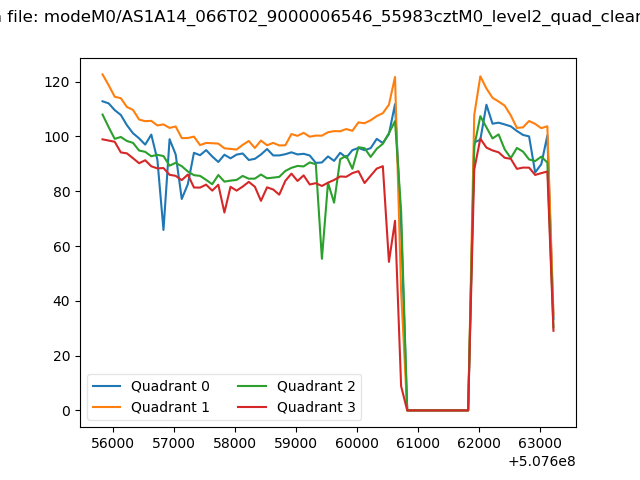 |
|
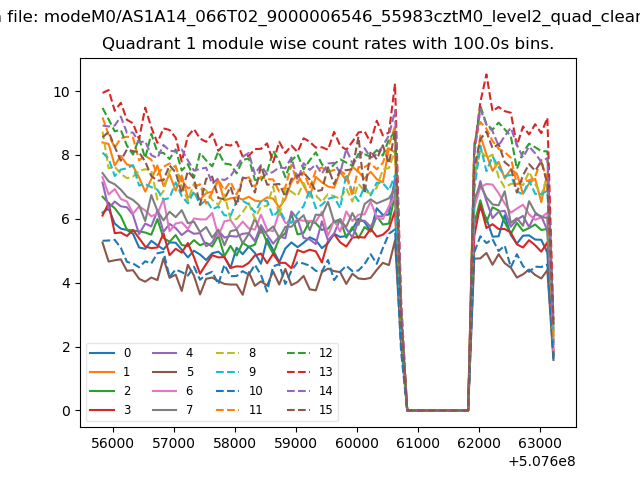
| Module-wise count rates for Quadrant A Data is divided into 100 sec bins |
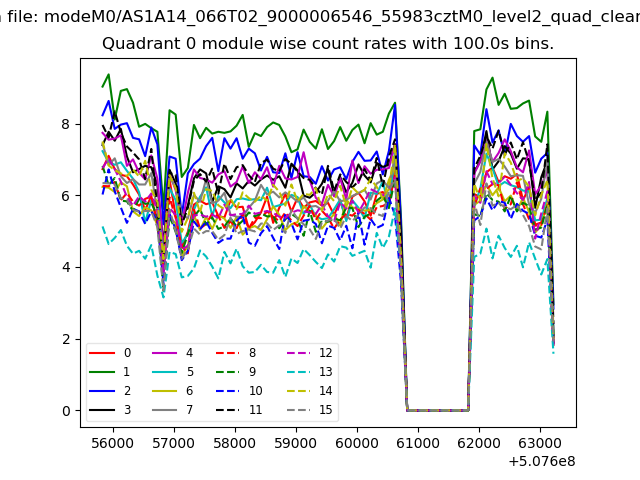 |
 |
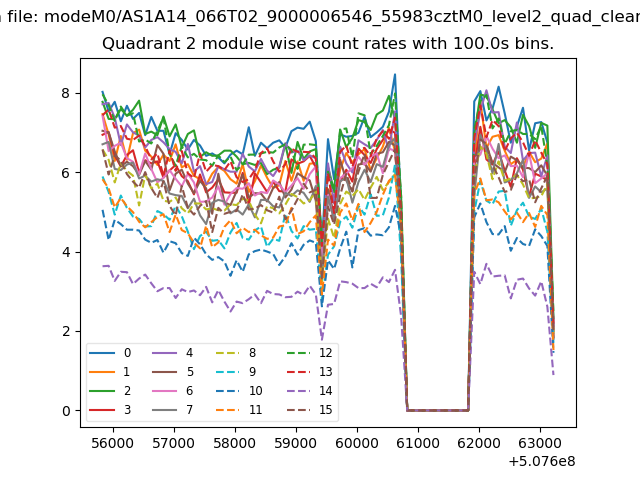
| Module-wise count rates for Quadrant B Data is divided into 100 sec bins |
 |
 |
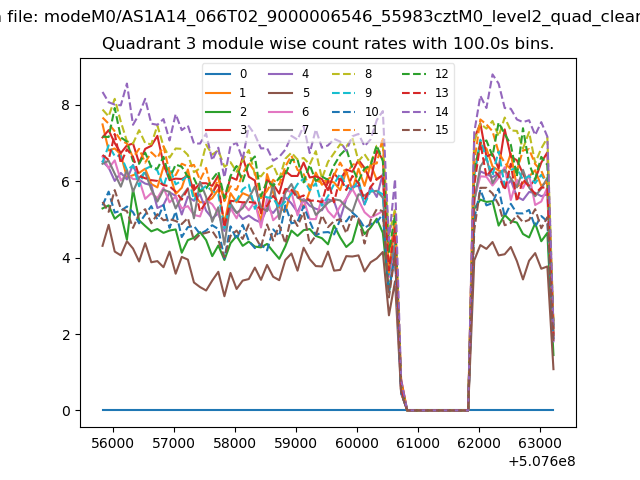
| Module-wise count rates for Quadrant C Data is divided into 100 sec bins |
 |
 |
| Module-wise count rates for Quadrant D Data is divided into 100 sec bins |
 |
 |
| Parameter | Plot |
|---|---|
| CZT HV Monitor | 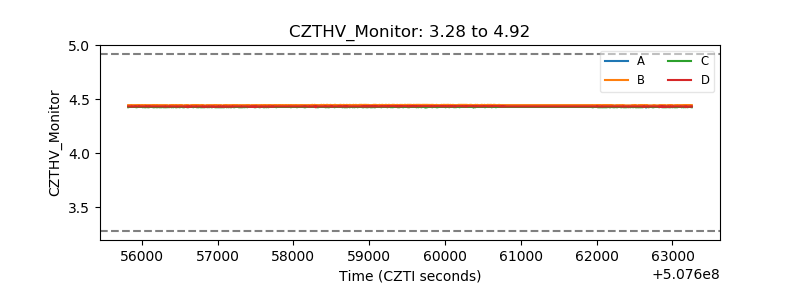 |
| D_VDD | 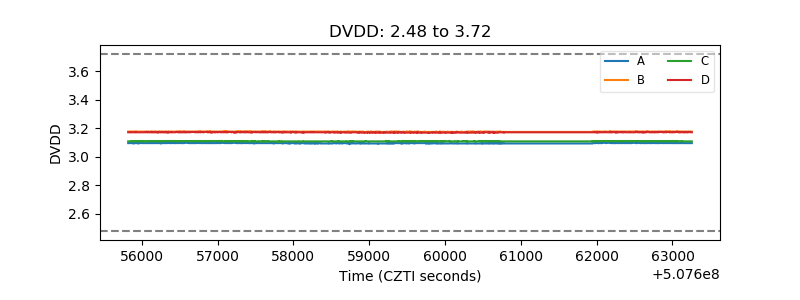 |
| Temperature 1 | 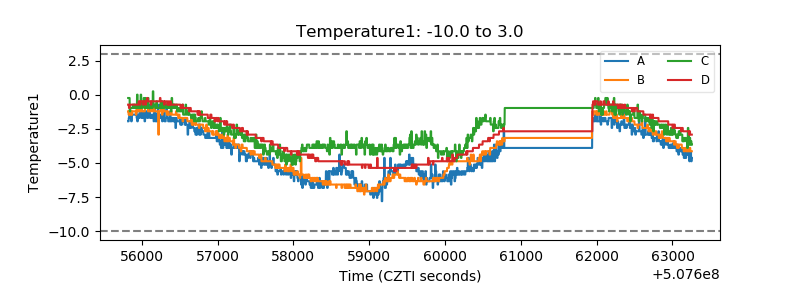 |
| Veto HV Monitor | 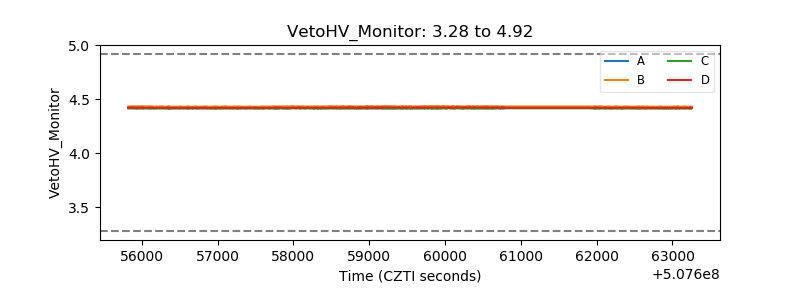 |
| Veto LLD | 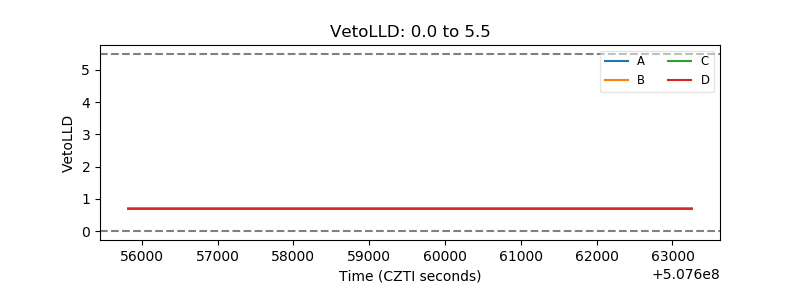 |
| Alpha Counter | 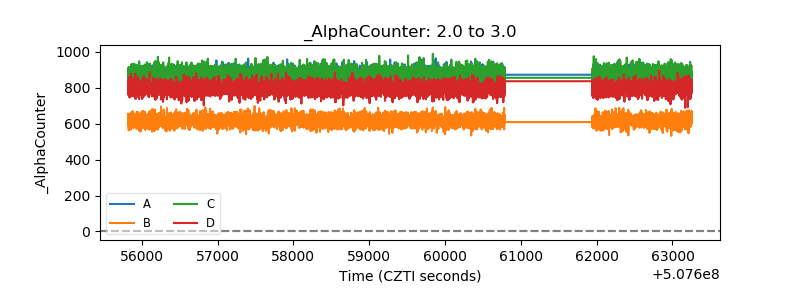 |
| _CPM_Rate | 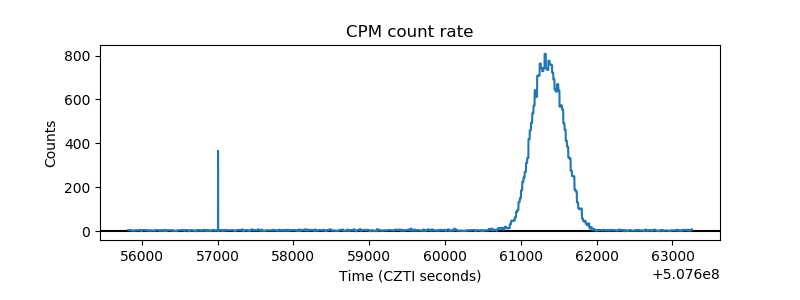 |
| CZT Counter | 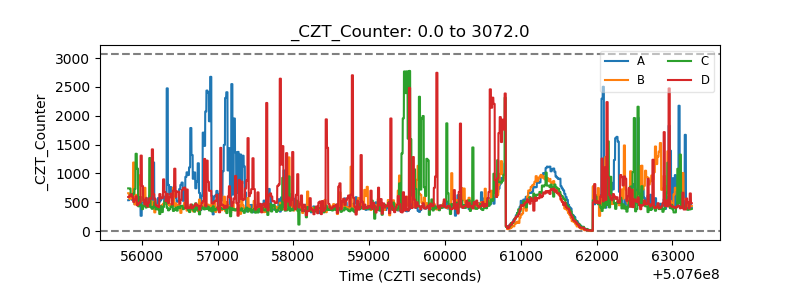 |
| +2.5 Volts monitor |  |
| +5 Volts monitor | 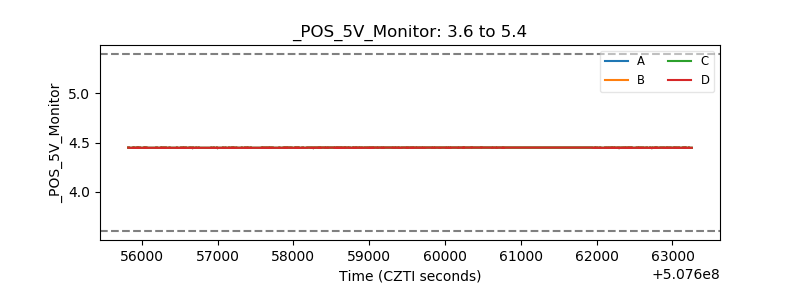 |
| _ROLL_ROT | 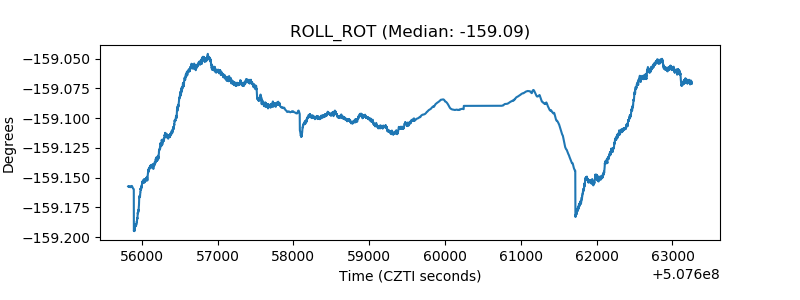 |
| _Roll_DEC | 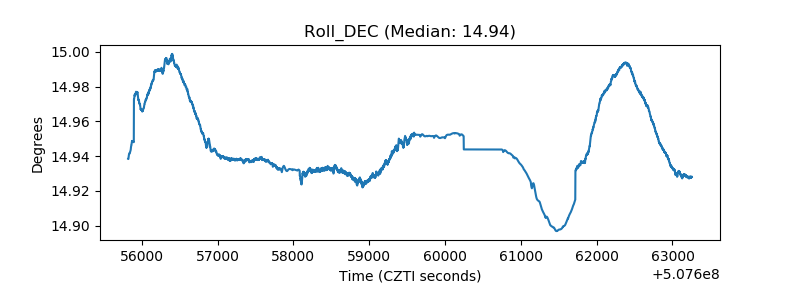 |
| _Roll_RA | 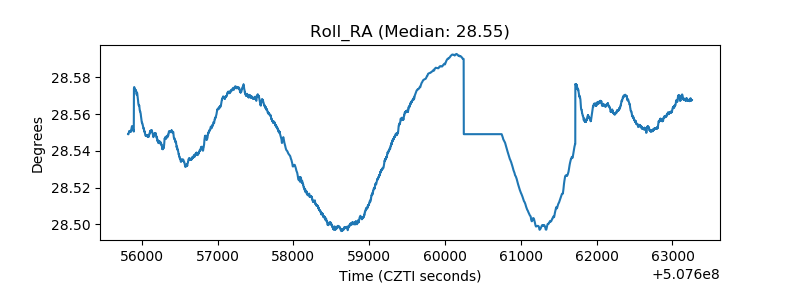 |
| Veto Counter | 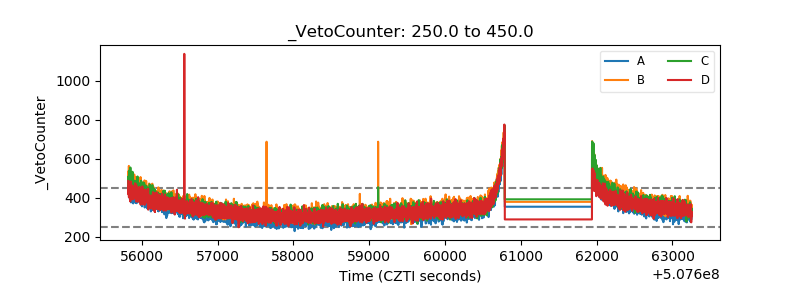 |