| Param | Original file | Final file |
|---|---|---|
| Filename | modeM0/AS1A14_066T02_9000006546_55984cztM0_level2.fits | modeM0/AS1A14_066T02_9000006546_55984cztM0_level2_quad_clean.evt |
| Size (bytes) | 439,398,720 | 94,265,280 |
| Size | 419.0 MB | 89.9 MB |
| Events in quadrant A | 4,517,056 | 598,391 |
| Events in quadrant B | 4,600,288 | 653,540 |
| Events in quadrant C | 3,140,037 | 595,782 |
| Events in quadrant D | 3,509,515 | 558,830 |
| Mode M9 | |||
|---|---|---|---|
| Quadrant | BADHDUFLAG | Total packets | Discarded packets |
| A | 0 | 22 | 0 |
| B | 0 | 22 | 0 |
| C | 0 | 22 | 0 |
| D | 0 | 22 | 0 |
| Mode M0 | |||
|---|---|---|---|
| Quadrant | BADHDUFLAG | Total packets | Discarded packets |
| A | 0 | 17951 | 8 |
| B | 0 | 18114 | 2 |
| C | 0 | 14104 | 2 |
| D | 0 | 15026 | 2 |
| Mode SS | |||
|---|---|---|---|
| Quadrant | BADHDUFLAG | Total packets | Discarded packets |
| A | 0 | 134 | 0 |
| B | 0 | 134 | 0 |
| C | 0 | 134 | 0 |
| D | 0 | 134 | 0 |
| Quadrant | Total seconds | Saturated seconds | Saturation percentage |
|---|---|---|---|
| A | 6411 | 395 | 6.161285% |
| B | 6411 | 294 | 4.585868% |
| C | 6411 | 51 | 0.795508% |
| D | 6412 | 74 | 1.154086% |
Noise dominated data is calculated using 1-second bins in cleaned event files. If a bin has >2000 counts, and if more than 50% of those come from <1% of pixels, then it is considered to be noise-dominated and hence unusable.
| Quadrant | # 1 sec bins | Bins with >0 counts | Bins with >2000 counts | High rate bins dominated by noise | Noise dominated (total time) | Noise dominated (detector-on time) | Marked lightcurve |
|---|---|---|---|---|---|---|---|
| A | 8706 | 6413 | 323 | 323 | 3.71% | 5.04% | 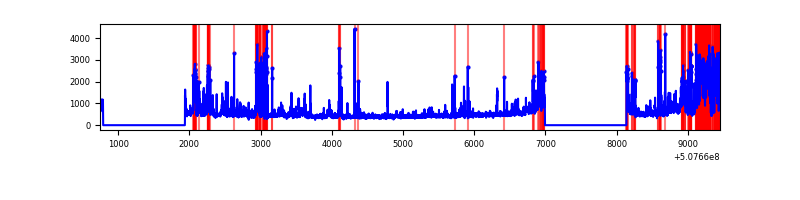 |
| B | 8706 | 6413 | 225 | 225 | 2.58% | 3.51% | 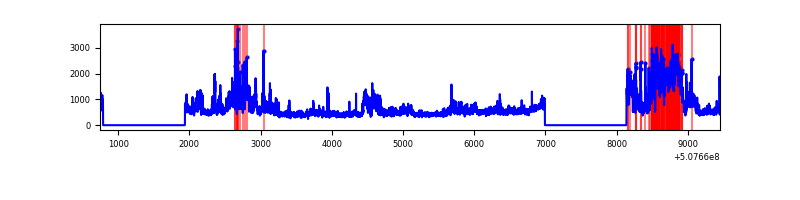 |
| C | 8706 | 6412 | 31 | 31 | 0.36% | 0.48% | 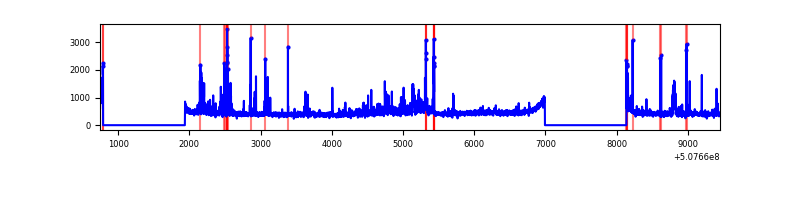 |
| D | 8707 | 6413 | 39 | 39 | 0.45% | 0.61% | 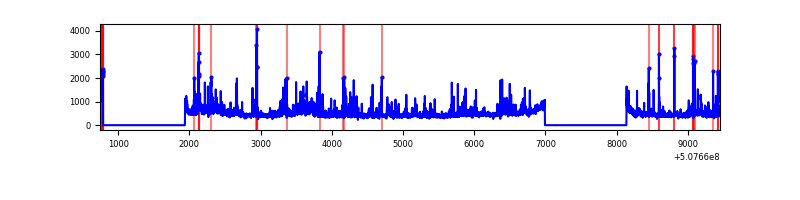 |
Top three noisy pixels from each quadrant. If the there are fewer than three noisy pixels in the level2.evt file, extra rows are filled as -1
| Pixel properties | Quadrant properties | ||||||
|---|---|---|---|---|---|---|---|
| Quadrant | DetID | PixID | Counts | Sigma | Mean | Median | Sigma |
| A | 12 | 115 | 718194 | 4212.36 | 684 | 667 | 170.3 |
| A | 15 | 32 | 460140 | 2697.41 | 684 | 667 | 170.3 |
| A | 7 | 64 | 190335 | 1113.48 | 684 | 667 | 170.3 |
| B | 5 | 172 | 1478555 | 10105.06 | 687 | 662 | 146.3 |
| B | 0 | 171 | 99569 | 676.27 | 687 | 662 | 146.3 |
| B | 0 | 199 | 77372 | 524.5 | 687 | 662 | 146.3 |
| C | 12 | 252 | 225244 | 1187.76 | 680 | 672 | 189.1 |
| C | 14 | 80 | 134081 | 705.6 | 680 | 672 | 189.1 |
| C | 9 | 38 | 62013 | 324.43 | 680 | 672 | 189.1 |
| D | 11 | 129 | 419782 | 2166.52 | 672 | 643 | 193.5 |
| D | 2 | 249 | 133999 | 689.31 | 672 | 643 | 193.5 |
| D | 6 | 239 | 49547 | 252.78 | 672 | 643 | 193.5 |
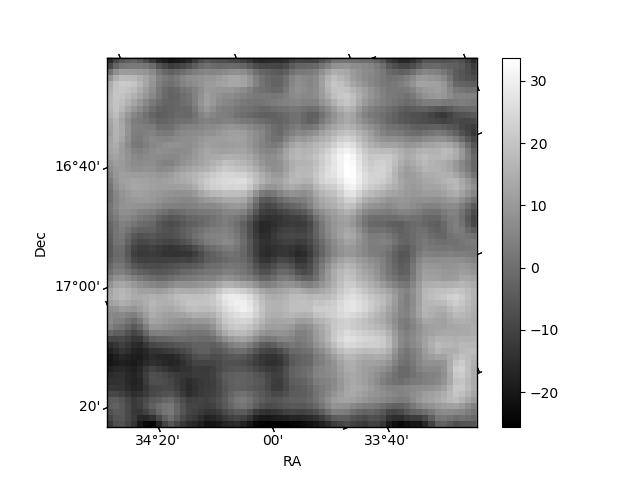
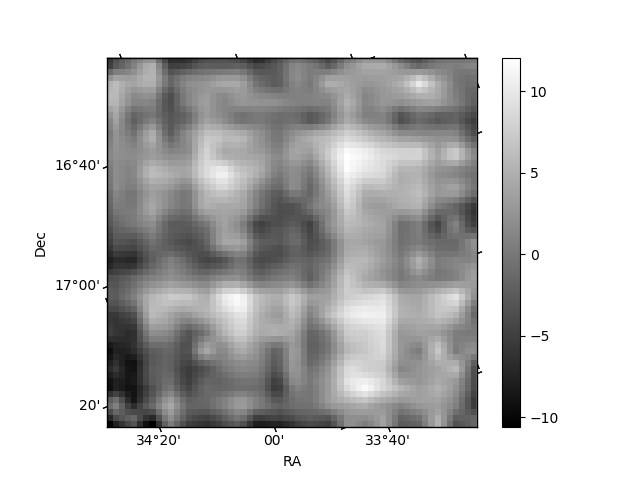
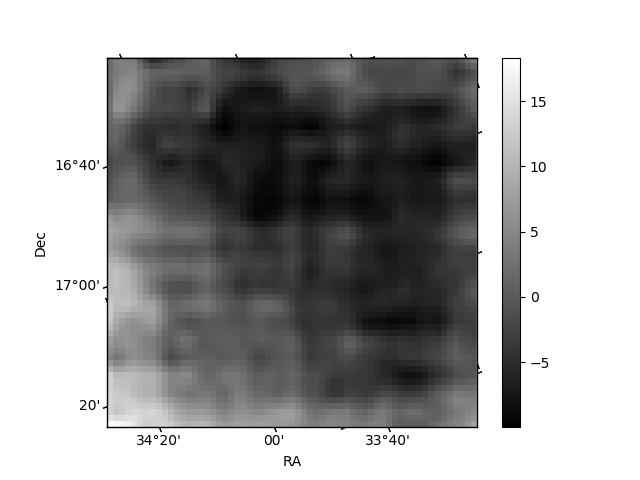
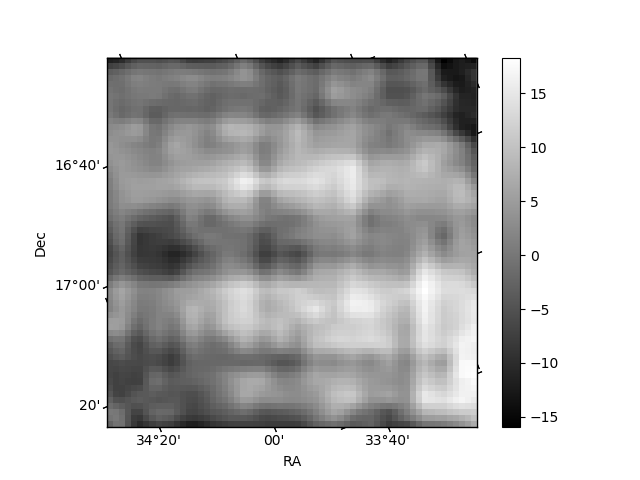
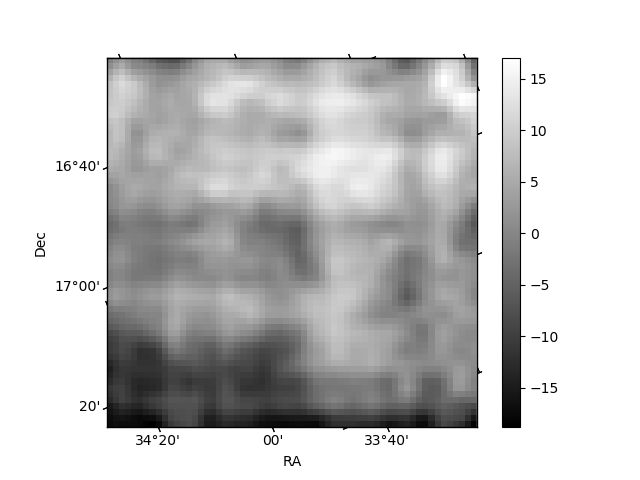
Histogram calculated using DETX and DETY for each event in the final _common_clean file
| Quadrant A | 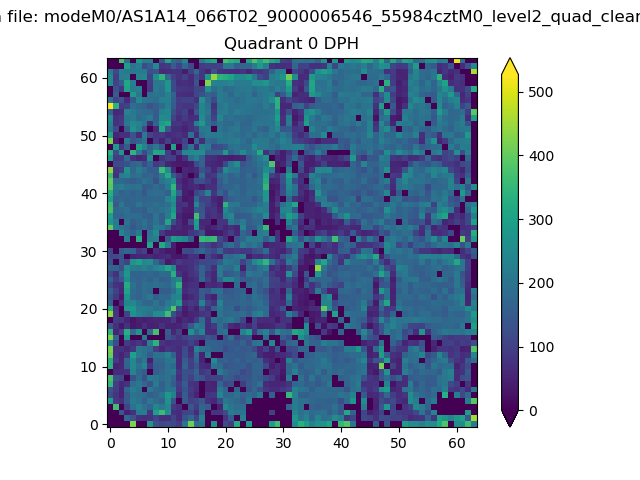 |
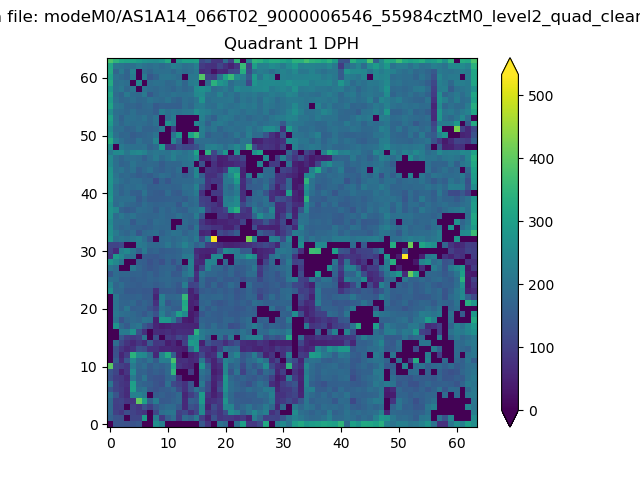 |
Quadrant B |
|---|---|---|---|
| Quadrant D | 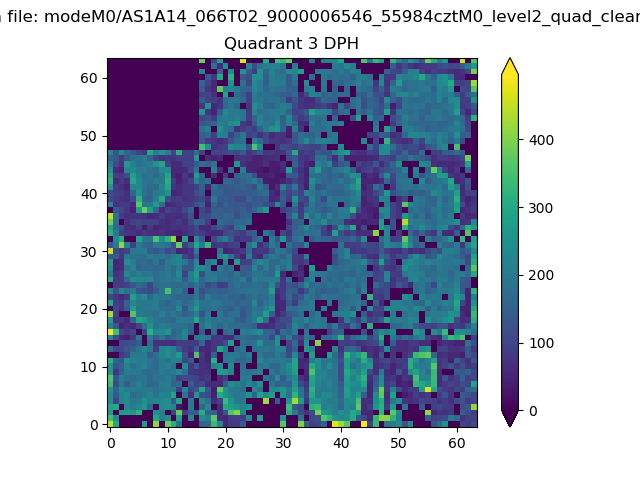 |
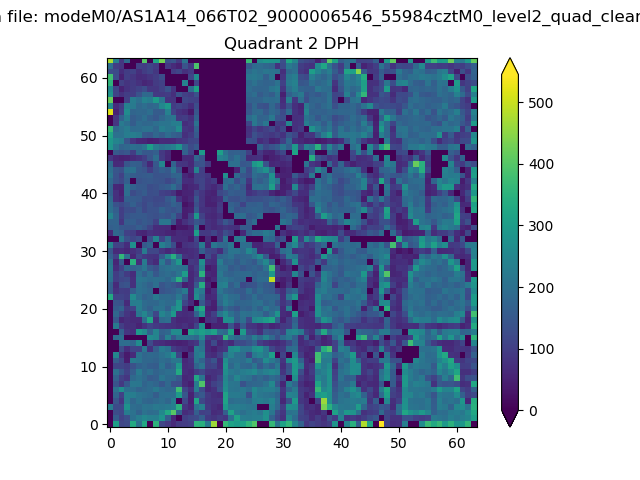 |
Quadrant C |
| Plot type | Count rate plots | Images |
|---|---|---|
| Comparison with Poisson distribution Blue bars denote a histogram of data divided into 1 sec bins. Red curve is a Poisson curve with rate = median count rate of data. |
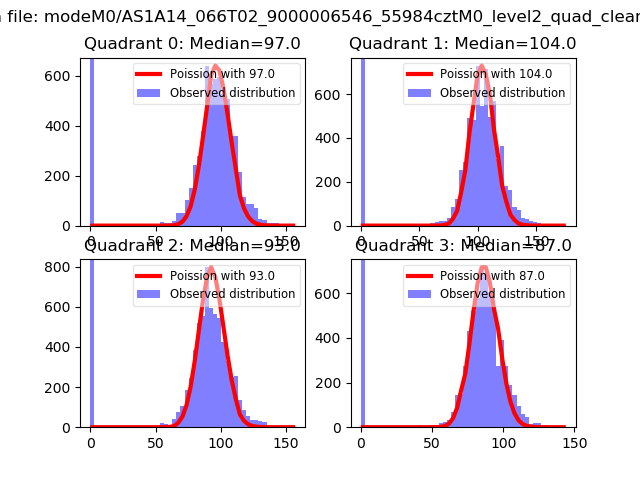 |
 |
| Quadrant-wise count rates Data is divided into 100 sec bins |
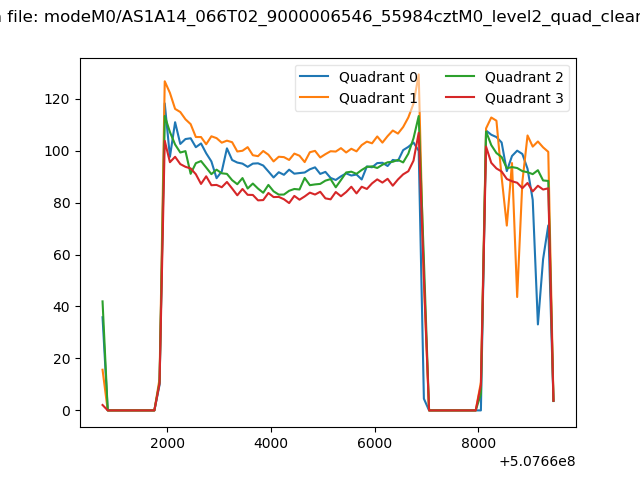 |
|
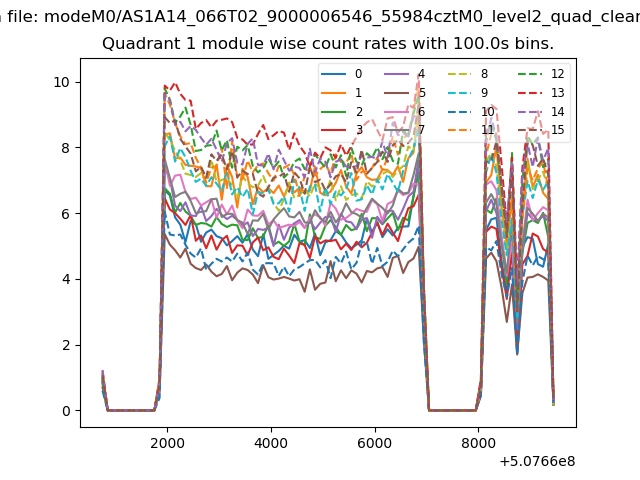
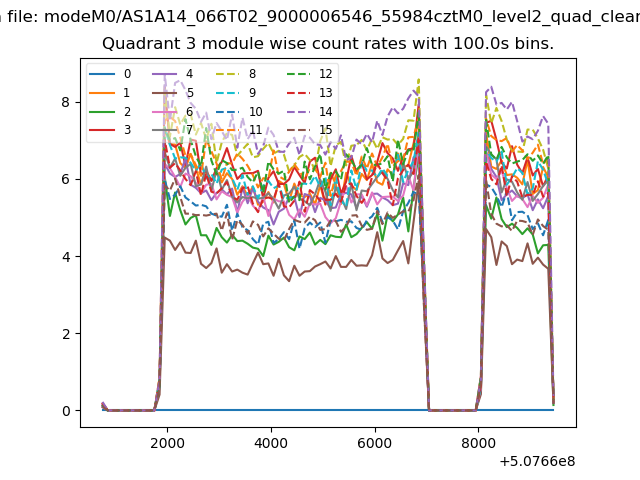
| Module-wise count rates for Quadrant A Data is divided into 100 sec bins |
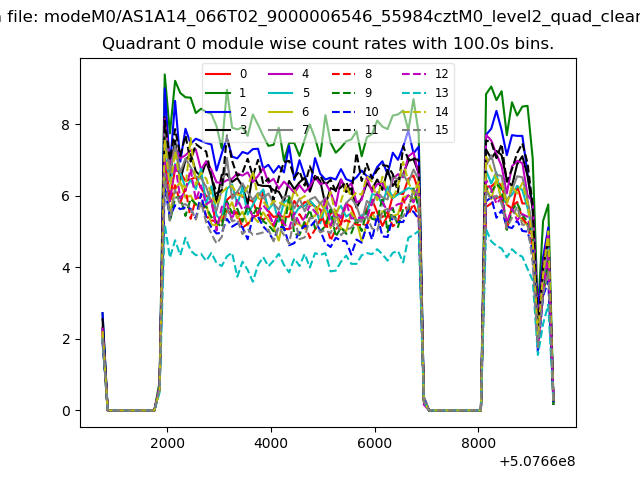 |
 |
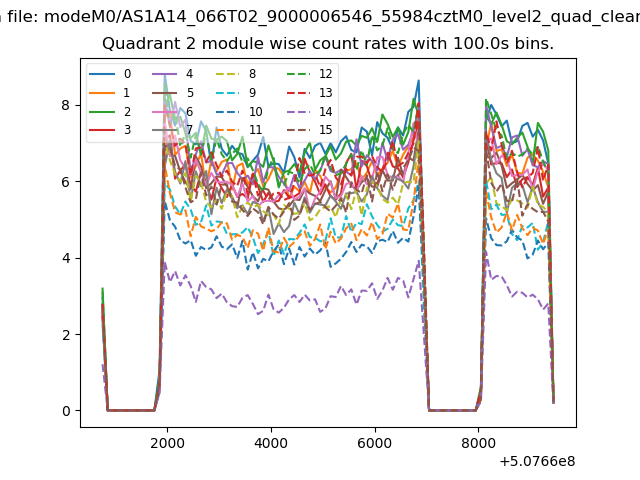
| Module-wise count rates for Quadrant B Data is divided into 100 sec bins |
 |
 |
| Module-wise count rates for Quadrant C Data is divided into 100 sec bins |
 |
 |
| Module-wise count rates for Quadrant D Data is divided into 100 sec bins |
 |
 |
| Parameter | Plot |
|---|---|
| CZT HV Monitor | 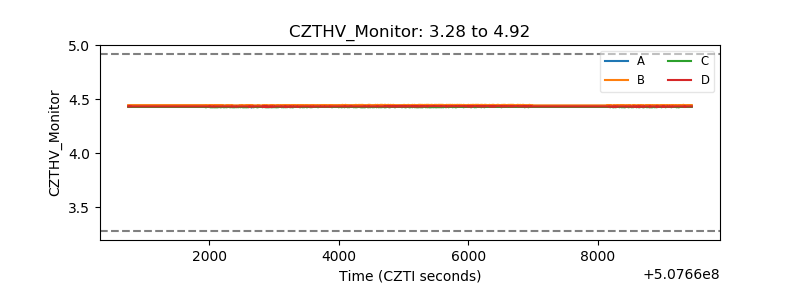 |
| D_VDD | 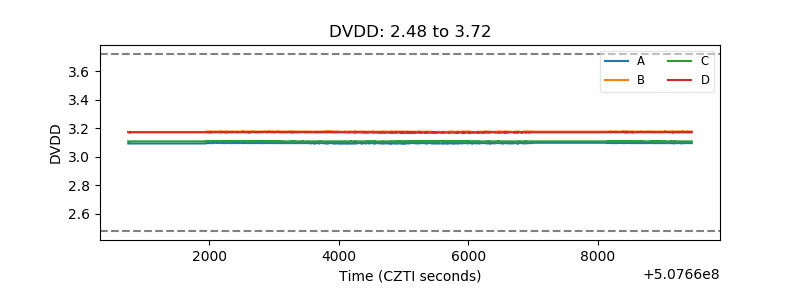 |
| Temperature 1 | 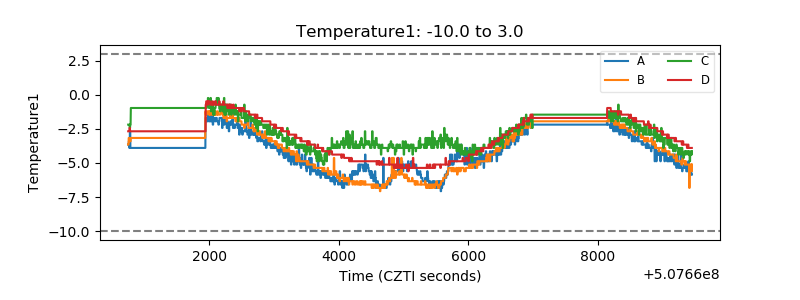 |
| Veto HV Monitor | 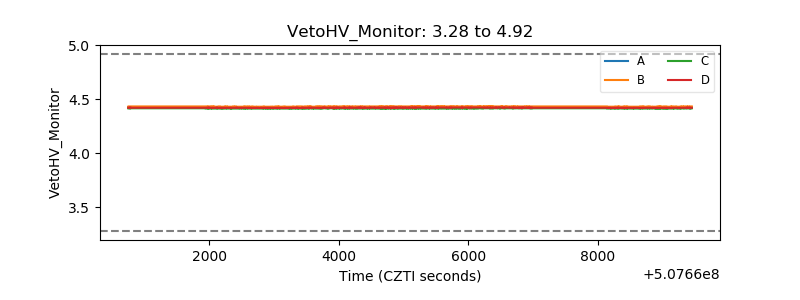 |
| Veto LLD | 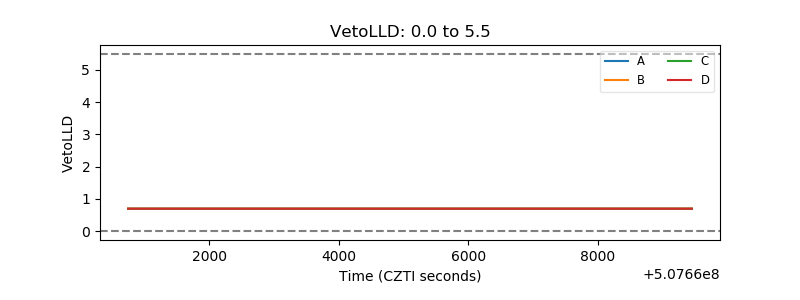 |
| Alpha Counter | 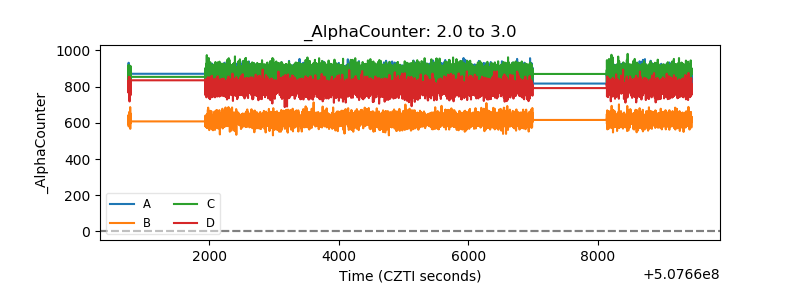 |
| _CPM_Rate | 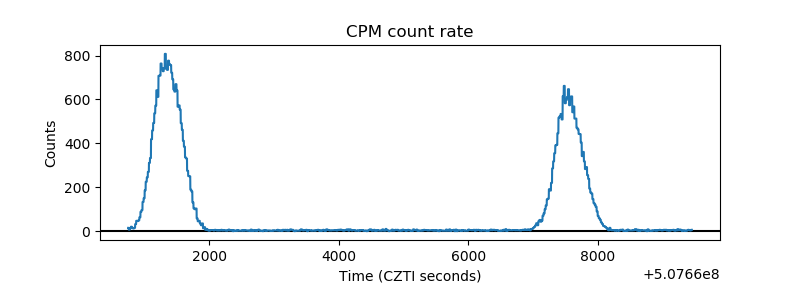 |
| CZT Counter | 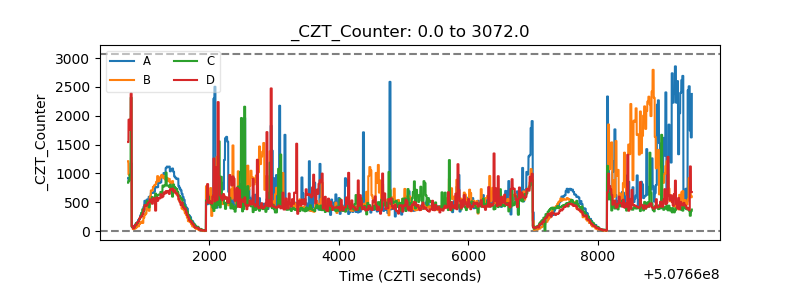 |
| +2.5 Volts monitor |  |
| +5 Volts monitor |  |
| _ROLL_ROT | 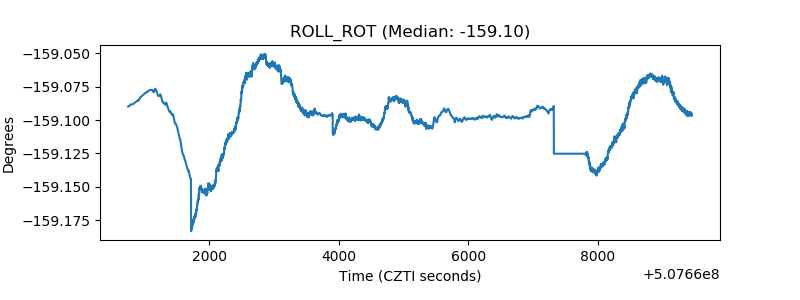 |
| _Roll_DEC | 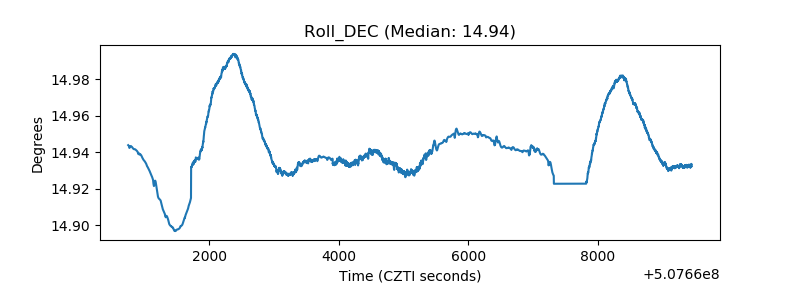 |
| _Roll_RA | 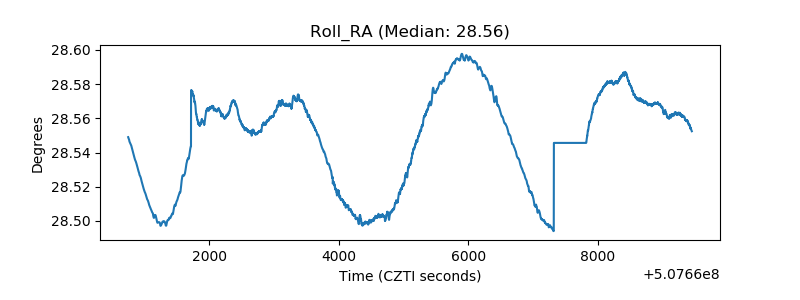 |
| Veto Counter | 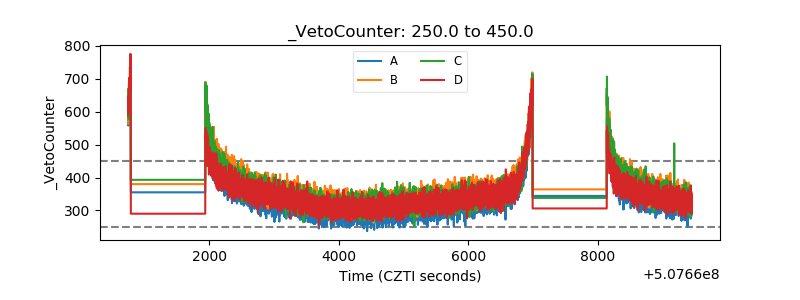 |