| Param | Original file | Final file |
|---|---|---|
| Filename | modeM0/AS1A14_066T02_9000006546_55987cztM0_level2.fits | modeM0/AS1A14_066T02_9000006546_55987cztM0_level2_quad_clean.evt |
| Size (bytes) | 468,164,160 | 114,552,000 |
| Size | 446.5 MB | 109.2 MB |
| Events in quadrant A | 4,303,746 | 732,546 |
| Events in quadrant B | 4,182,000 | 789,946 |
| Events in quadrant C | 3,965,581 | 714,936 |
| Events in quadrant D | 4,256,090 | 674,927 |
| Mode M9 | |||
|---|---|---|---|
| Quadrant | BADHDUFLAG | Total packets | Discarded packets |
| A | 0 | 12 | 0 |
| B | 0 | 12 | 0 |
| C | 0 | 12 | 0 |
| D | 0 | 12 | 0 |
| Mode M0 | |||
|---|---|---|---|
| Quadrant | BADHDUFLAG | Total packets | Discarded packets |
| A | 0 | 18338 | 2 |
| B | 0 | 17945 | 2 |
| C | 0 | 17856 | 2 |
| D | 0 | 18527 | 2 |
| Mode SS | |||
|---|---|---|---|
| Quadrant | BADHDUFLAG | Total packets | Discarded packets |
| A | 0 | 164 | 0 |
| B | 0 | 164 | 0 |
| C | 0 | 164 | 0 |
| D | 0 | 164 | 0 |
| Quadrant | Total seconds | Saturated seconds | Saturation percentage |
|---|---|---|---|
| A | 8003 | 258 | 3.223791% |
| B | 8004 | 228 | 2.848576% |
| C | 8004 | 126 | 1.574213% |
| D | 8004 | 139 | 1.736632% |
Noise dominated data is calculated using 1-second bins in cleaned event files. If a bin has >2000 counts, and if more than 50% of those come from <1% of pixels, then it is considered to be noise-dominated and hence unusable.
| Quadrant | # 1 sec bins | Bins with >0 counts | Bins with >2000 counts | High rate bins dominated by noise | Noise dominated (total time) | Noise dominated (detector-on time) | Marked lightcurve |
|---|---|---|---|---|---|---|---|
| A | 9238 | 8006 | 100 | 100 | 1.08% | 1.25% |  |
| B | 9239 | 8006 | 45 | 45 | 0.49% | 0.56% |  |
| C | 9239 | 8007 | 86 | 86 | 0.93% | 1.07% | 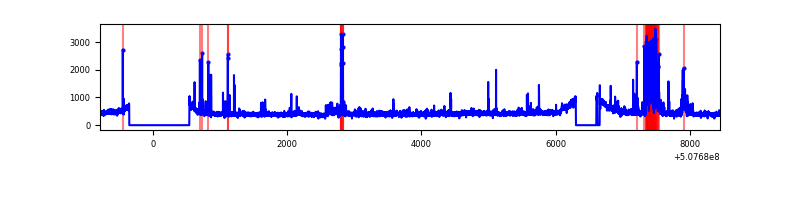 |
| D | 9239 | 8007 | 73 | 73 | 0.79% | 0.91% |  |
Top three noisy pixels from each quadrant. If the there are fewer than three noisy pixels in the level2.evt file, extra rows are filled as -1
| Pixel properties | Quadrant properties | ||||||
|---|---|---|---|---|---|---|---|
| Quadrant | DetID | PixID | Counts | Sigma | Mean | Median | Sigma |
| A | 7 | 64 | 532907 | 2468.89 | 868 | 846 | 215.5 |
| A | 4 | 249 | 93856 | 431.59 | 868 | 846 | 215.5 |
| A | 3 | 14 | 79079 | 363.02 | 868 | 846 | 215.5 |
| B | 2 | 249 | 286345 | 1528.8 | 868 | 833 | 186.8 |
| B | 0 | 229 | 106844 | 567.65 | 868 | 833 | 186.8 |
| B | 0 | 171 | 92621 | 491.49 | 868 | 833 | 186.8 |
| C | 15 | 230 | 344577 | 1468.73 | 857 | 849 | 234.0 |
| C | 1 | 16 | 58782 | 247.54 | 857 | 849 | 234.0 |
| C | 6 | 223 | 46430 | 194.77 | 857 | 849 | 234.0 |
| D | 11 | 129 | 326675 | 1340.24 | 851 | 812 | 243.1 |
| D | 7 | 129 | 121936 | 498.17 | 851 | 812 | 243.1 |
| D | 3 | 12 | 83473 | 339.98 | 851 | 812 | 243.1 |
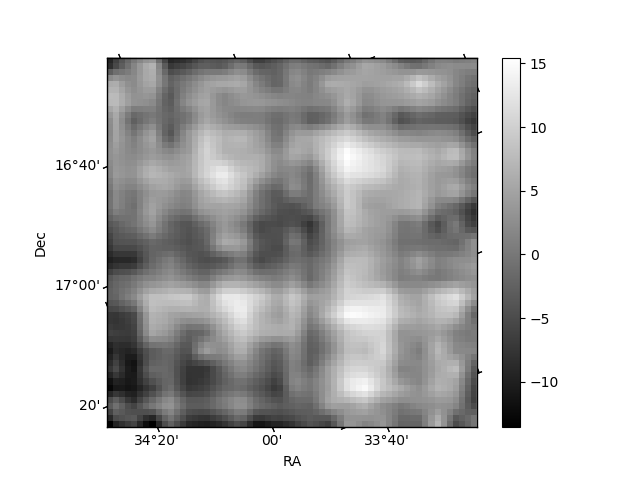
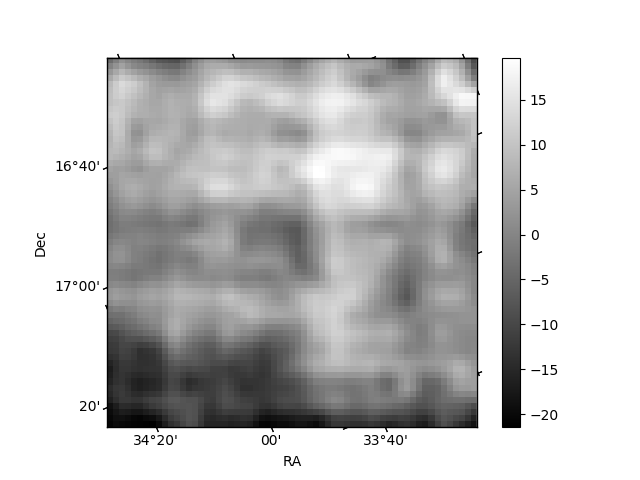
Histogram calculated using DETX and DETY for each event in the final _common_clean file
| Quadrant A | 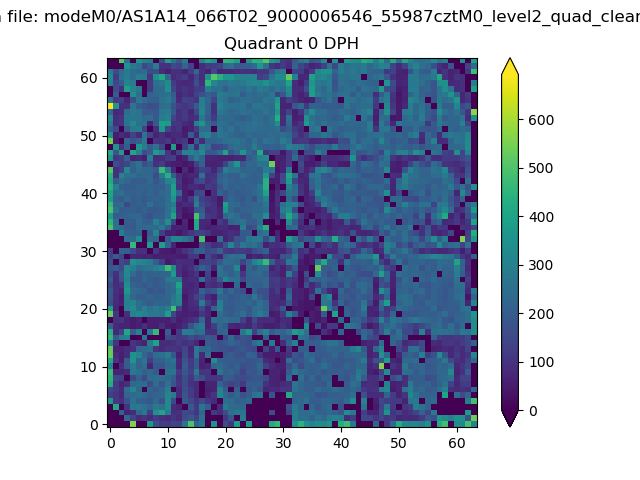 |
 |
Quadrant B |
|---|---|---|---|
| Quadrant D |  |
 |
Quadrant C |
| Plot type | Count rate plots | Images |
|---|---|---|
| Comparison with Poisson distribution Blue bars denote a histogram of data divided into 1 sec bins. Red curve is a Poisson curve with rate = median count rate of data. |
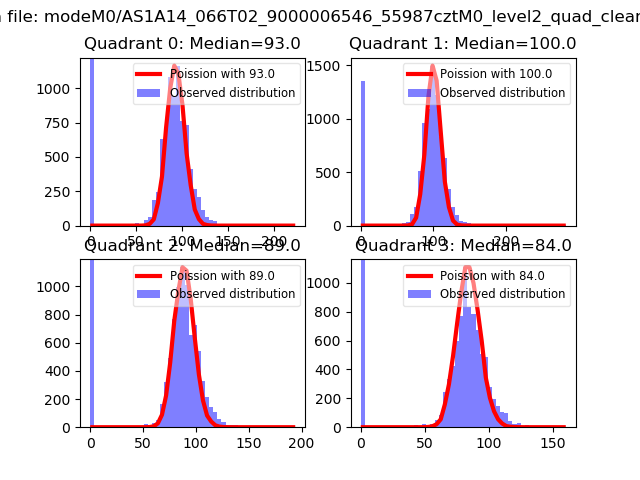 |
 |
| Quadrant-wise count rates Data is divided into 100 sec bins |
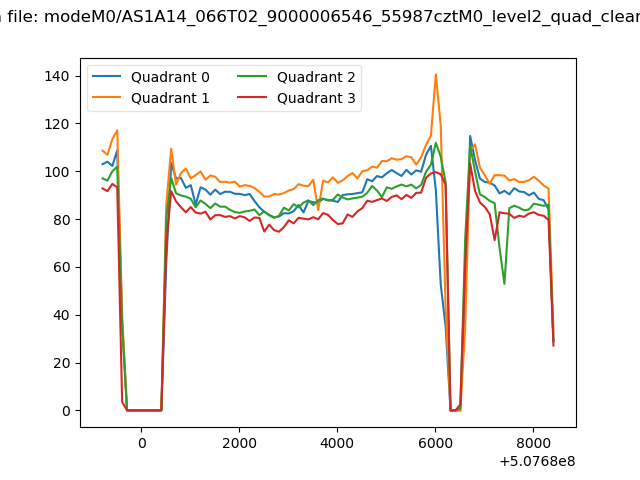 |
|
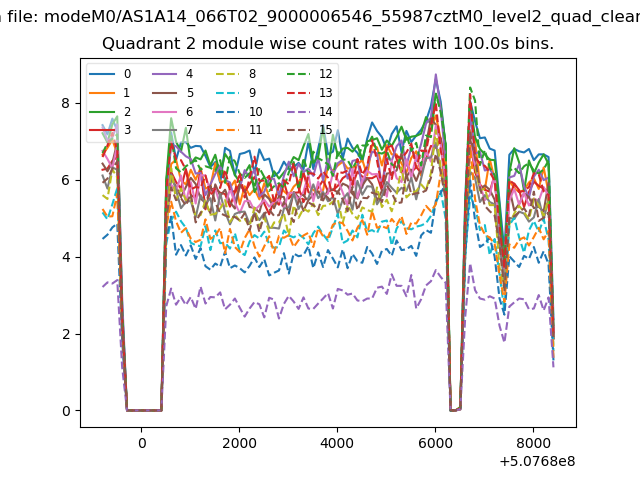
| Module-wise count rates for Quadrant A Data is divided into 100 sec bins |
 |
 |
| Module-wise count rates for Quadrant B Data is divided into 100 sec bins |
 |
 |
| Module-wise count rates for Quadrant C Data is divided into 100 sec bins |
 |
 |
| Module-wise count rates for Quadrant D Data is divided into 100 sec bins |
 |
 |
| Parameter | Plot |
|---|---|
| CZT HV Monitor | 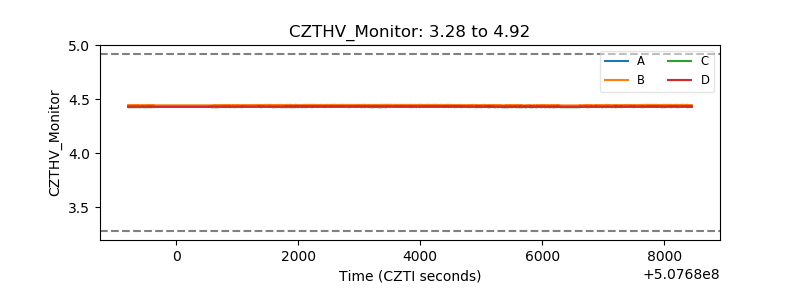 |
| D_VDD |  |
| Temperature 1 | 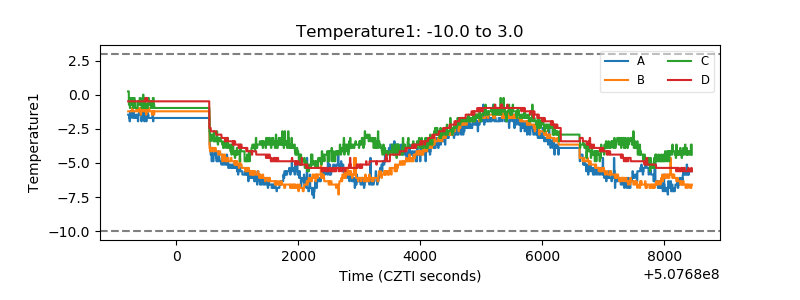 |
| Veto HV Monitor |  |
| Veto LLD |  |
| Alpha Counter | 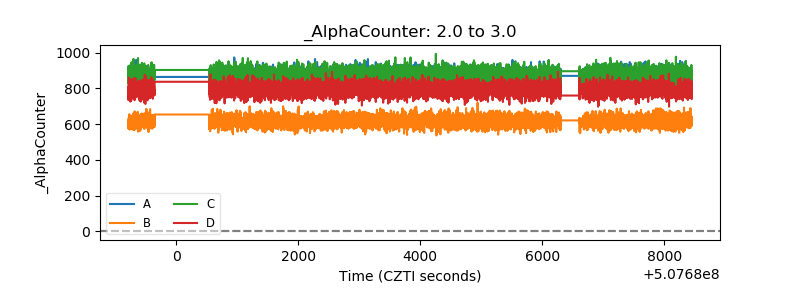 |
| _CPM_Rate |  |
| CZT Counter | 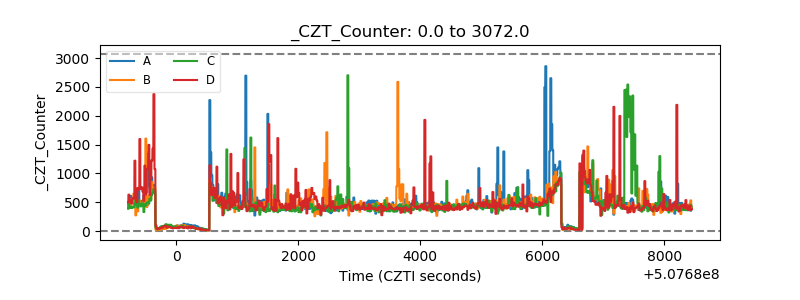 |
| +2.5 Volts monitor |  |
| +5 Volts monitor |  |
| _ROLL_ROT |  |
| _Roll_DEC |  |
| _Roll_RA |  |
| Veto Counter |  |