| Param | Original file | Final file |
|---|---|---|
| Filename | modeM0/AS1A14_066T02_9000006546_55988cztM0_level2.fits | modeM0/AS1A14_066T02_9000006546_55988cztM0_level2_quad_clean.evt |
| Size (bytes) | 428,702,400 | 85,659,840 |
| Size | 408.8 MB | 81.7 MB |
| Events in quadrant A | 4,450,882 | 522,234 |
| Events in quadrant B | 3,420,007 | 571,694 |
| Events in quadrant C | 3,516,431 | 514,509 |
| Events in quadrant D | 3,913,037 | 475,864 |
| Mode M0 | |||
|---|---|---|---|
| Quadrant | BADHDUFLAG | Total packets | Discarded packets |
| A | 0 | 18426 | 0 |
| B | 0 | 15540 | 0 |
| C | 0 | 16133 | 0 |
| D | 0 | 17024 | 0 |
| Mode SS | |||
|---|---|---|---|
| Quadrant | BADHDUFLAG | Total packets | Discarded packets |
| A | 0 | 146 | 0 |
| B | 0 | 146 | 0 |
| C | 0 | 146 | 0 |
| D | 0 | 146 | 0 |
| Quadrant | Total seconds | Saturated seconds | Saturation percentage |
|---|---|---|---|
| A | 7313 | 266 | 3.637358% |
| B | 7314 | 41 | 0.560569% |
| C | 7314 | 91 | 1.244189% |
| D | 7314 | 82 | 1.121138% |
Noise dominated data is calculated using 1-second bins in cleaned event files. If a bin has >2000 counts, and if more than 50% of those come from <1% of pixels, then it is considered to be noise-dominated and hence unusable.
| Quadrant | # 1 sec bins | Bins with >0 counts | Bins with >2000 counts | High rate bins dominated by noise | Noise dominated (total time) | Noise dominated (detector-on time) | Marked lightcurve |
|---|---|---|---|---|---|---|---|
| A | 7624 | 7624 | 217 | 217 | 2.85% | 2.85% | 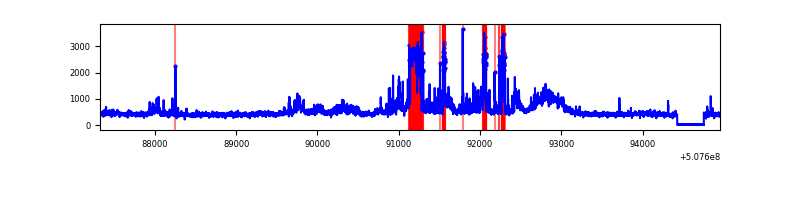 |
| B | 7625 | 7625 | 9 | 9 | 0.12% | 0.12% | 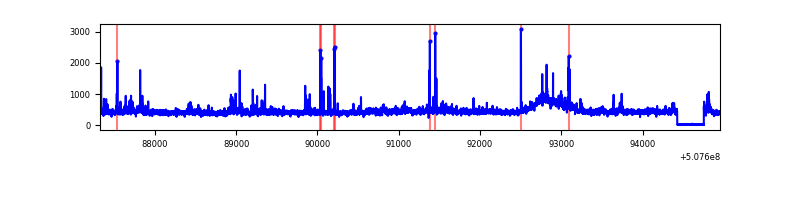 |
| C | 7625 | 7625 | 79 | 79 | 1.04% | 1.04% | 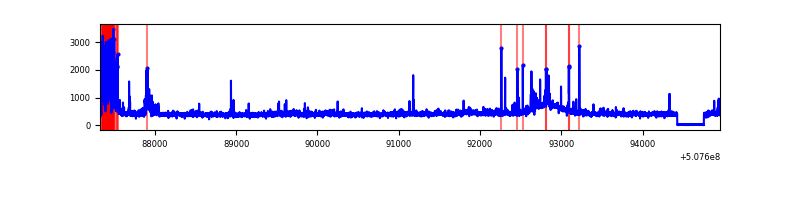 |
| D | 7625 | 7625 | 83 | 83 | 1.09% | 1.09% | 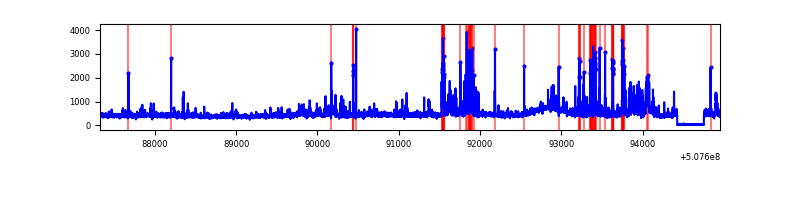 |
Top three noisy pixels from each quadrant. If the there are fewer than three noisy pixels in the level2.evt file, extra rows are filled as -1
| Pixel properties | Quadrant properties | ||||||
|---|---|---|---|---|---|---|---|
| Quadrant | DetID | PixID | Counts | Sigma | Mean | Median | Sigma |
| A | 7 | 64 | 766048 | 3998.45 | 769 | 751 | 191.4 |
| A | 12 | 115 | 554831 | 2894.9 | 769 | 751 | 191.4 |
| A | 4 | 3 | 55529 | 286.2 | 769 | 751 | 191.4 |
| B | 0 | 199 | 127236 | 756.35 | 779 | 752 | 167.2 |
| B | 2 | 249 | 57560 | 339.7 | 779 | 752 | 167.2 |
| B | 0 | 173 | 27937 | 162.56 | 779 | 752 | 167.2 |
| C | 15 | 230 | 340229 | 1646.85 | 760 | 755 | 206.1 |
| C | 14 | 254 | 39434 | 187.64 | 760 | 755 | 206.1 |
| C | 9 | 38 | 28165 | 132.97 | 760 | 755 | 206.1 |
| D | 2 | 249 | 482527 | 2237.48 | 756 | 722 | 215.3 |
| D | 7 | 129 | 245463 | 1136.56 | 756 | 722 | 215.3 |
| D | 11 | 129 | 106835 | 492.78 | 756 | 722 | 215.3 |
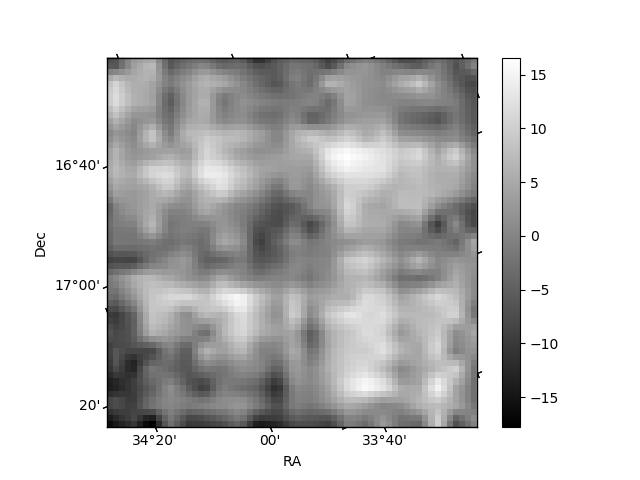
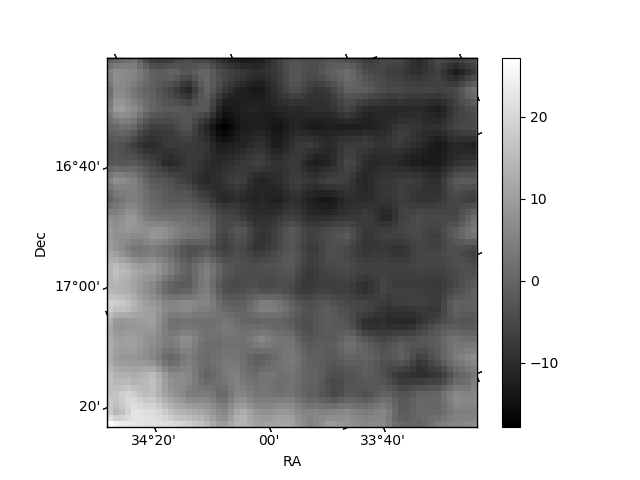
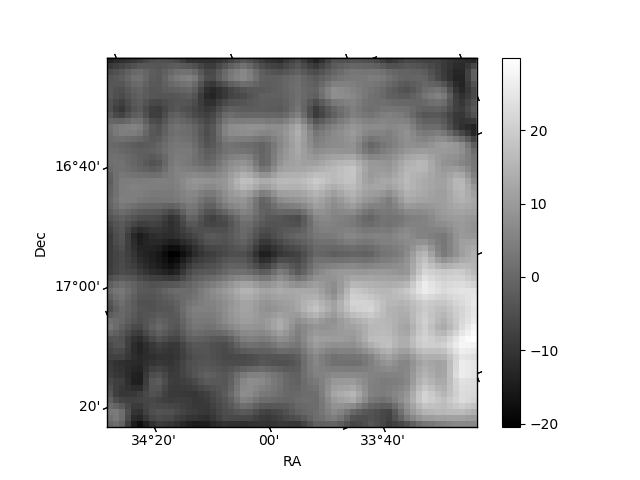
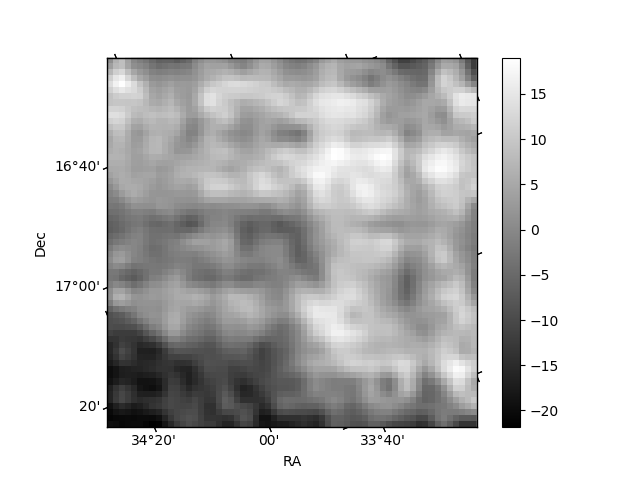
Histogram calculated using DETX and DETY for each event in the final _common_clean file
| Quadrant A | 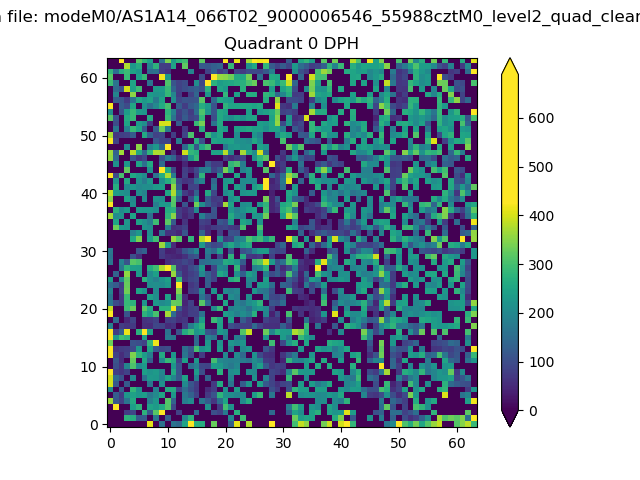 |
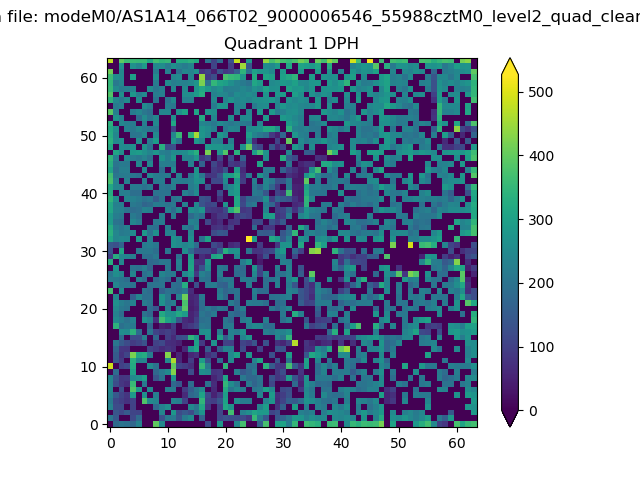 |
Quadrant B |
|---|---|---|---|
| Quadrant D | 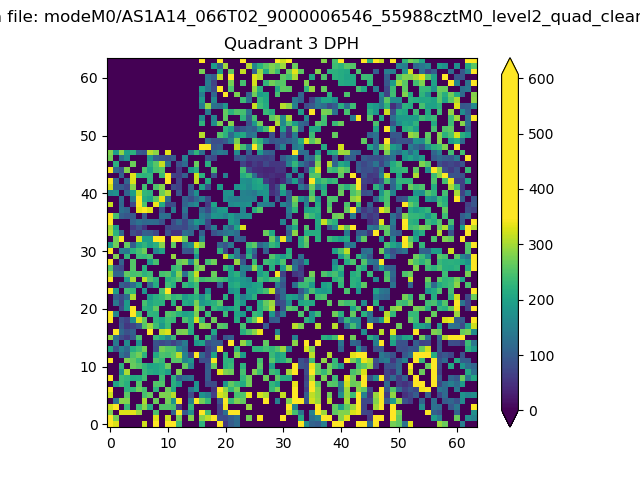 |
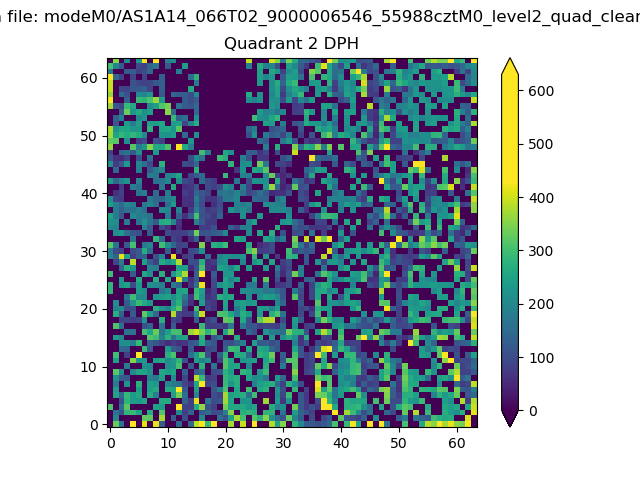 |
Quadrant C |
| Plot type | Count rate plots | Images |
|---|---|---|
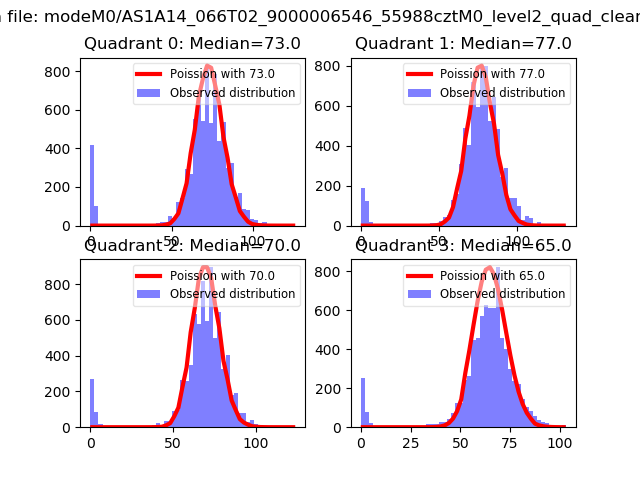
| Comparison with Poisson distribution Blue bars denote a histogram of data divided into 1 sec bins. Red curve is a Poisson curve with rate = median count rate of data. |
 |
 |
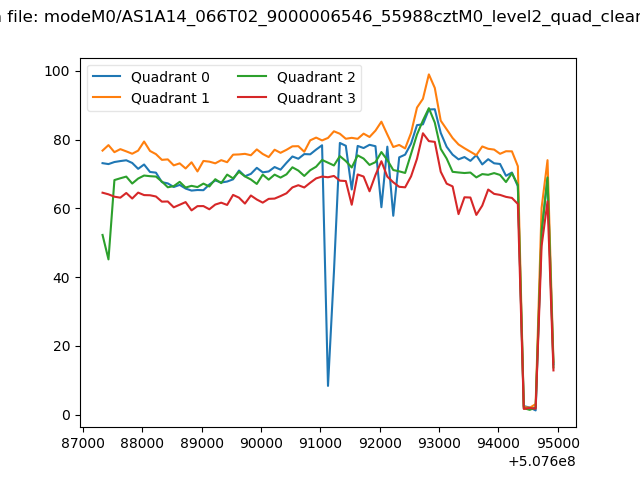
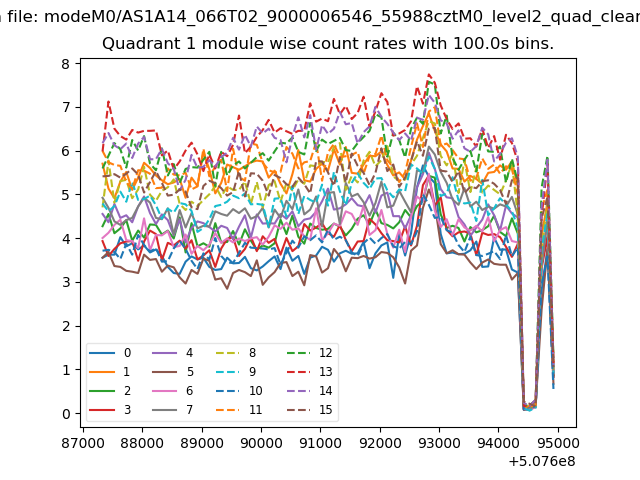
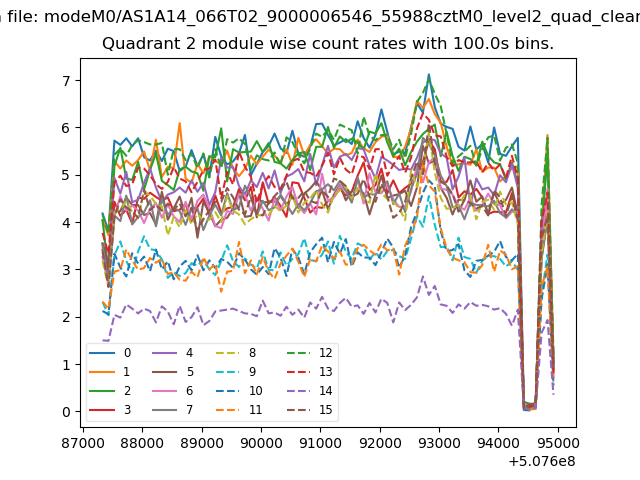
| Quadrant-wise count rates Data is divided into 100 sec bins |
 |
|
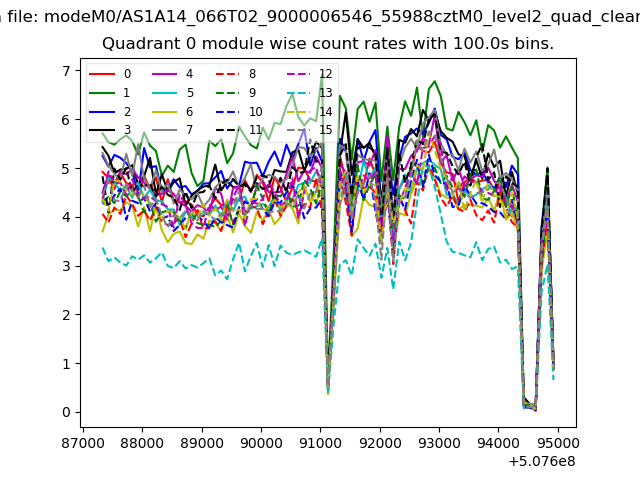
| Module-wise count rates for Quadrant A Data is divided into 100 sec bins |
 |
 |
| Module-wise count rates for Quadrant B Data is divided into 100 sec bins |
 |
 |
| Module-wise count rates for Quadrant C Data is divided into 100 sec bins |
 |
 |
| Module-wise count rates for Quadrant D Data is divided into 100 sec bins |
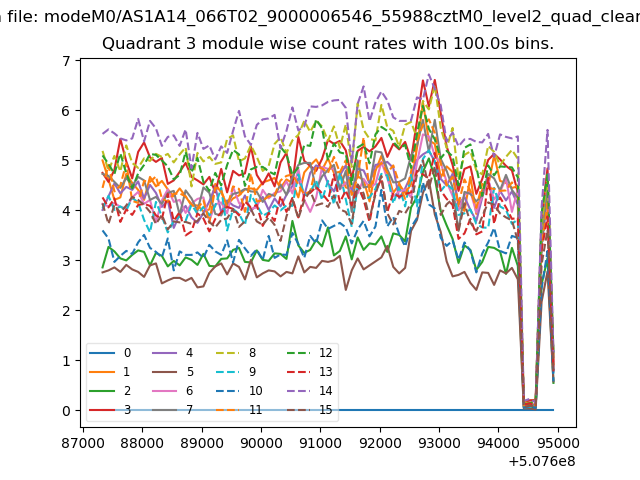 |
 |
| Parameter | Plot |
|---|---|
| CZT HV Monitor | 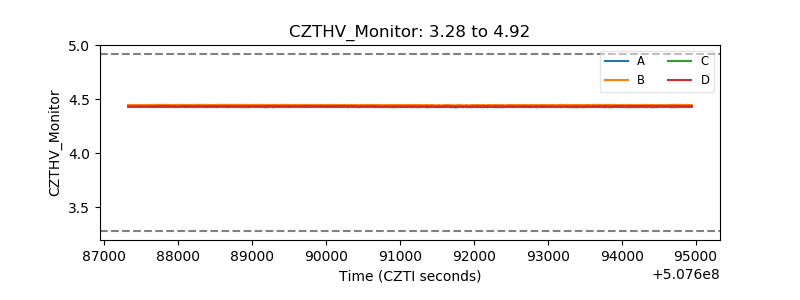 |
| D_VDD | 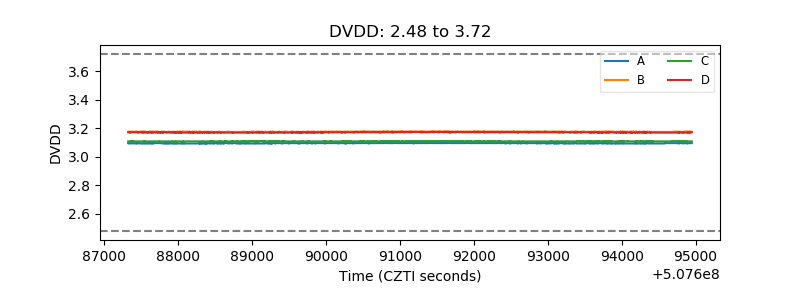 |
| Temperature 1 | 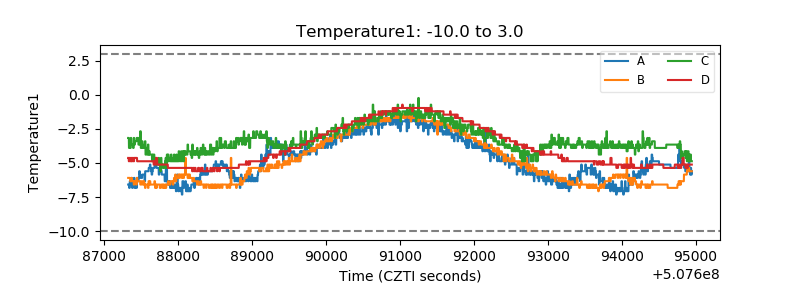 |
| Veto HV Monitor | 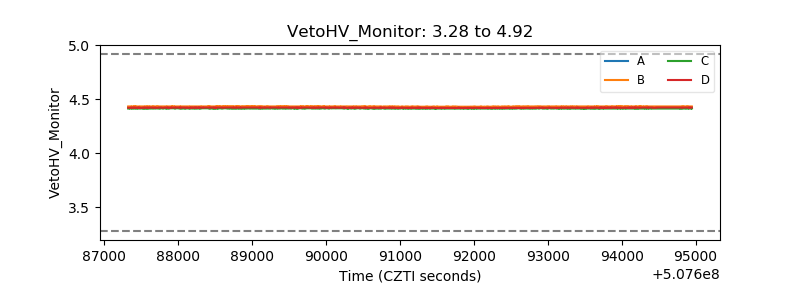 |
| Veto LLD | 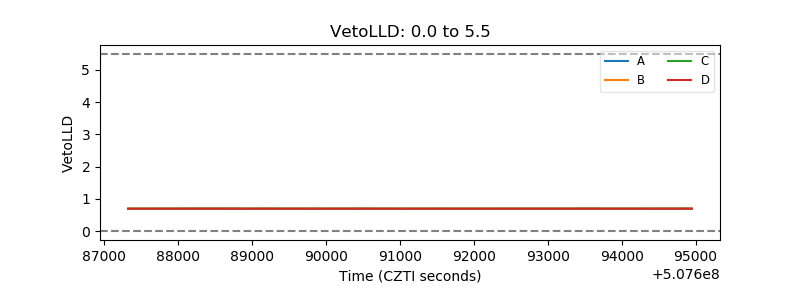 |
| Alpha Counter | 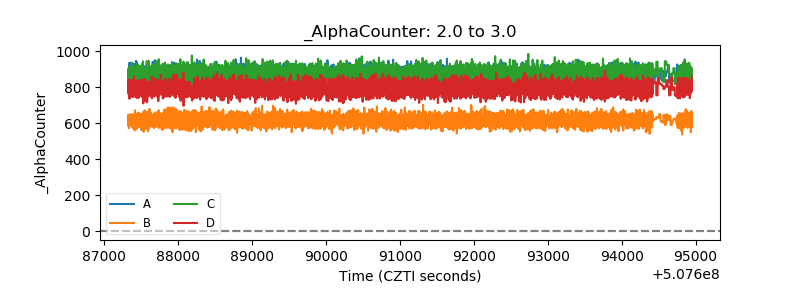 |
| _CPM_Rate | 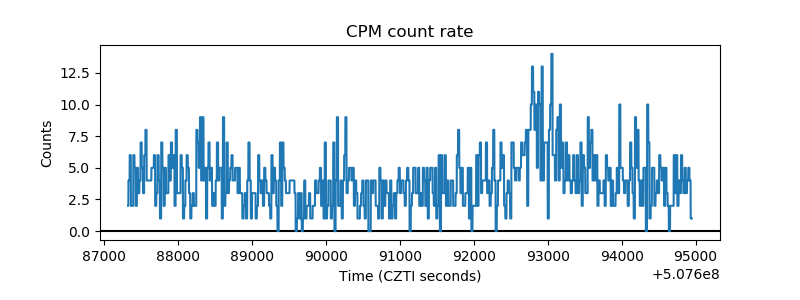 |
| CZT Counter | 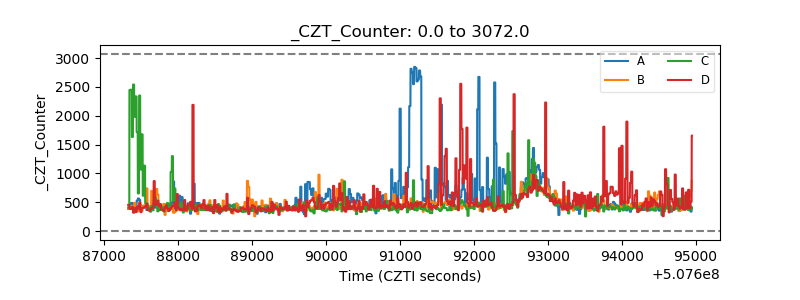 |
| +2.5 Volts monitor | 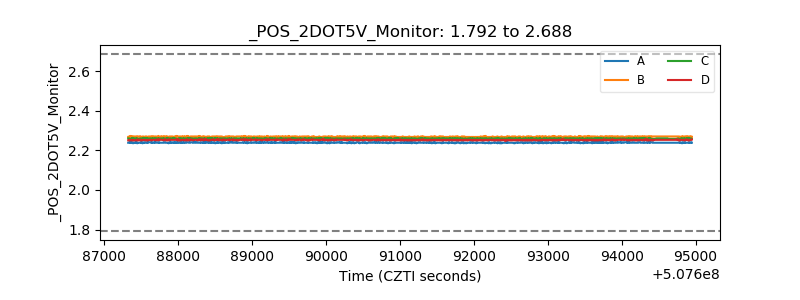 |
| +5 Volts monitor | 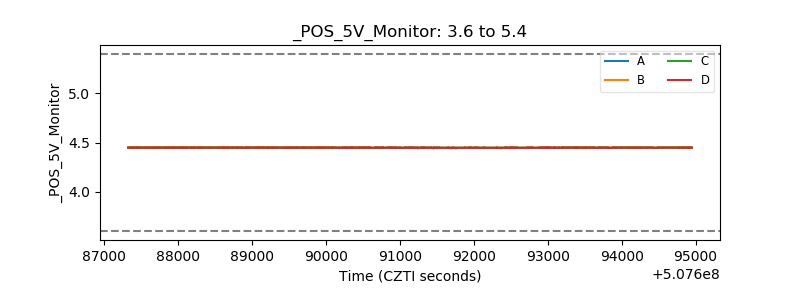 |
| _ROLL_ROT | 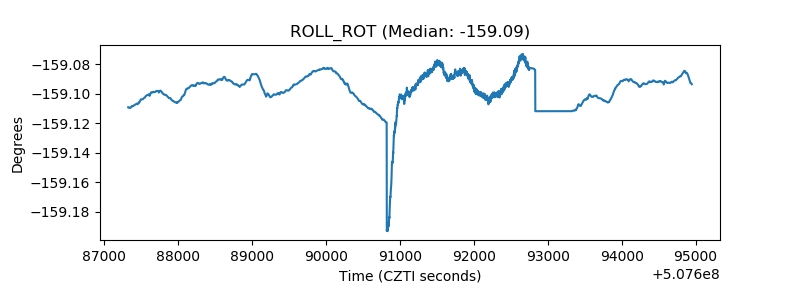 |
| _Roll_DEC | 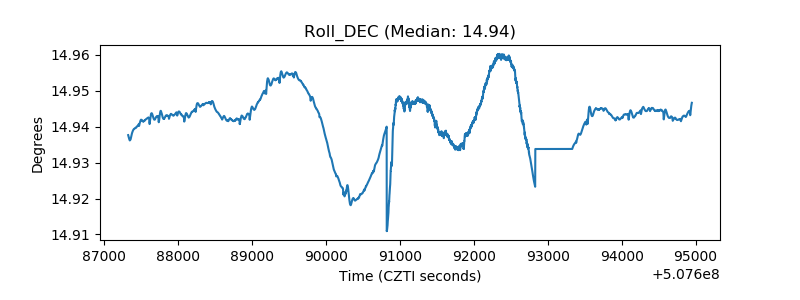 |
| _Roll_RA | 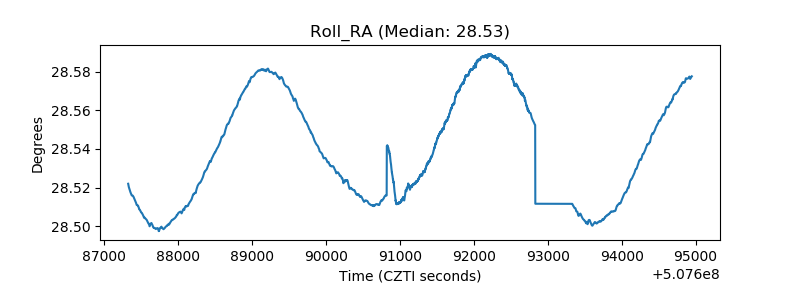 |
| Veto Counter | 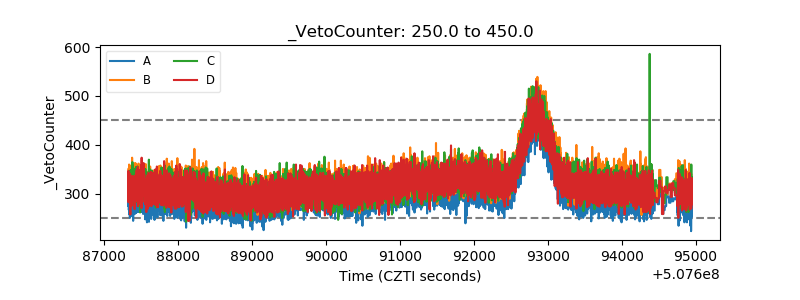 |