| Param | Original file | Final file |
|---|---|---|
| Filename | modeM0/AS1A14_066T02_9000006546_55992cztM0_level2.fits | modeM0/AS1A14_066T02_9000006546_55992cztM0_level2_quad_clean.evt |
| Size (bytes) | 1,292,342,400 | 271,486,080 |
| Size | 1.2 GB | 258.9 MB |
| Events in quadrant A | 12,540,823 | 1,714,098 |
| Events in quadrant B | 9,760,534 | 1,909,326 |
| Events in quadrant C | 11,264,827 | 1,651,983 |
| Events in quadrant D | 12,738,421 | 1,580,718 |
| Mode M9 | |||
|---|---|---|---|
| Quadrant | BADHDUFLAG | Total packets | Discarded packets |
| A | 0 | 8 | 0 |
| B | 0 | 8 | 0 |
| C | 0 | 8 | 0 |
| D | 0 | 8 | 0 |
| Mode M0 | |||
|---|---|---|---|
| Quadrant | BADHDUFLAG | Total packets | Discarded packets |
| A | 0 | 51333 | 2 |
| B | 0 | 43014 | 2 |
| C | 0 | 48231 | 2 |
| D | 0 | 51611 | 2 |
| Mode SS | |||
|---|---|---|---|
| Quadrant | BADHDUFLAG | Total packets | Discarded packets |
| A | 0 | 400 | 0 |
| B | 0 | 400 | 0 |
| C | 0 | 400 | 0 |
| D | 0 | 400 | 0 |
| Quadrant | Total seconds | Saturated seconds | Saturation percentage |
|---|---|---|---|
| A | 19794 | 1401 | 7.077902% |
| B | 19795 | 591 | 2.985602% |
| C | 19795 | 1127 | 5.693357% |
| D | 19795 | 1058 | 5.344784% |
Noise dominated data is calculated using 1-second bins in cleaned event files. If a bin has >2000 counts, and if more than 50% of those come from <1% of pixels, then it is considered to be noise-dominated and hence unusable.
| Quadrant | # 1 sec bins | Bins with >0 counts | Bins with >2000 counts | High rate bins dominated by noise | Noise dominated (total time) | Noise dominated (detector-on time) | Marked lightcurve |
|---|---|---|---|---|---|---|---|
| A | 20669 | 19794 | 909 | 909 | 4.40% | 4.59% | 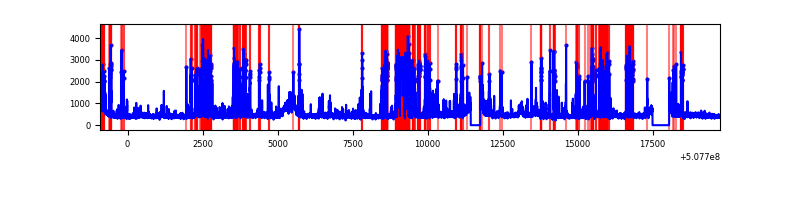 |
| B | 20670 | 19795 | 32 | 32 | 0.15% | 0.16% | 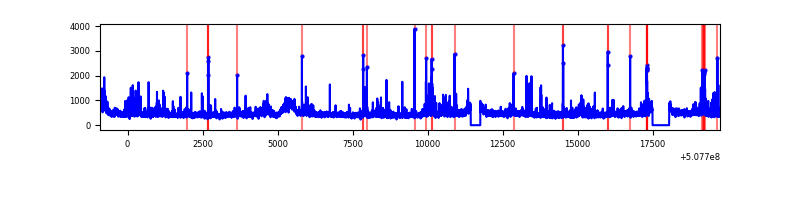 |
| C | 20670 | 19795 | 793 | 793 | 3.84% | 4.01% | 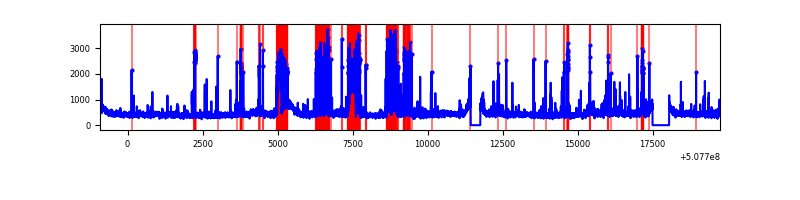 |
| D | 20670 | 19795 | 830 | 830 | 4.02% | 4.19% | 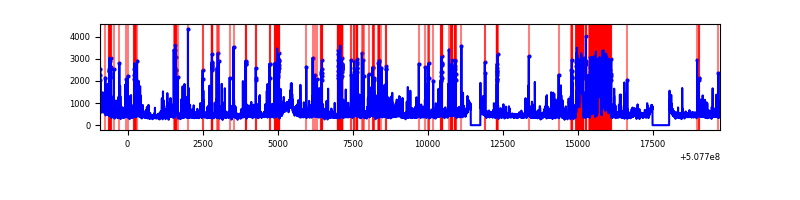 |
Top three noisy pixels from each quadrant. If the there are fewer than three noisy pixels in the level2.evt file, extra rows are filled as -1
| Pixel properties | Quadrant properties | ||||||
|---|---|---|---|---|---|---|---|
| Quadrant | DetID | PixID | Counts | Sigma | Mean | Median | Sigma |
| A | 7 | 64 | 1229330 | 2373.26 | 2107 | 2049 | 517.1 |
| A | 0 | 8 | 866835 | 1672.28 | 2107 | 2049 | 517.1 |
| A | 14 | 32 | 802005 | 1546.92 | 2107 | 2049 | 517.1 |
| B | 0 | 199 | 362816 | 793.29 | 2120 | 2037 | 454.8 |
| B | 2 | 249 | 322317 | 704.24 | 2120 | 2037 | 454.8 |
| B | 0 | 173 | 218371 | 475.68 | 2120 | 2037 | 454.8 |
| C | 15 | 199 | 1782004 | 3222.21 | 2040 | 2024 | 552.4 |
| C | 12 | 254 | 663007 | 1196.54 | 2040 | 2024 | 552.4 |
| C | 14 | 254 | 206041 | 369.32 | 2040 | 2024 | 552.4 |
| D | 2 | 249 | 2226431 | 3839.78 | 2063 | 1975 | 579.3 |
| D | 6 | 42 | 387001 | 664.62 | 2063 | 1975 | 579.3 |
| D | 3 | 12 | 375052 | 643.99 | 2063 | 1975 | 579.3 |
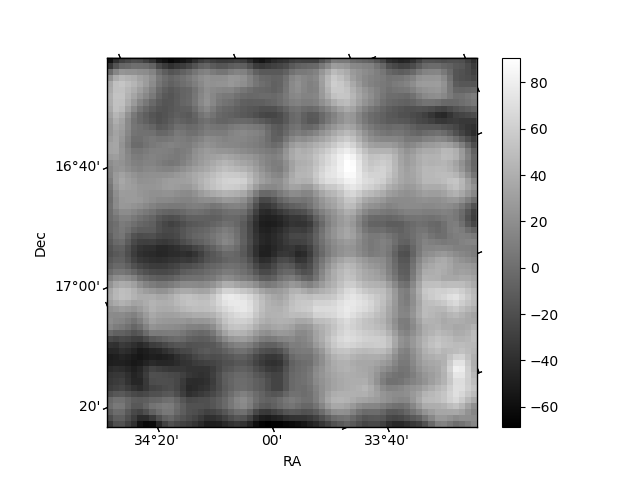
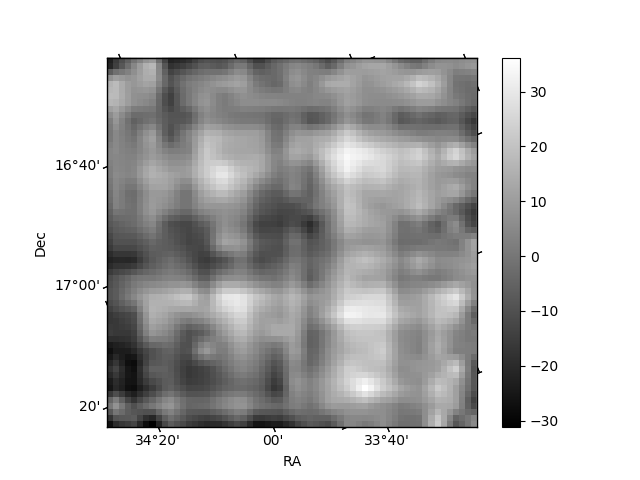
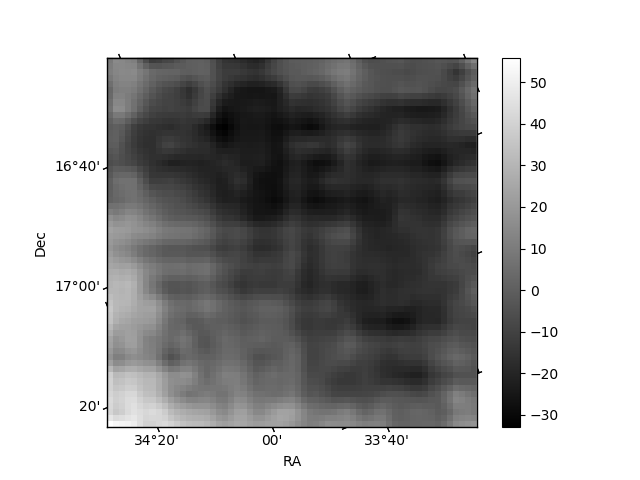
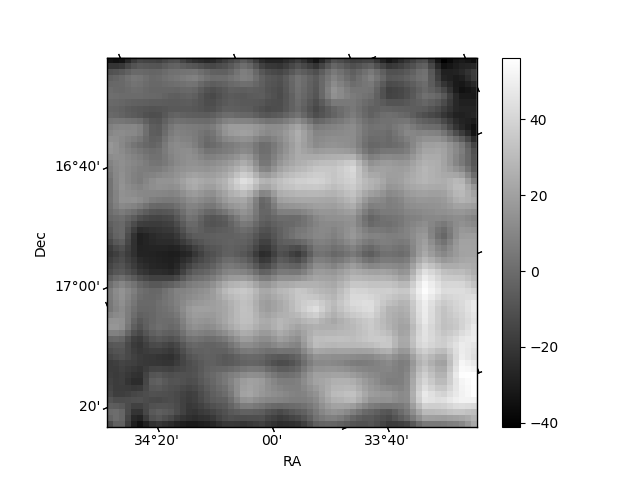
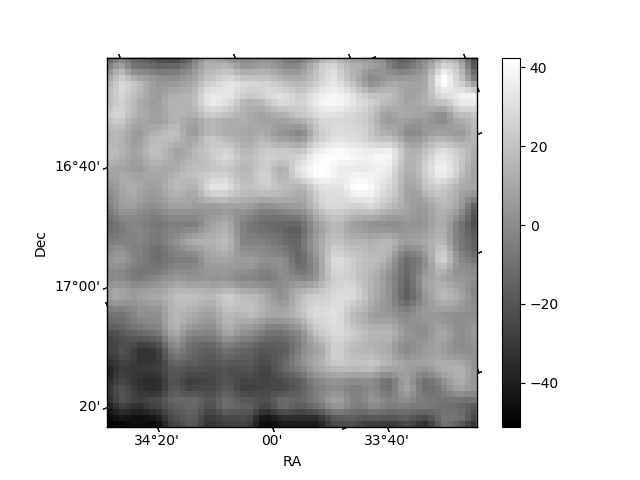
Histogram calculated using DETX and DETY for each event in the final _common_clean file
| Quadrant A | 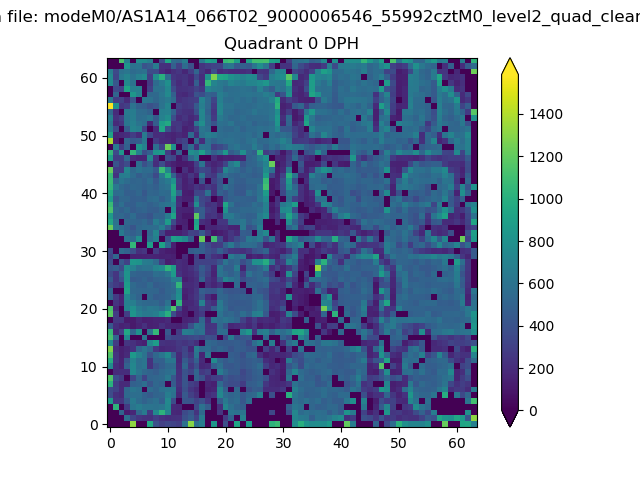 |
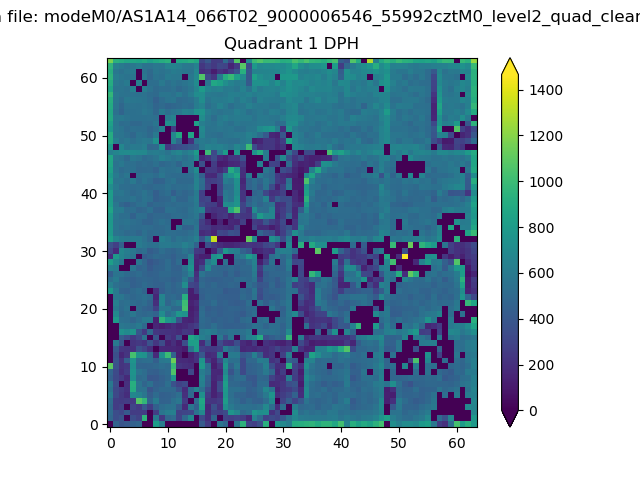 |
Quadrant B |
|---|---|---|---|
| Quadrant D | 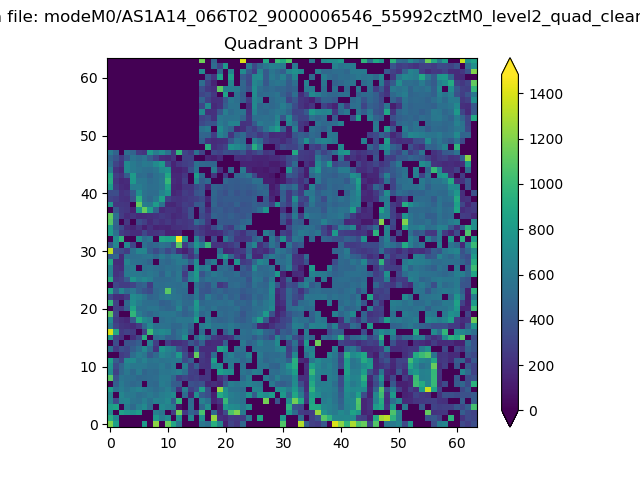 |
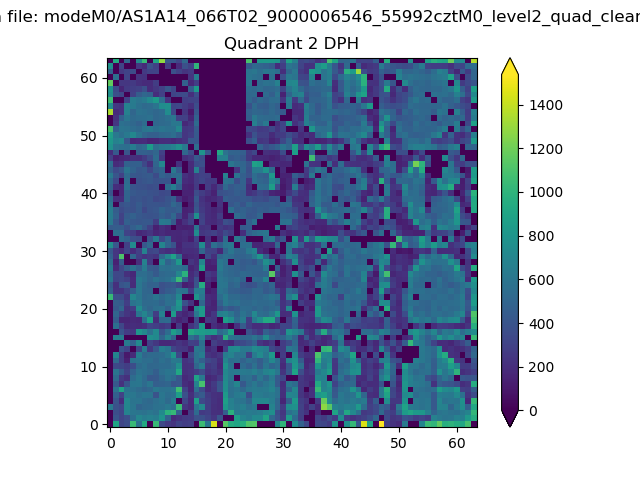 |
Quadrant C |
| Plot type | Count rate plots | Images |
|---|---|---|
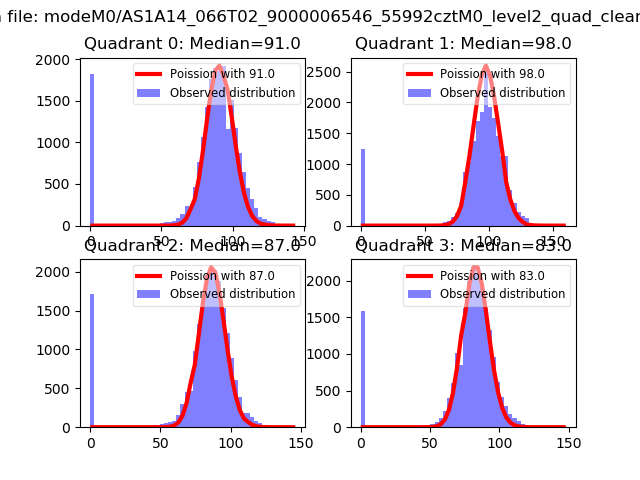
| Comparison with Poisson distribution Blue bars denote a histogram of data divided into 1 sec bins. Red curve is a Poisson curve with rate = median count rate of data. |
 |
 |
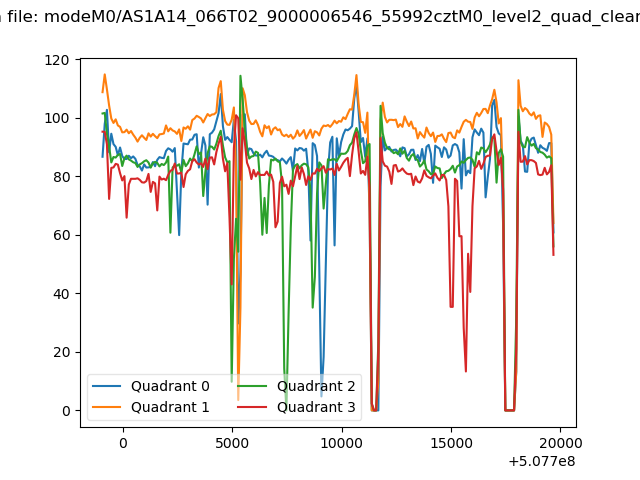
| Quadrant-wise count rates Data is divided into 100 sec bins |
 |
|
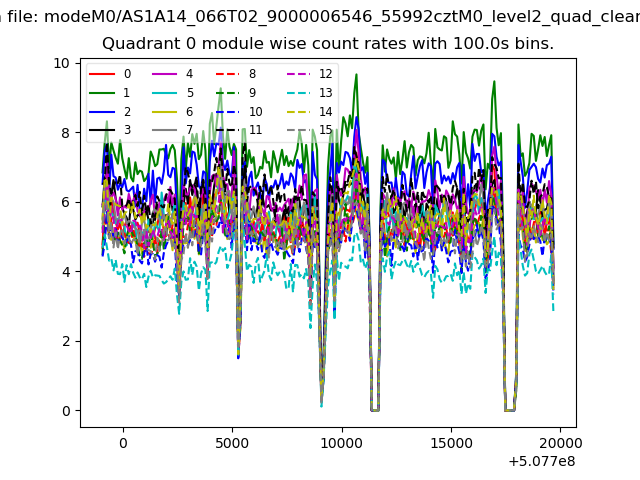
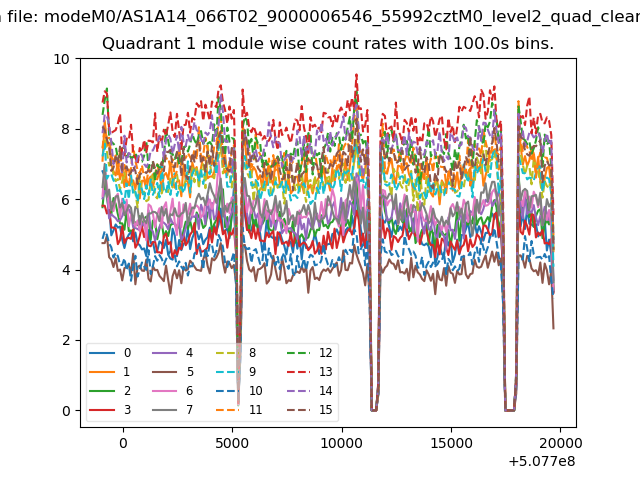
| Module-wise count rates for Quadrant A Data is divided into 100 sec bins |
 |
 |
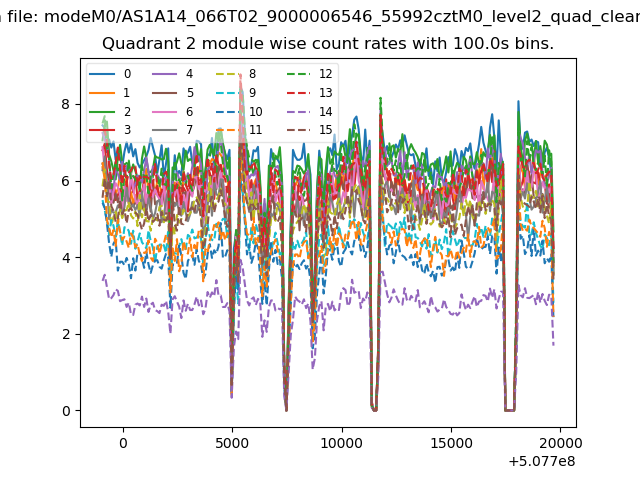
| Module-wise count rates for Quadrant B Data is divided into 100 sec bins |
 |
 |
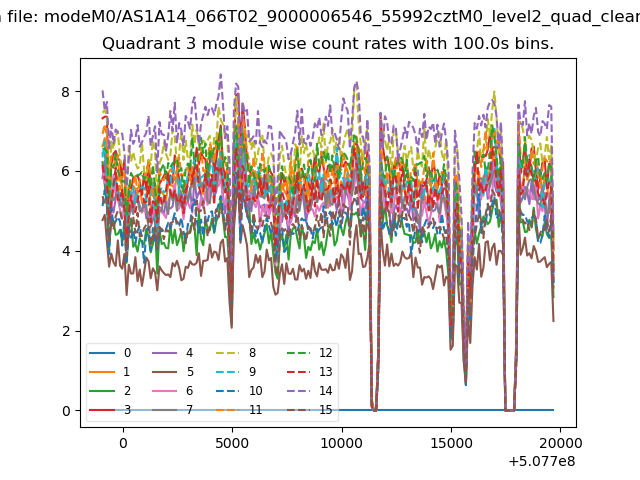
| Module-wise count rates for Quadrant C Data is divided into 100 sec bins |
 |
 |
| Module-wise count rates for Quadrant D Data is divided into 100 sec bins |
 |
 |
| Parameter | Plot |
|---|---|
| CZT HV Monitor | 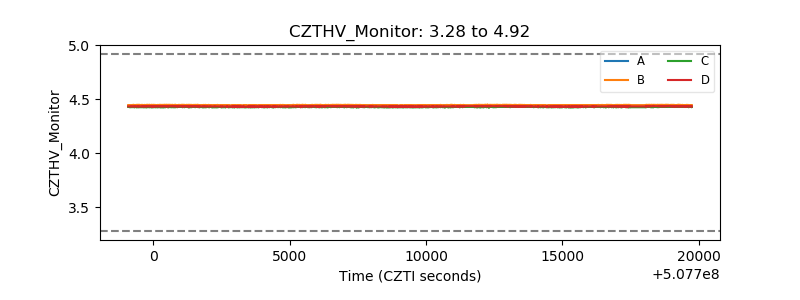 |
| D_VDD | 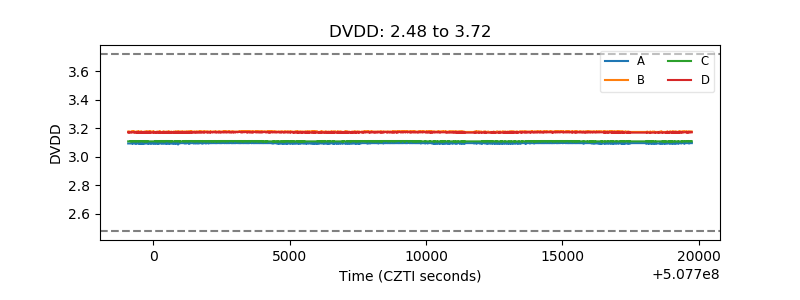 |
| Temperature 1 | 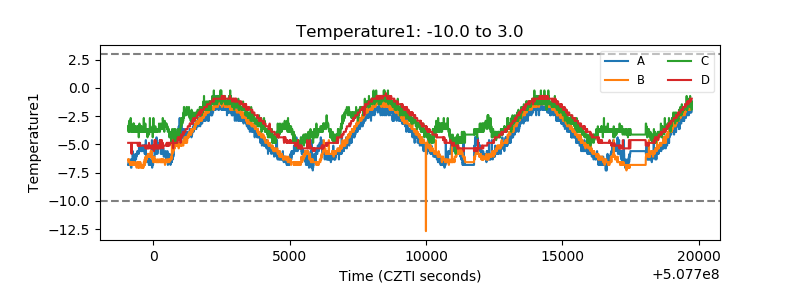 |
| Veto HV Monitor | 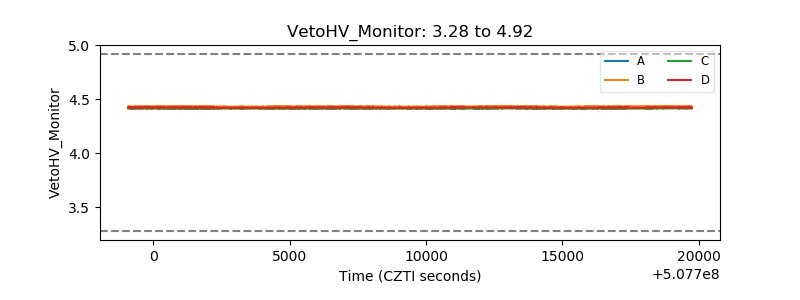 |
| Veto LLD | 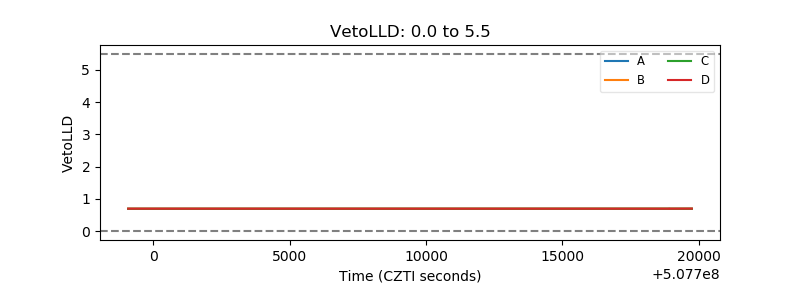 |
| Alpha Counter | 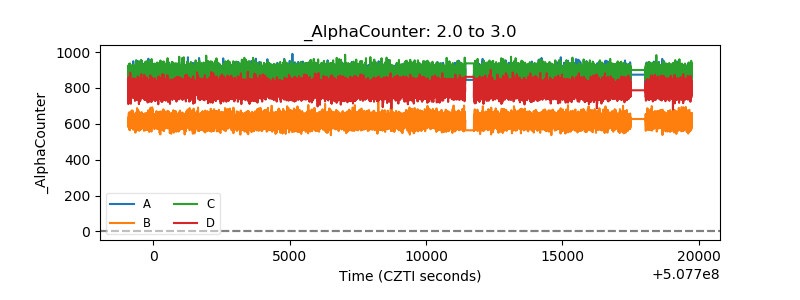 |
| _CPM_Rate | 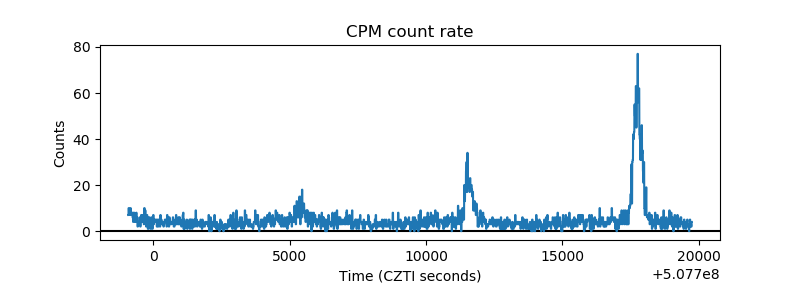 |
| CZT Counter | 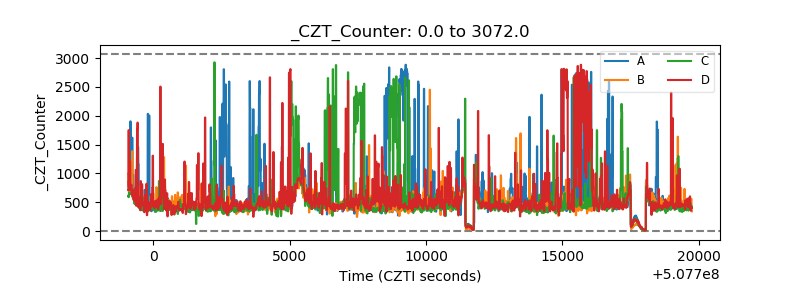 |
| +2.5 Volts monitor | 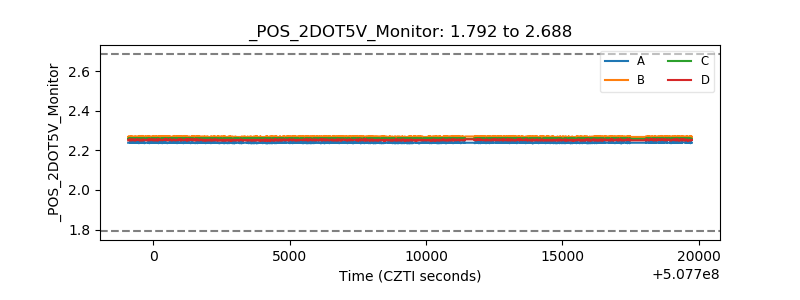 |
| +5 Volts monitor | 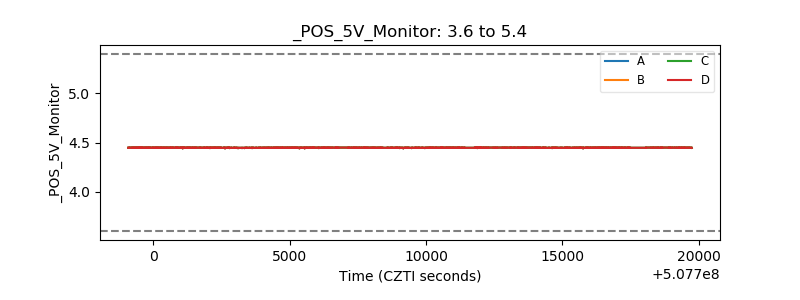 |
| _ROLL_ROT | 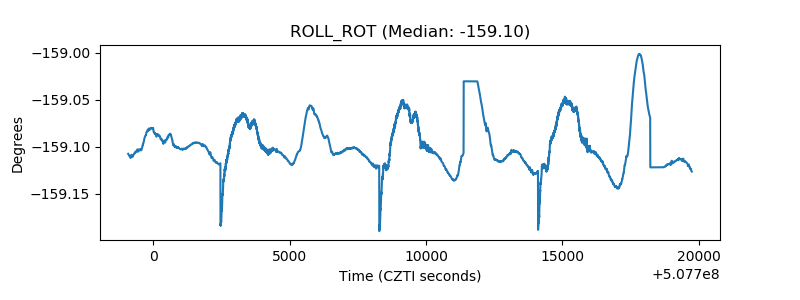 |
| _Roll_DEC | 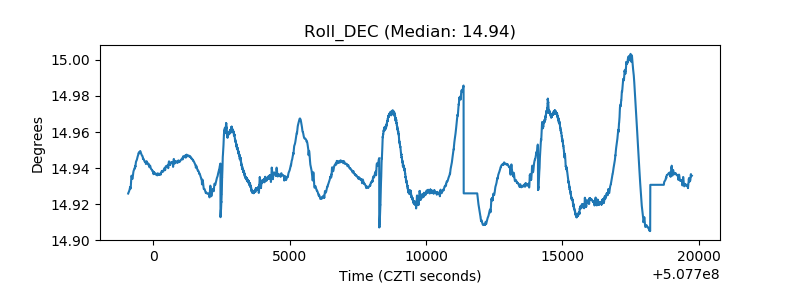 |
| _Roll_RA | 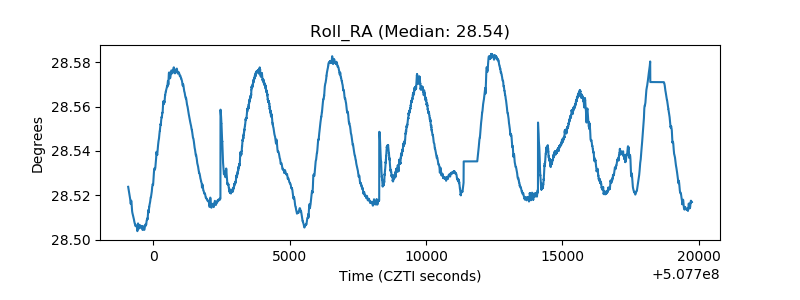 |
| Veto Counter | 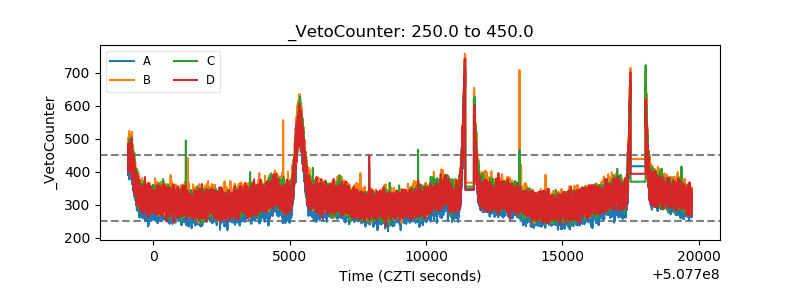 |