| Param | Original file | Final file |
|---|---|---|
| Filename | modeM0/AS1A14_066T02_9000006546_55993cztM0_level2.fits | modeM0/AS1A14_066T02_9000006546_55993cztM0_level2_quad_clean.evt |
| Size (bytes) | 373,449,600 | 90,576,000 |
| Size | 356.1 MB | 86.4 MB |
| Events in quadrant A | 3,817,285 | 571,581 |
| Events in quadrant B | 3,319,032 | 628,366 |
| Events in quadrant C | 2,895,800 | 563,683 |
| Events in quadrant D | 3,296,581 | 534,927 |
| Mode M9 | |||
|---|---|---|---|
| Quadrant | BADHDUFLAG | Total packets | Discarded packets |
| A | 0 | 7 | 0 |
| B | 0 | 7 | 0 |
| C | 0 | 7 | 0 |
| D | 0 | 7 | 0 |
| Mode M0 | |||
|---|---|---|---|
| Quadrant | BADHDUFLAG | Total packets | Discarded packets |
| A | 0 | 15726 | 1 |
| B | 0 | 14334 | 1 |
| C | 0 | 13573 | 1 |
| D | 0 | 14358 | 1 |
| Mode SS | |||
|---|---|---|---|
| Quadrant | BADHDUFLAG | Total packets | Discarded packets |
| A | 0 | 130 | 0 |
| B | 0 | 130 | 0 |
| C | 0 | 130 | 0 |
| D | 0 | 130 | 0 |
| Quadrant | Total seconds | Saturated seconds | Saturation percentage |
|---|---|---|---|
| A | 6360 | 276 | 4.339623% |
| B | 6360 | 90 | 1.415094% |
| C | 6360 | 51 | 0.801887% |
| D | 6360 | 71 | 1.116352% |
Noise dominated data is calculated using 1-second bins in cleaned event files. If a bin has >2000 counts, and if more than 50% of those come from <1% of pixels, then it is considered to be noise-dominated and hence unusable.
| Quadrant | # 1 sec bins | Bins with >0 counts | Bins with >2000 counts | High rate bins dominated by noise | Noise dominated (total time) | Noise dominated (detector-on time) | Marked lightcurve |
|---|---|---|---|---|---|---|---|
| A | 7145 | 6360 | 252 | 252 | 3.53% | 3.96% | 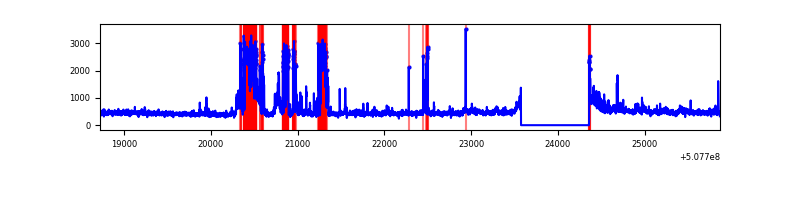 |
| B | 7145 | 6360 | 44 | 44 | 0.62% | 0.69% | 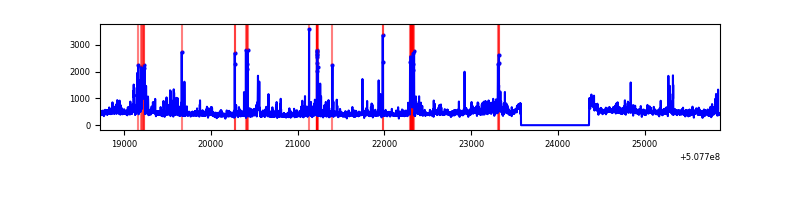 |
| C | 7145 | 6361 | 47 | 47 | 0.66% | 0.74% | 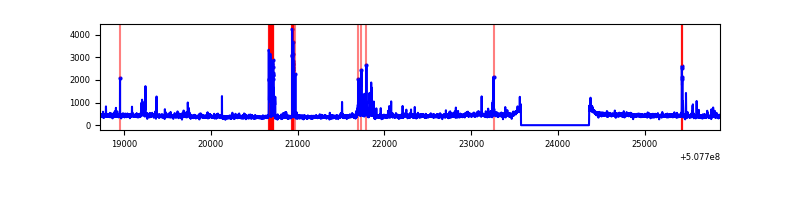 |
| D | 7145 | 6361 | 49 | 49 | 0.69% | 0.77% | 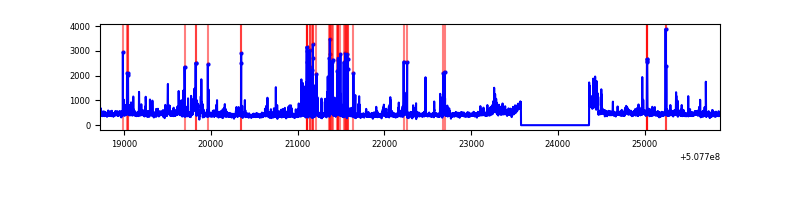 |
Top three noisy pixels from each quadrant. If the there are fewer than three noisy pixels in the level2.evt file, extra rows are filled as -1
| Pixel properties | Quadrant properties | ||||||
|---|---|---|---|---|---|---|---|
| Quadrant | DetID | PixID | Counts | Sigma | Mean | Median | Sigma |
| A | 7 | 64 | 816783 | 4917.88 | 668 | 652 | 166.0 |
| A | 12 | 115 | 201994 | 1213.26 | 668 | 652 | 166.0 |
| A | 4 | 3 | 55092 | 328.05 | 668 | 652 | 166.0 |
| B | 0 | 173 | 166302 | 1157.25 | 662 | 637 | 143.2 |
| B | 0 | 199 | 166295 | 1157.21 | 662 | 637 | 143.2 |
| B | 2 | 249 | 132690 | 922.46 | 662 | 637 | 143.2 |
| C | 8 | 7 | 105565 | 586.17 | 650 | 642 | 179.0 |
| C | 12 | 254 | 82909 | 459.6 | 650 | 642 | 179.0 |
| C | 1 | 246 | 46961 | 258.77 | 650 | 642 | 179.0 |
| D | 6 | 239 | 248056 | 1332.62 | 655 | 627 | 185.7 |
| D | 2 | 249 | 136169 | 730.01 | 655 | 627 | 185.7 |
| D | 7 | 129 | 94858 | 507.52 | 655 | 627 | 185.7 |
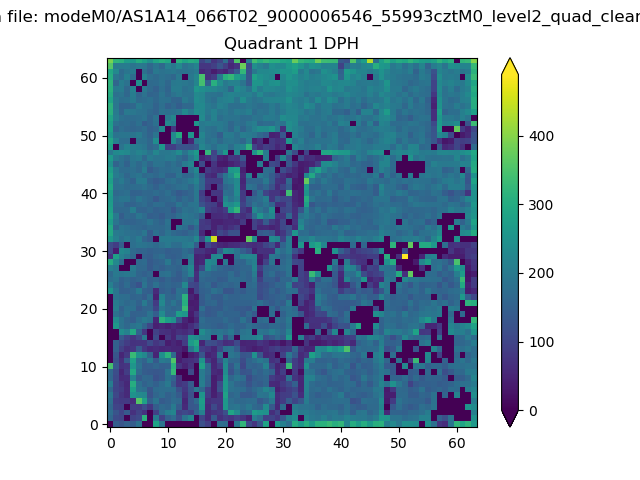
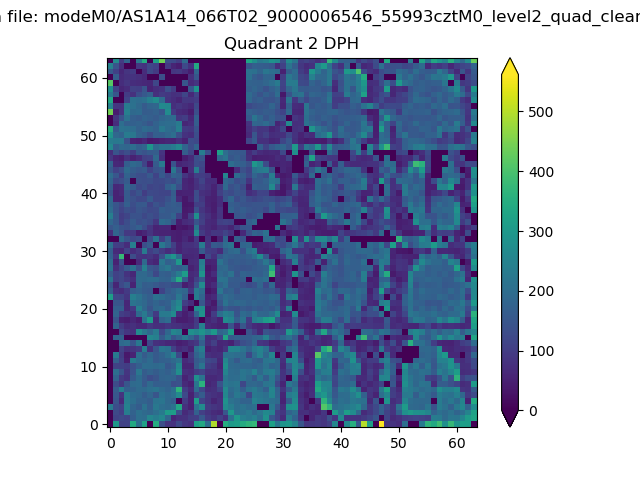
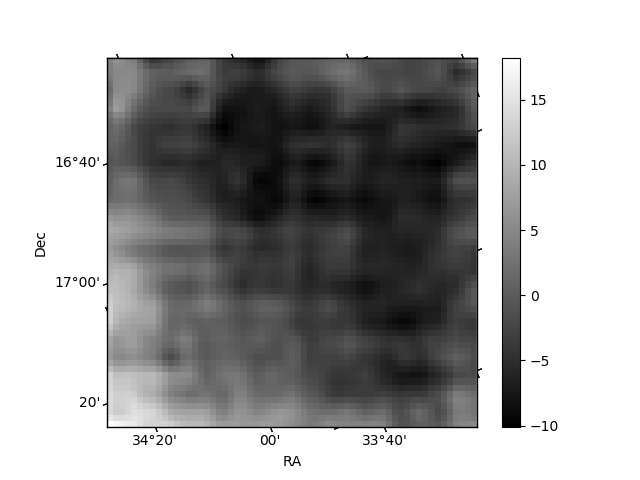
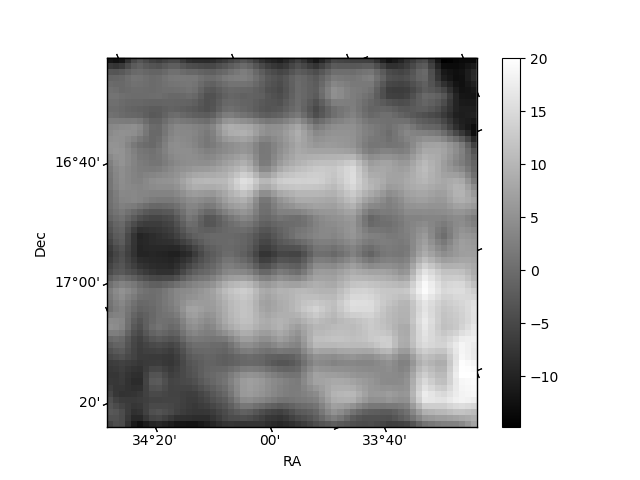
Histogram calculated using DETX and DETY for each event in the final _common_clean file
| Quadrant A |  |
 |
Quadrant B |
|---|---|---|---|
| Quadrant D |  |
 |
Quadrant C |
| Plot type | Count rate plots | Images |
|---|---|---|
| Comparison with Poisson distribution Blue bars denote a histogram of data divided into 1 sec bins. Red curve is a Poisson curve with rate = median count rate of data. |
 |
 |
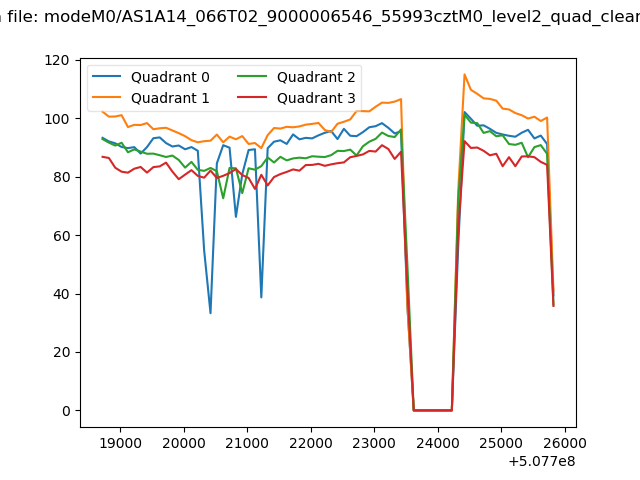
| Quadrant-wise count rates Data is divided into 100 sec bins |
 |
|
| Module-wise count rates for Quadrant A Data is divided into 100 sec bins |
 |
 |
| Module-wise count rates for Quadrant B Data is divided into 100 sec bins |
 |
 |
| Module-wise count rates for Quadrant C Data is divided into 100 sec bins |
 |
 |
| Module-wise count rates for Quadrant D Data is divided into 100 sec bins |
 |
 |
| Parameter | Plot |
|---|---|
| CZT HV Monitor |  |
| D_VDD | 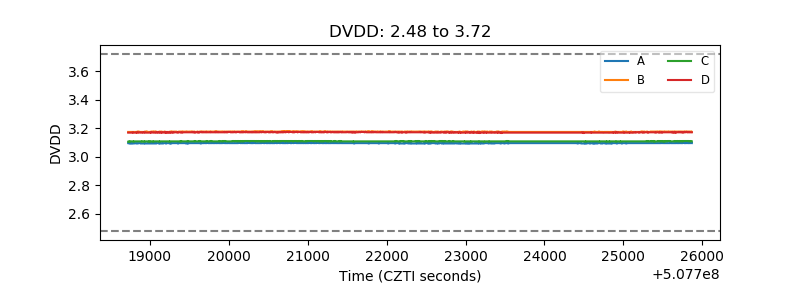 |
| Temperature 1 | 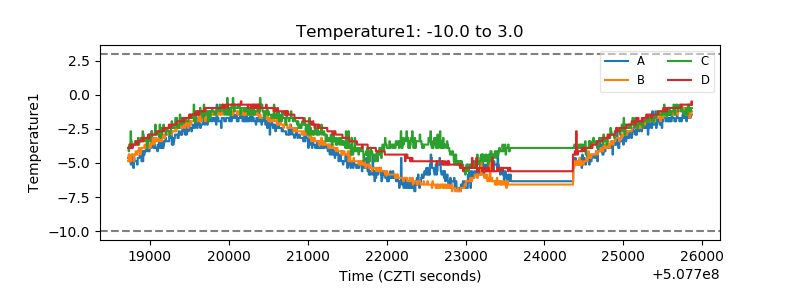 |
| Veto HV Monitor | 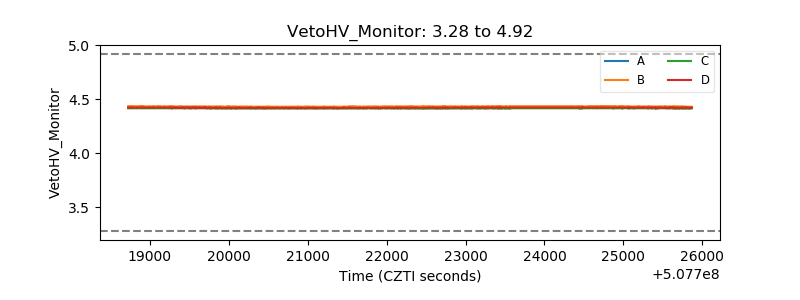 |
| Veto LLD | 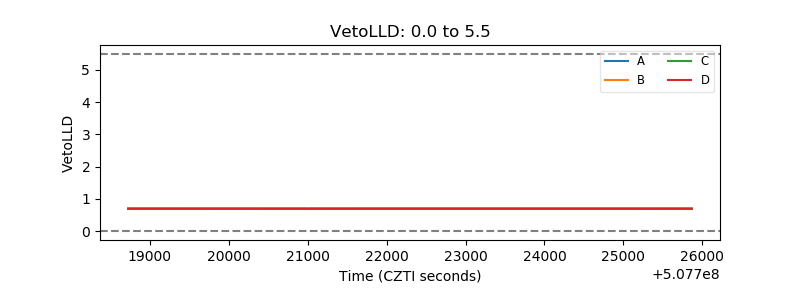 |
| Alpha Counter |  |
| _CPM_Rate |  |
| CZT Counter | 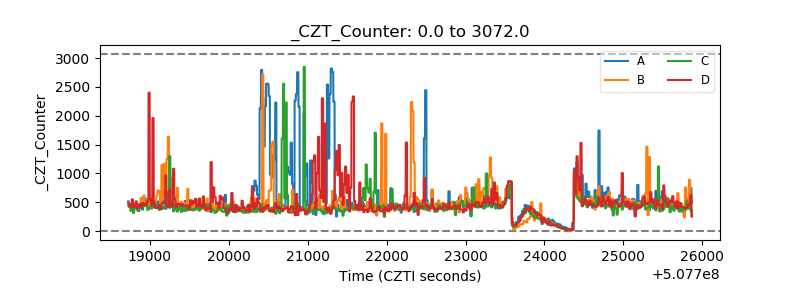 |
| +2.5 Volts monitor |  |
| +5 Volts monitor |  |
| _ROLL_ROT | 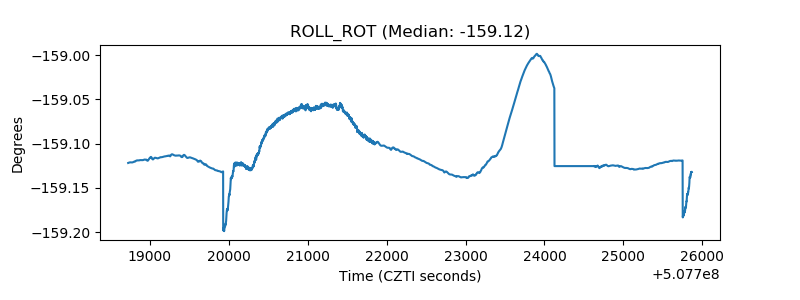 |
| _Roll_DEC | 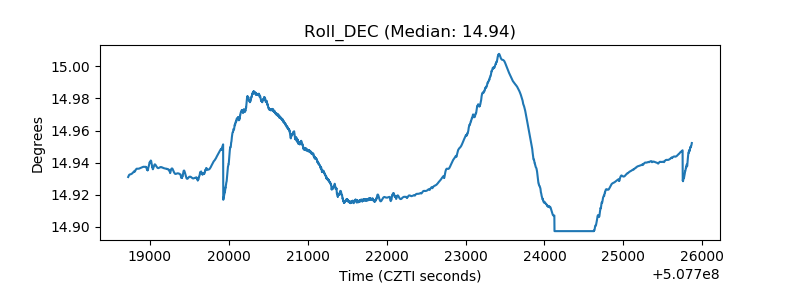 |
| _Roll_RA | 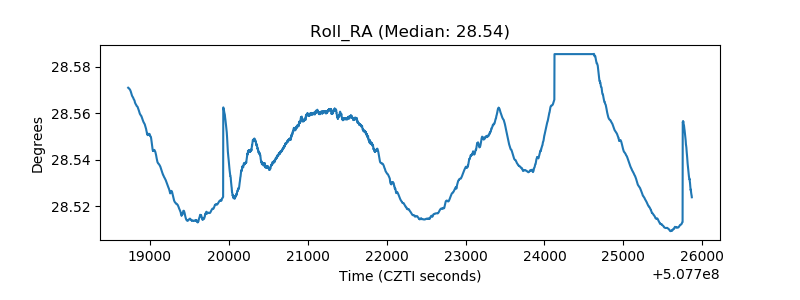 |
| Veto Counter | 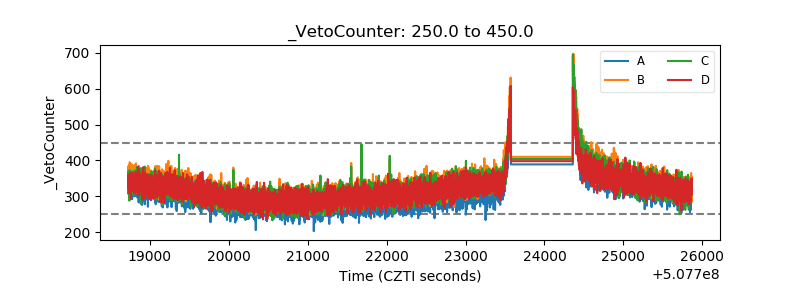 |