| Param | Original file | Final file |
|---|---|---|
| Filename | modeM0/AS1A14_066T02_9000006546_55996cztM0_level2.fits | modeM0/AS1A14_066T02_9000006546_55996cztM0_level2_quad_clean.evt |
| Size (bytes) | 366,724,800 | 77,581,440 |
| Size | 349.7 MB | 74.0 MB |
| Events in quadrant A | 3,402,199 | 504,347 |
| Events in quadrant B | 2,775,313 | 545,148 |
| Events in quadrant C | 3,341,697 | 469,505 |
| Events in quadrant D | 3,632,642 | 449,933 |
| Mode M9 | |||
|---|---|---|---|
| Quadrant | BADHDUFLAG | Total packets | Discarded packets |
| A | 0 | 11 | 0 |
| B | 0 | 11 | 0 |
| C | 0 | 11 | 0 |
| D | 0 | 11 | 0 |
| Mode M0 | |||
|---|---|---|---|
| Quadrant | BADHDUFLAG | Total packets | Discarded packets |
| A | 0 | 13994 | 2 |
| B | 0 | 12152 | 1 |
| C | 0 | 14075 | 1 |
| D | 0 | 14635 | 1 |
| Mode SS | |||
|---|---|---|---|
| Quadrant | BADHDUFLAG | Total packets | Discarded packets |
| A | 0 | 110 | 0 |
| B | 0 | 110 | 0 |
| C | 0 | 110 | 0 |
| D | 0 | 110 | 0 |
| Quadrant | Total seconds | Saturated seconds | Saturation percentage |
|---|---|---|---|
| A | 5432 | 238 | 4.381443% |
| B | 5433 | 97 | 1.785386% |
| C | 5433 | 298 | 5.484999% |
| D | 5433 | 257 | 4.730352% |
Noise dominated data is calculated using 1-second bins in cleaned event files. If a bin has >2000 counts, and if more than 50% of those come from <1% of pixels, then it is considered to be noise-dominated and hence unusable.
| Quadrant | # 1 sec bins | Bins with >0 counts | Bins with >2000 counts | High rate bins dominated by noise | Noise dominated (total time) | Noise dominated (detector-on time) | Marked lightcurve |
|---|---|---|---|---|---|---|---|
| A | 6487 | 5432 | 235 | 235 | 3.62% | 4.33% | 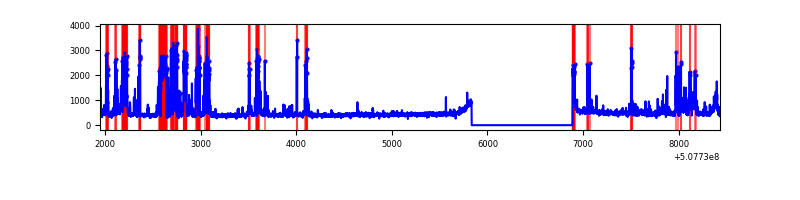 |
| B | 6488 | 5433 | 41 | 41 | 0.63% | 0.75% | 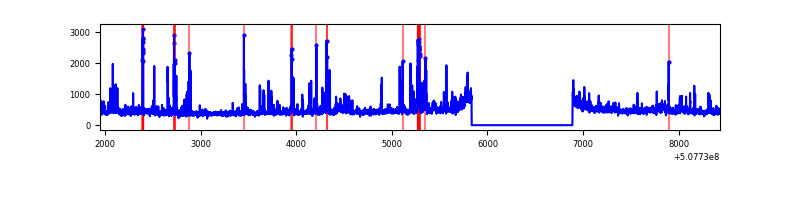 |
| C | 6488 | 5434 | 291 | 291 | 4.49% | 5.36% | 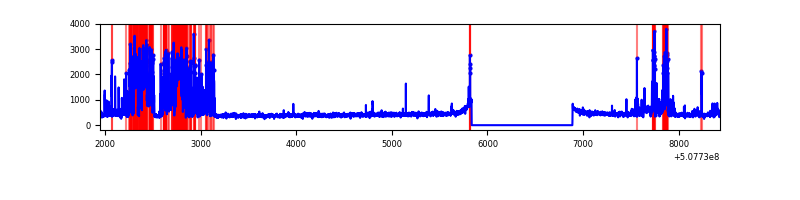 |
| D | 6488 | 5433 | 244 | 244 | 3.76% | 4.49% | 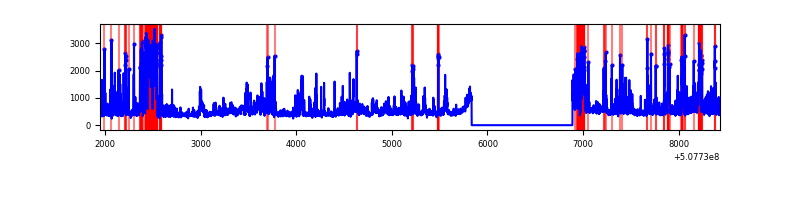 |
Top three noisy pixels from each quadrant. If the there are fewer than three noisy pixels in the level2.evt file, extra rows are filled as -1
| Pixel properties | Quadrant properties | ||||||
|---|---|---|---|---|---|---|---|
| Quadrant | DetID | PixID | Counts | Sigma | Mean | Median | Sigma |
| A | 7 | 64 | 778095 | 5545.91 | 566 | 552 | 140.2 |
| A | 15 | 32 | 158837 | 1128.99 | 566 | 552 | 140.2 |
| A | 4 | 249 | 93702 | 664.4 | 566 | 552 | 140.2 |
| B | 7 | 252 | 134395 | 1099.72 | 564 | 542 | 121.7 |
| B | 0 | 213 | 67721 | 551.93 | 564 | 542 | 121.7 |
| B | 0 | 199 | 67328 | 548.7 | 564 | 542 | 121.7 |
| C | 12 | 254 | 954804 | 6318.29 | 543 | 538 | 151.0 |
| C | 12 | 249 | 83337 | 548.22 | 543 | 538 | 151.0 |
| C | 13 | 3 | 57452 | 376.83 | 543 | 538 | 151.0 |
| D | 2 | 249 | 450051 | 2888.53 | 544 | 521 | 155.6 |
| D | 8 | 240 | 257393 | 1650.57 | 544 | 521 | 155.6 |
| D | 8 | 245 | 211866 | 1358.03 | 544 | 521 | 155.6 |
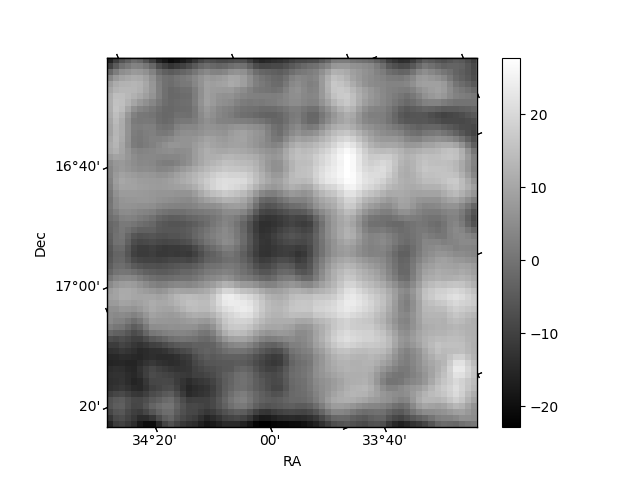
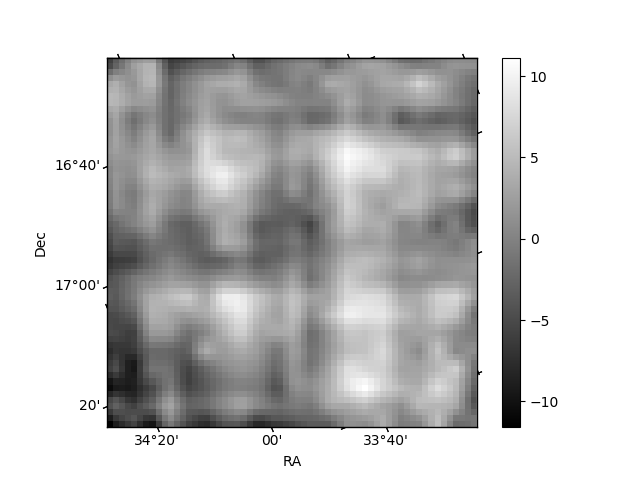
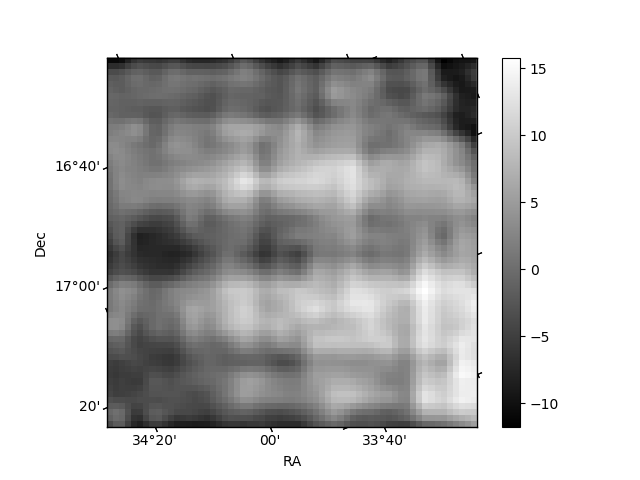
Histogram calculated using DETX and DETY for each event in the final _common_clean file
| Quadrant A | 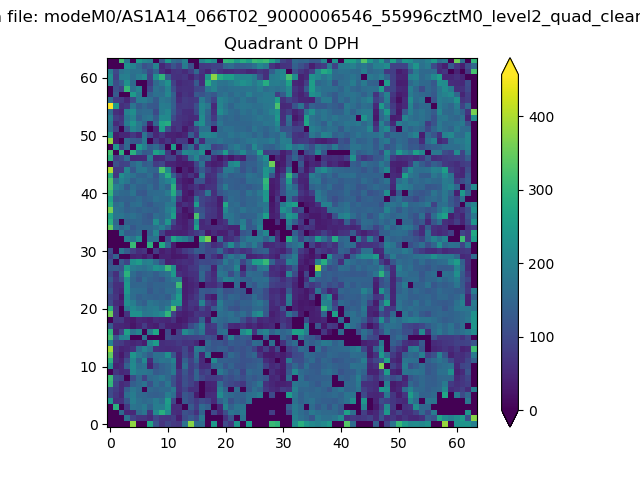 |
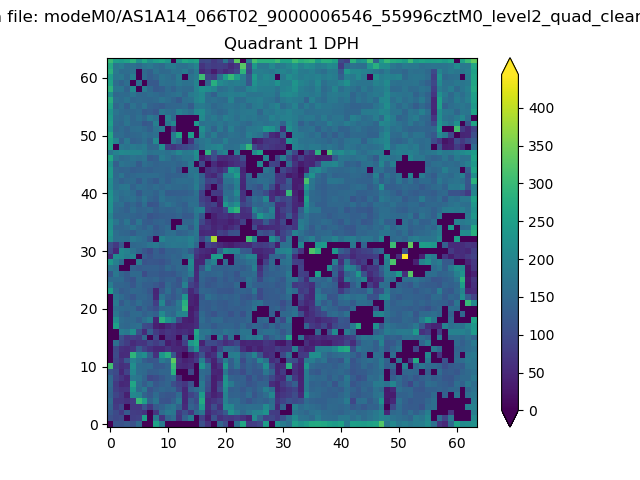 |
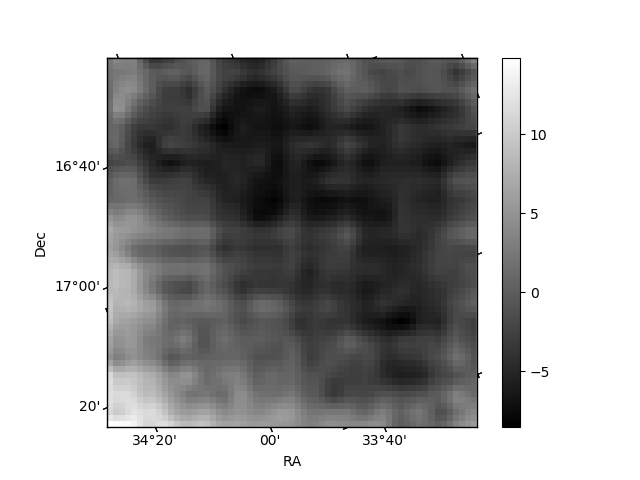
Quadrant B |
|---|---|---|---|
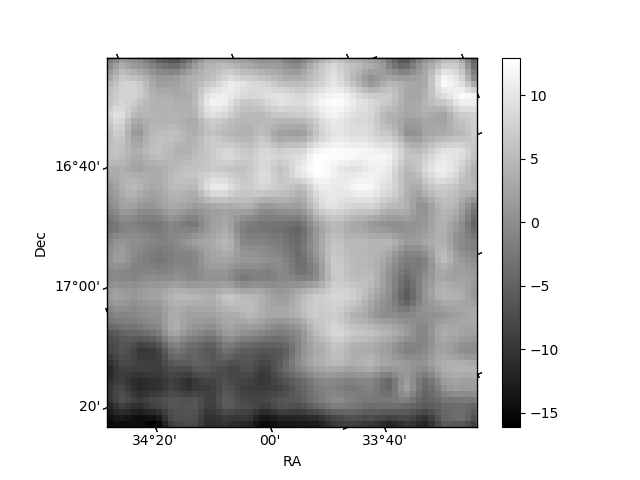
| Quadrant D | 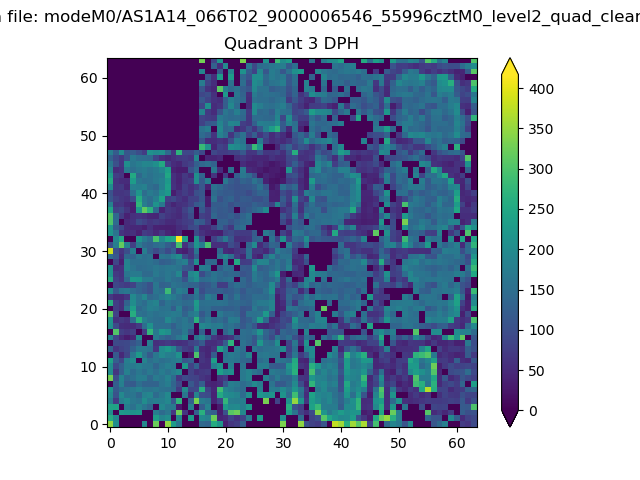 |
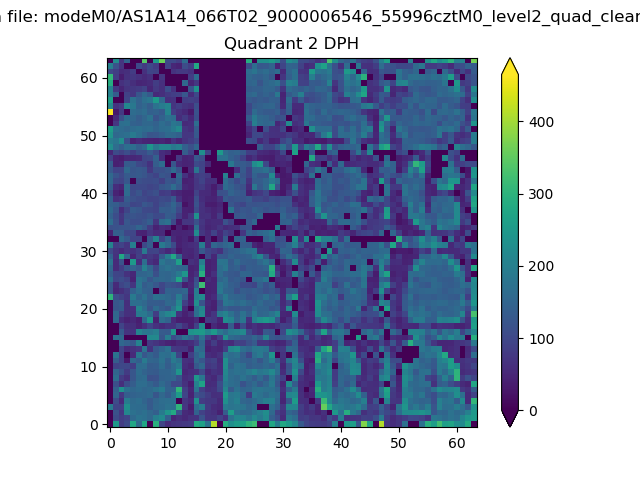 |
Quadrant C |
| Plot type | Count rate plots | Images |
|---|---|---|
| Comparison with Poisson distribution Blue bars denote a histogram of data divided into 1 sec bins. Red curve is a Poisson curve with rate = median count rate of data. |
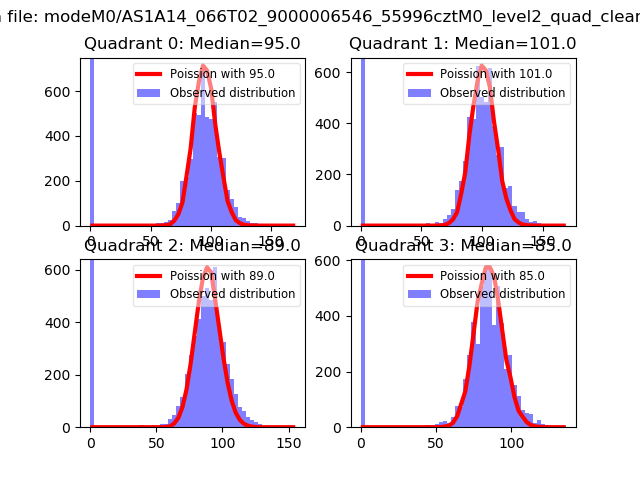 |
 |
| Quadrant-wise count rates Data is divided into 100 sec bins |
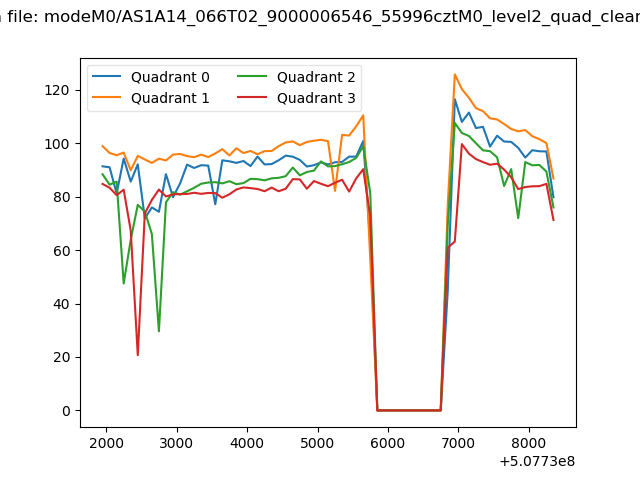 |
|
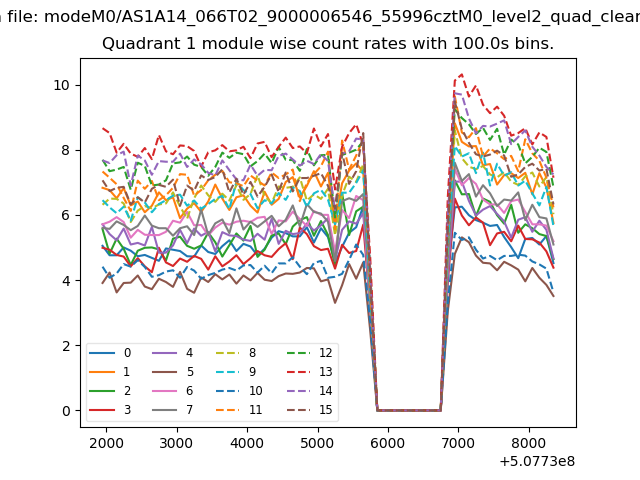
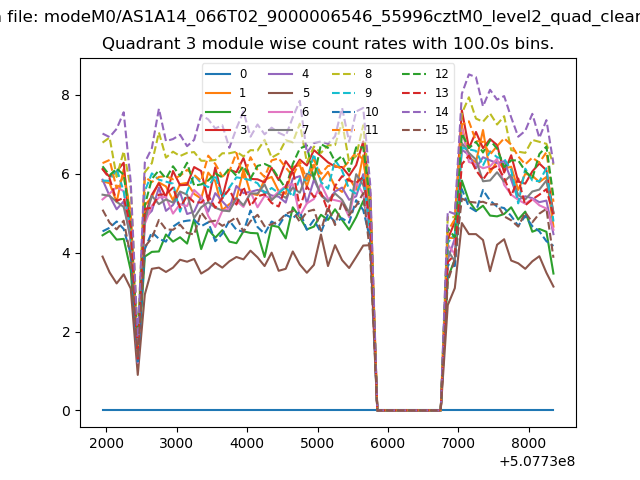
| Module-wise count rates for Quadrant A Data is divided into 100 sec bins |
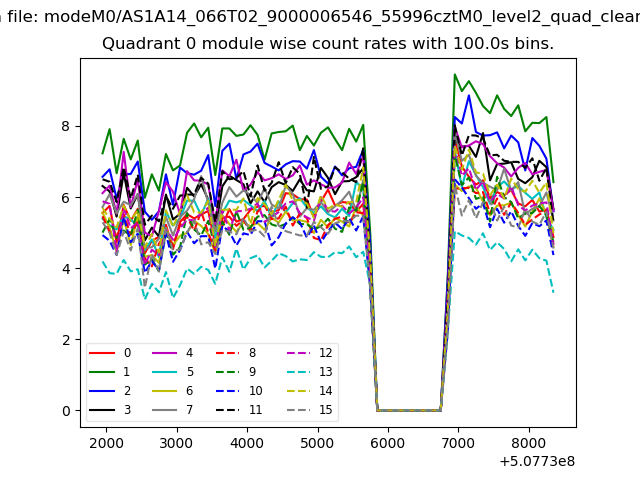 |
 |
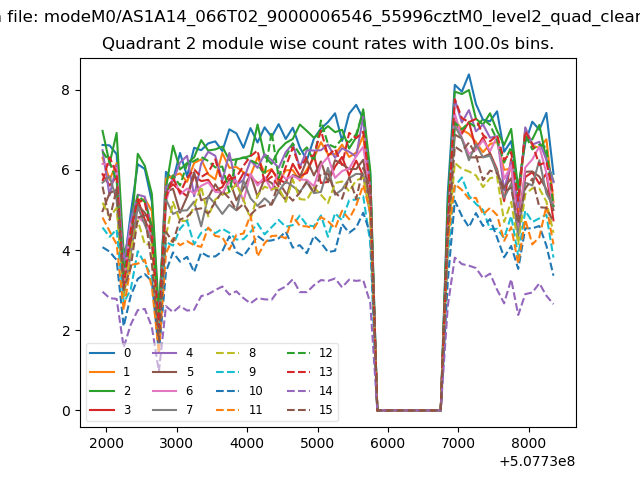
| Module-wise count rates for Quadrant B Data is divided into 100 sec bins |
 |
 |
| Module-wise count rates for Quadrant C Data is divided into 100 sec bins |
 |
 |
| Module-wise count rates for Quadrant D Data is divided into 100 sec bins |
 |
 |
| Parameter | Plot |
|---|---|
| CZT HV Monitor | 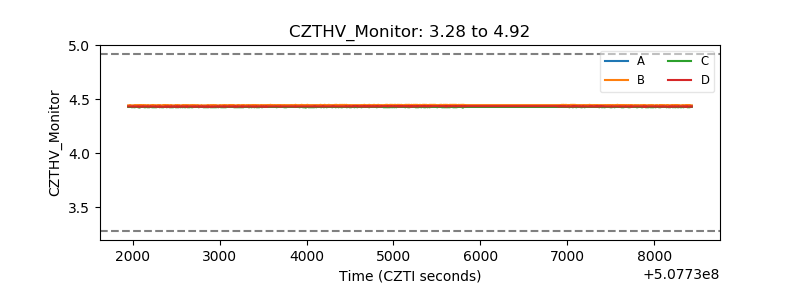 |
| D_VDD | 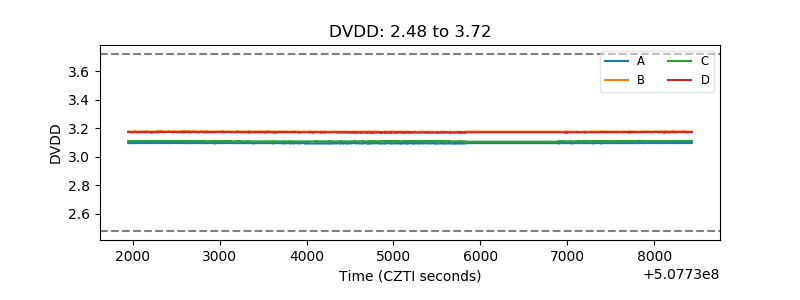 |
| Temperature 1 | 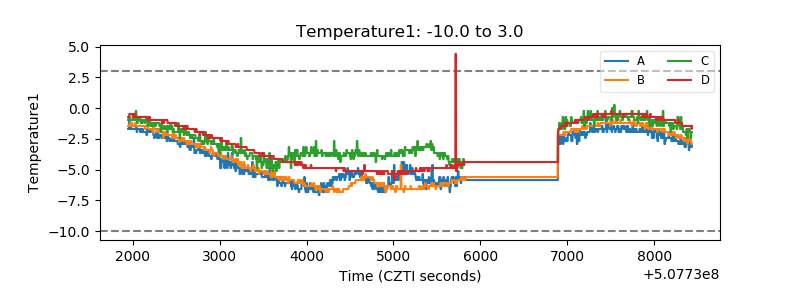 |
| Veto HV Monitor | 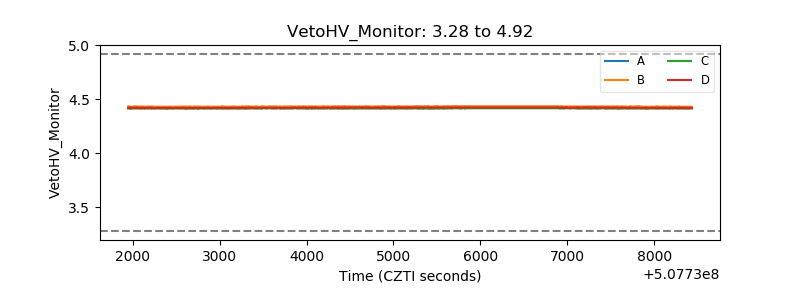 |
| Veto LLD | 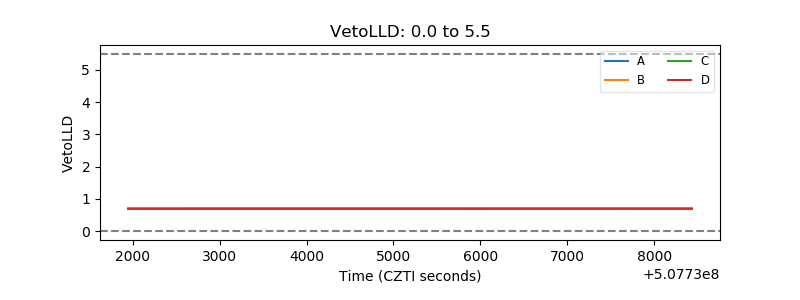 |
| Alpha Counter | 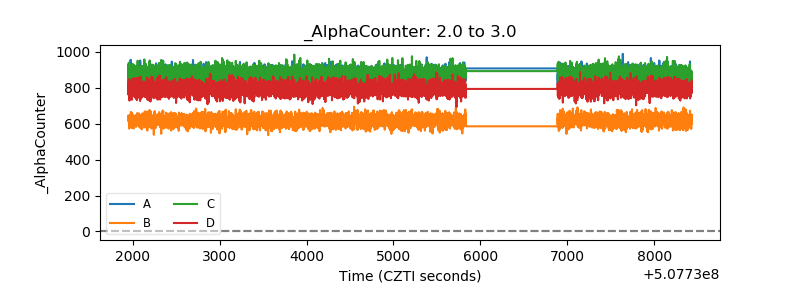 |
| _CPM_Rate | 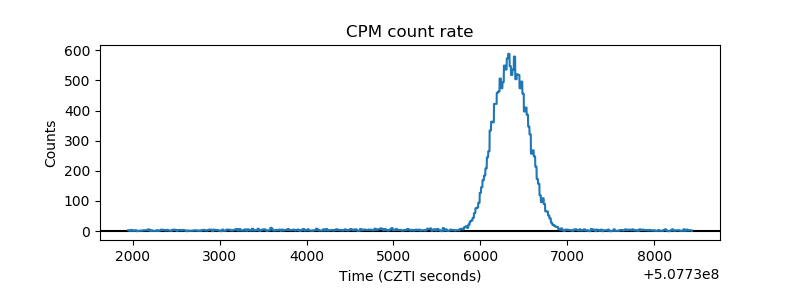 |
| CZT Counter | 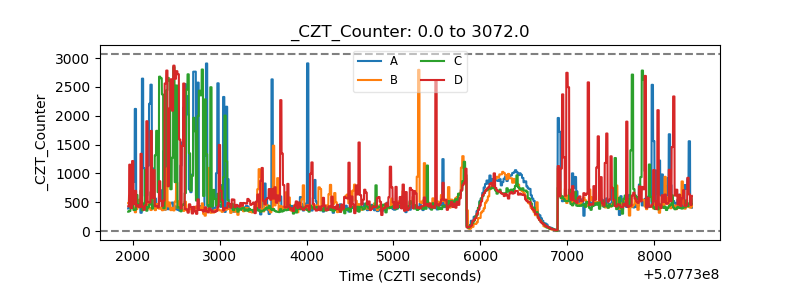 |
| +2.5 Volts monitor | 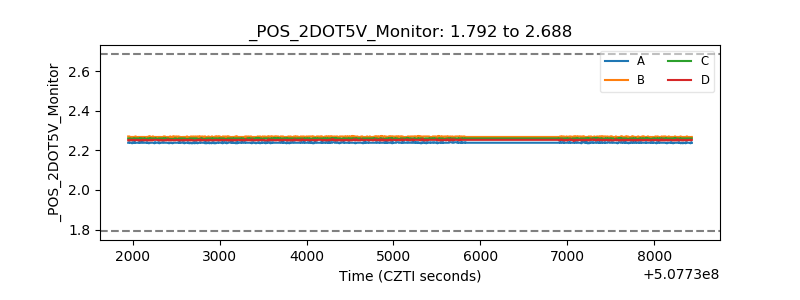 |
| +5 Volts monitor |  |
| _ROLL_ROT | 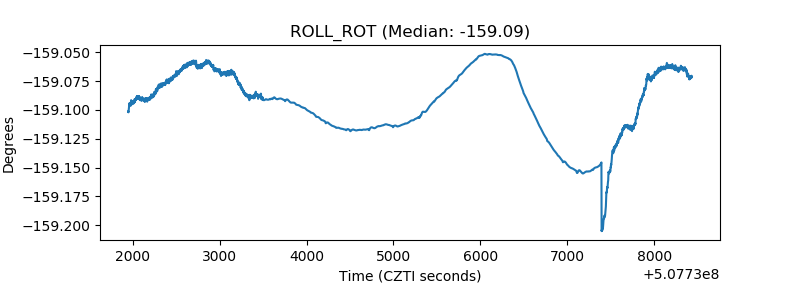 |
| _Roll_DEC | 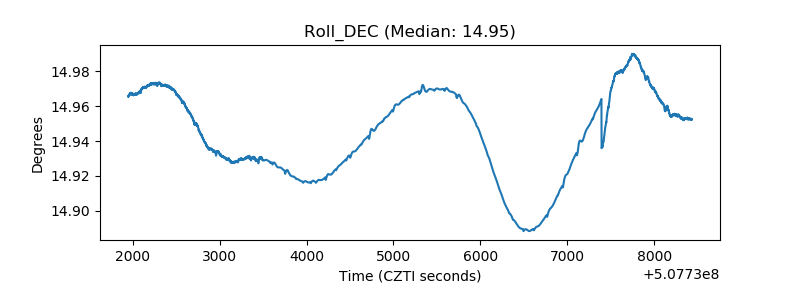 |
| _Roll_RA | 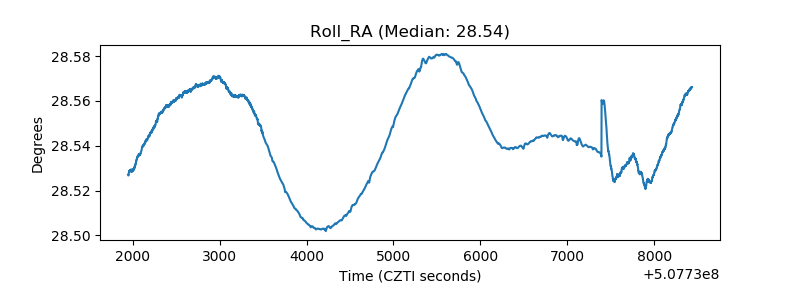 |
| Veto Counter | 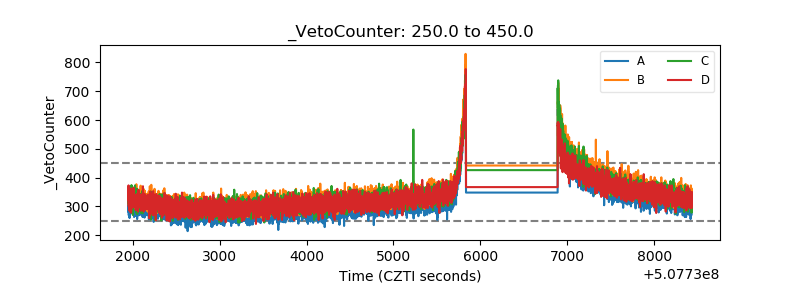 |