| Param | Original file | Final file |
|---|---|---|
| Filename | modeM0/AS1A14_066T02_9000006546_55997cztM0_level2.fits | modeM0/AS1A14_066T02_9000006546_55997cztM0_level2_quad_clean.evt |
| Size (bytes) | 744,416,640 | 153,987,840 |
| Size | 709.9 MB | 146.9 MB |
| Events in quadrant A | 6,241,992 | 1,013,292 |
| Events in quadrant B | 5,981,200 | 1,086,115 |
| Events in quadrant C | 6,413,309 | 936,010 |
| Events in quadrant D | 8,085,494 | 882,180 |
| Mode M9 | |||
|---|---|---|---|
| Quadrant | BADHDUFLAG | Total packets | Discarded packets |
| A | 0 | 23 | 0 |
| B | 0 | 23 | 0 |
| C | 0 | 23 | 0 |
| D | 0 | 23 | 0 |
| Mode M0 | |||
|---|---|---|---|
| Quadrant | BADHDUFLAG | Total packets | Discarded packets |
| A | 0 | 26253 | 2 |
| B | 0 | 25466 | 2 |
| C | 0 | 27314 | 2 |
| D | 0 | 31527 | 2 |
| Mode SS | |||
|---|---|---|---|
| Quadrant | BADHDUFLAG | Total packets | Discarded packets |
| A | 0 | 218 | 0 |
| B | 0 | 218 | 0 |
| C | 0 | 218 | 0 |
| D | 0 | 218 | 0 |
| Quadrant | Total seconds | Saturated seconds | Saturation percentage |
|---|---|---|---|
| A | 10759 | 306 | 2.844130% |
| B | 10760 | 204 | 1.895911% |
| C | 10760 | 507 | 4.711896% |
| D | 10760 | 576 | 5.353160% |
Noise dominated data is calculated using 1-second bins in cleaned event files. If a bin has >2000 counts, and if more than 50% of those come from <1% of pixels, then it is considered to be noise-dominated and hence unusable.
| Quadrant | # 1 sec bins | Bins with >0 counts | Bins with >2000 counts | High rate bins dominated by noise | Noise dominated (total time) | Noise dominated (detector-on time) | Marked lightcurve |
|---|---|---|---|---|---|---|---|
| A | 12939 | 10760 | 292 | 292 | 2.26% | 2.71% | 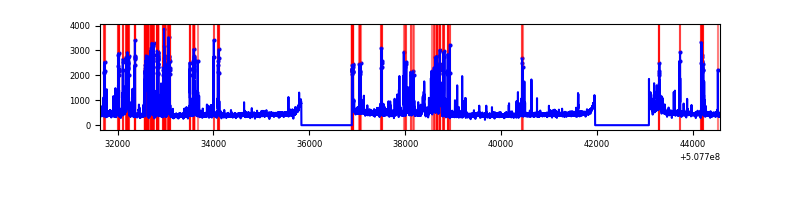 |
| B | 12940 | 10760 | 114 | 114 | 0.88% | 1.06% | 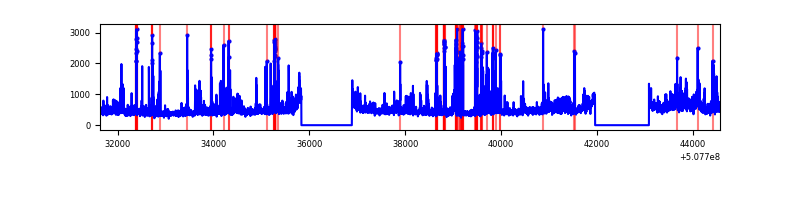 |
| C | 12940 | 10762 | 497 | 497 | 3.84% | 4.62% | 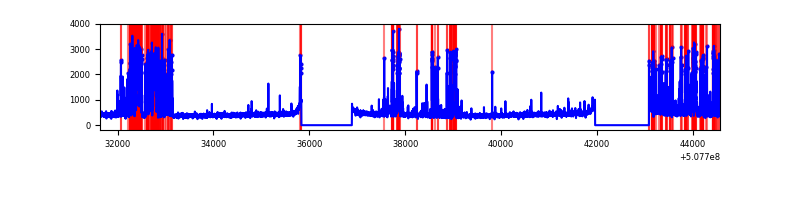 |
| D | 12940 | 10761 | 559 | 559 | 4.32% | 5.19% | 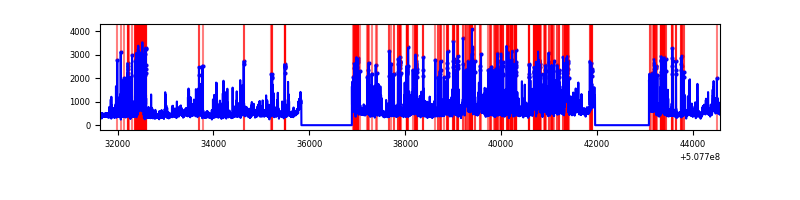 |
Top three noisy pixels from each quadrant. If the there are fewer than three noisy pixels in the level2.evt file, extra rows are filled as -1
| Pixel properties | Quadrant properties | ||||||
|---|---|---|---|---|---|---|---|
| Quadrant | DetID | PixID | Counts | Sigma | Mean | Median | Sigma |
| A | 7 | 64 | 931956 | 3280.76 | 1135 | 1107 | 283.7 |
| A | 15 | 32 | 274741 | 964.42 | 1135 | 1107 | 283.7 |
| A | 0 | 8 | 214501 | 752.1 | 1135 | 1107 | 283.7 |
| B | 2 | 249 | 448584 | 1878.65 | 1125 | 1085 | 238.2 |
| B | 5 | 236 | 267976 | 1120.44 | 1125 | 1085 | 238.2 |
| B | 0 | 199 | 189478 | 790.9 | 1125 | 1085 | 238.2 |
| C | 12 | 254 | 1742785 | 5832.19 | 1086 | 1076 | 298.6 |
| C | 12 | 249 | 167038 | 555.73 | 1086 | 1076 | 298.6 |
| C | 13 | 3 | 58632 | 192.73 | 1086 | 1076 | 298.6 |
| D | 8 | 240 | 1077785 | 3499.57 | 1082 | 1036 | 307.7 |
| D | 2 | 249 | 1063532 | 3453.25 | 1082 | 1036 | 307.7 |
| D | 11 | 129 | 295096 | 955.73 | 1082 | 1036 | 307.7 |
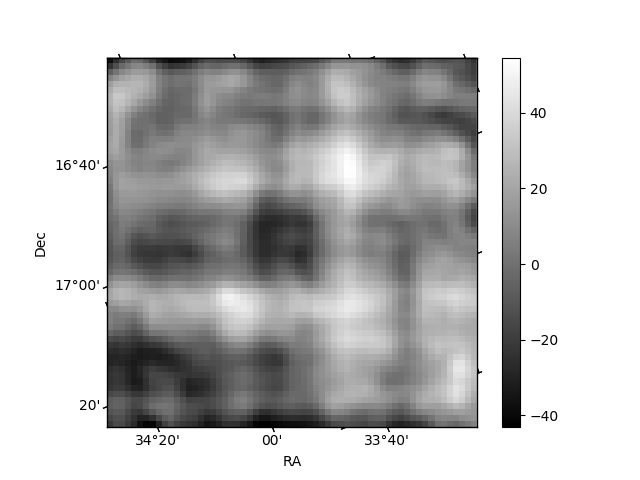
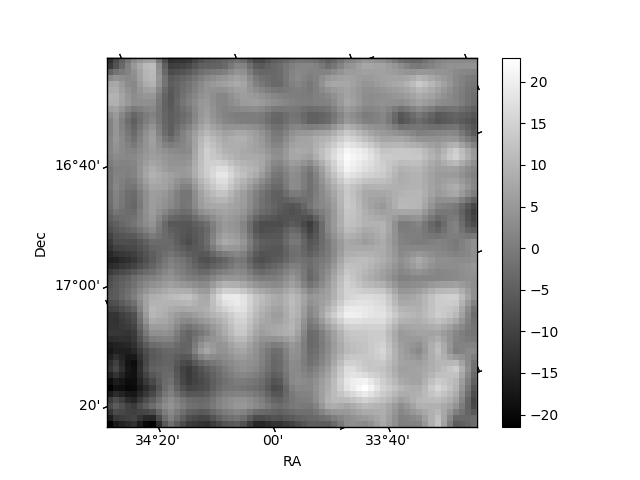
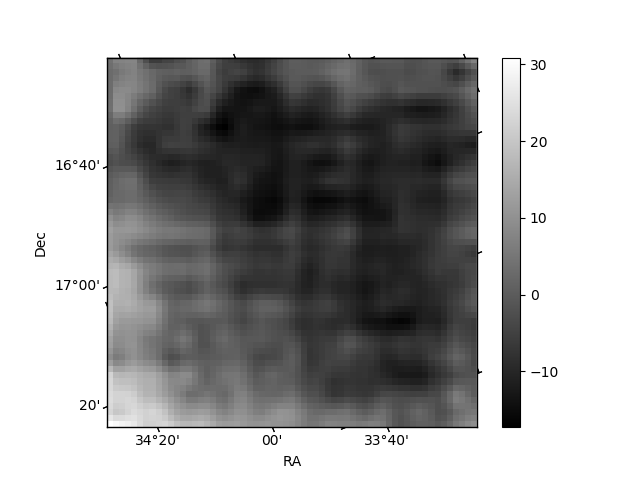
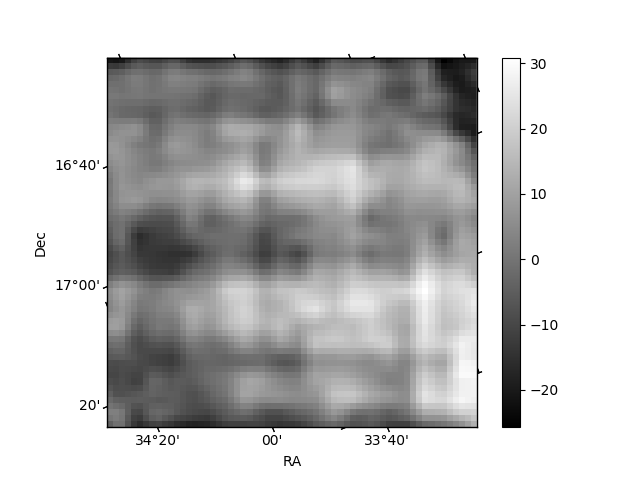
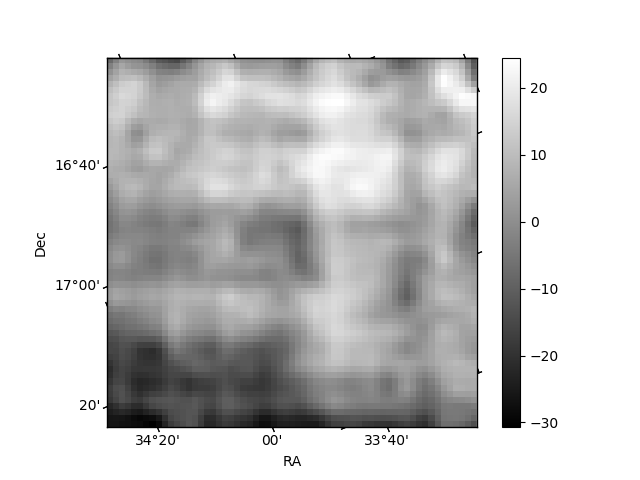
Histogram calculated using DETX and DETY for each event in the final _common_clean file
| Quadrant A | 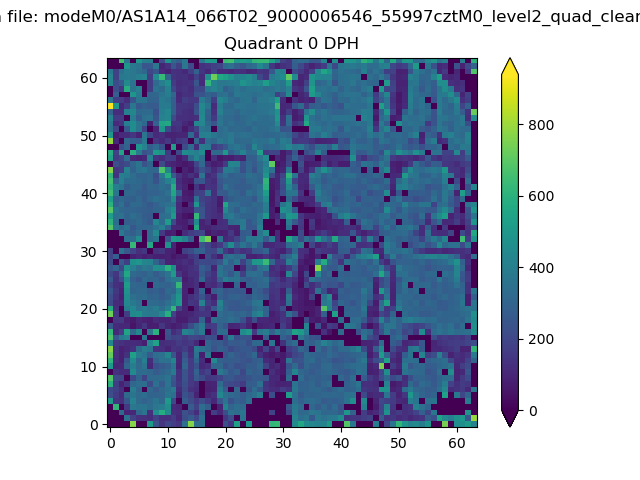 |
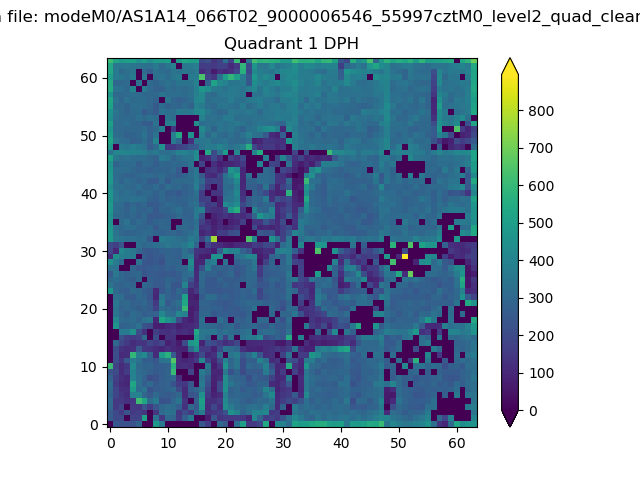 |
Quadrant B |
|---|---|---|---|
| Quadrant D | 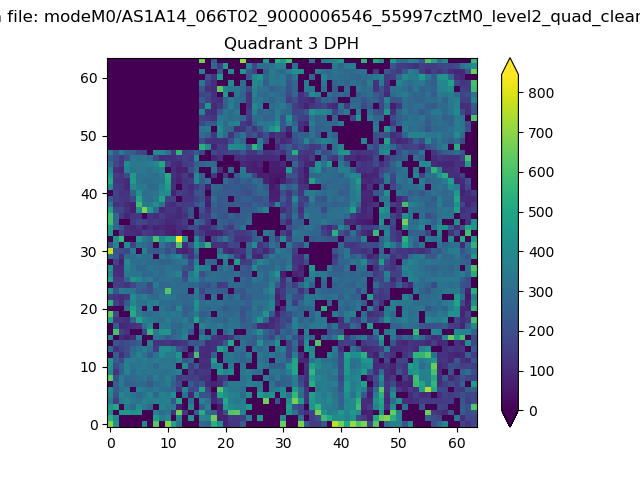 |
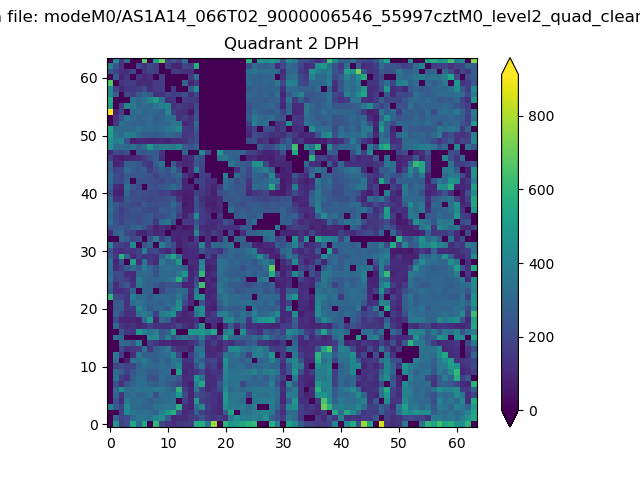 |
Quadrant C |
| Plot type | Count rate plots | Images |
|---|---|---|
| Comparison with Poisson distribution Blue bars denote a histogram of data divided into 1 sec bins. Red curve is a Poisson curve with rate = median count rate of data. |
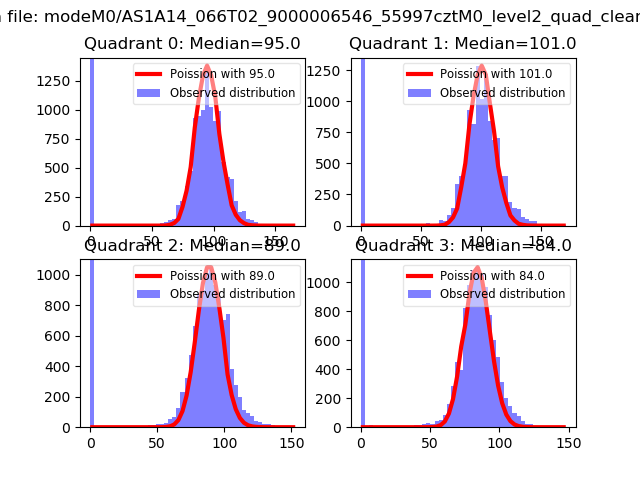 |
 |
| Quadrant-wise count rates Data is divided into 100 sec bins |
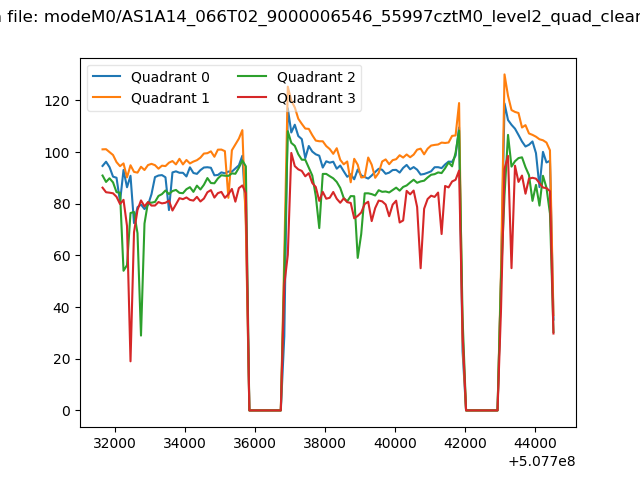 |
|
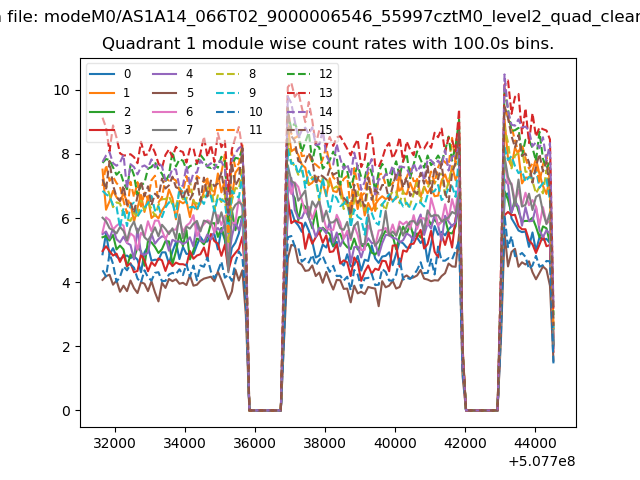
| Module-wise count rates for Quadrant A Data is divided into 100 sec bins |
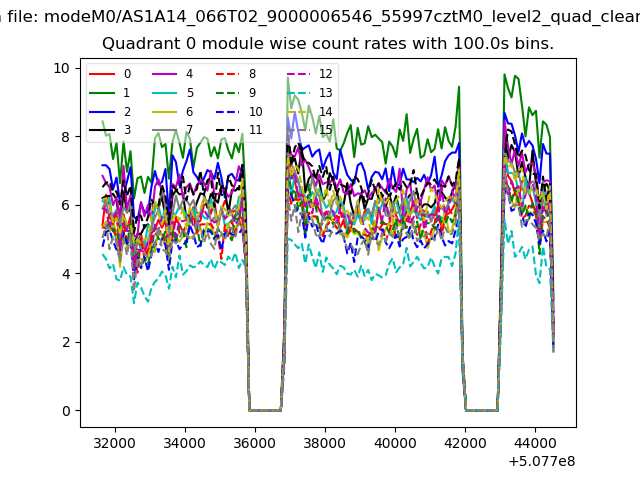 |
 |
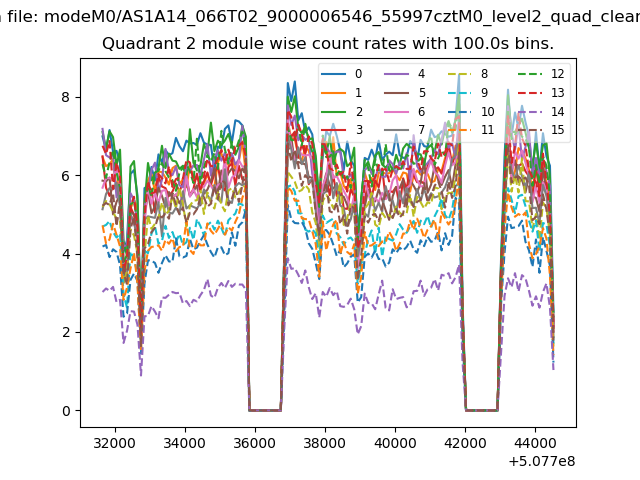
| Module-wise count rates for Quadrant B Data is divided into 100 sec bins |
 |
 |
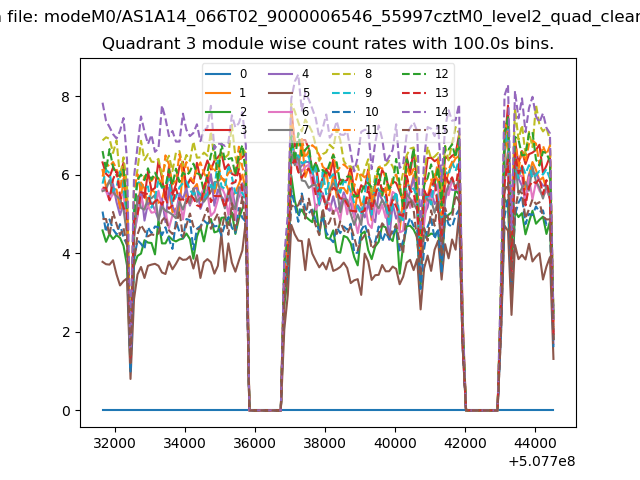
| Module-wise count rates for Quadrant C Data is divided into 100 sec bins |
 |
 |
| Module-wise count rates for Quadrant D Data is divided into 100 sec bins |
 |
 |
| Parameter | Plot |
|---|---|
| CZT HV Monitor | 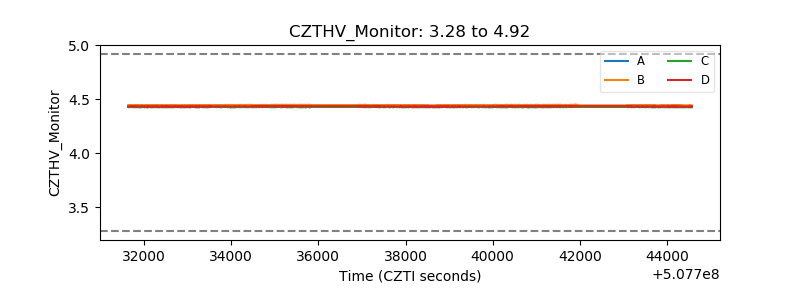 |
| D_VDD | 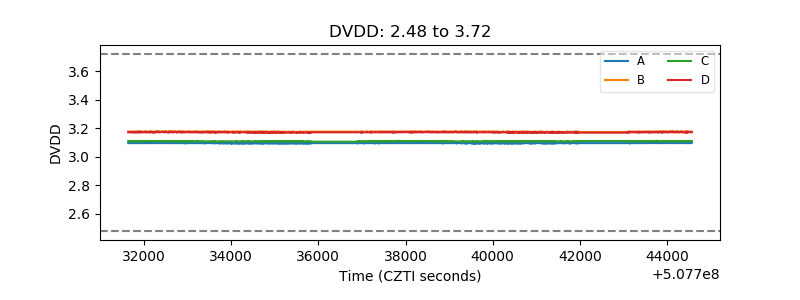 |
| Temperature 1 | 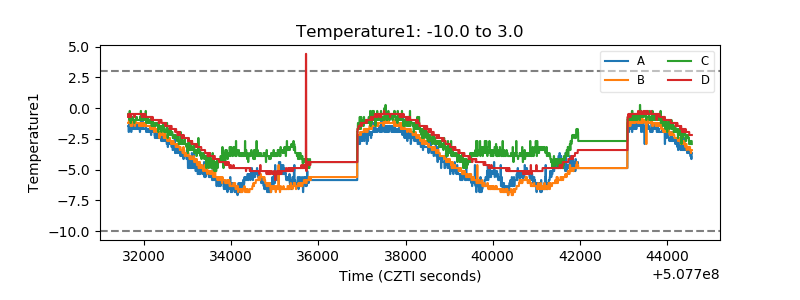 |
| Veto HV Monitor | 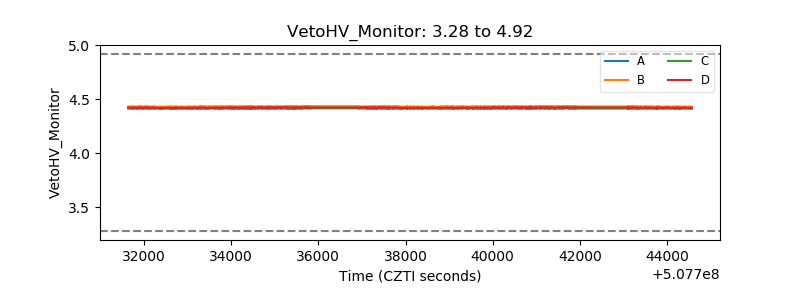 |
| Veto LLD | 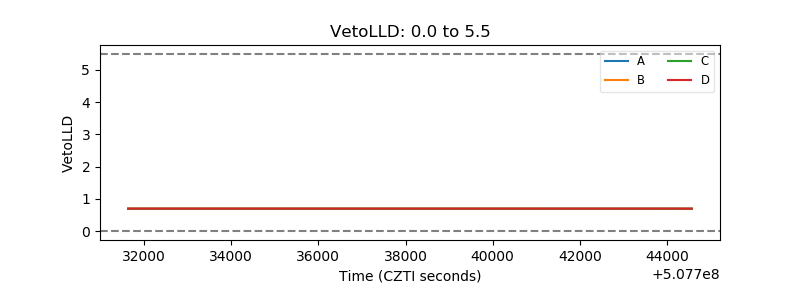 |
| Alpha Counter | 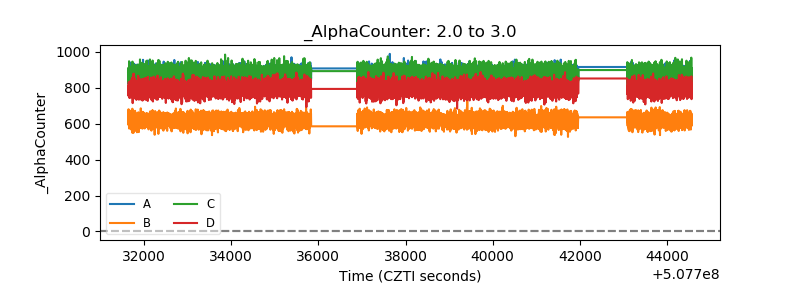 |
| _CPM_Rate | 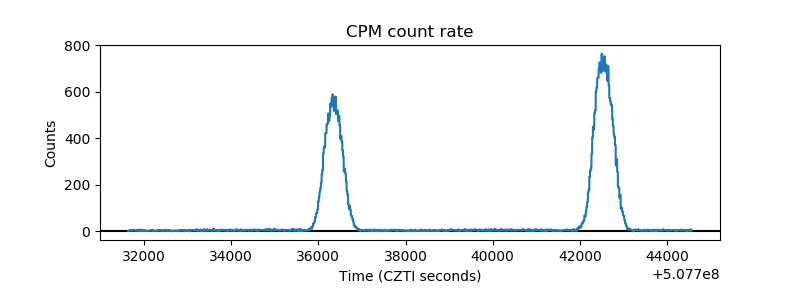 |
| CZT Counter | 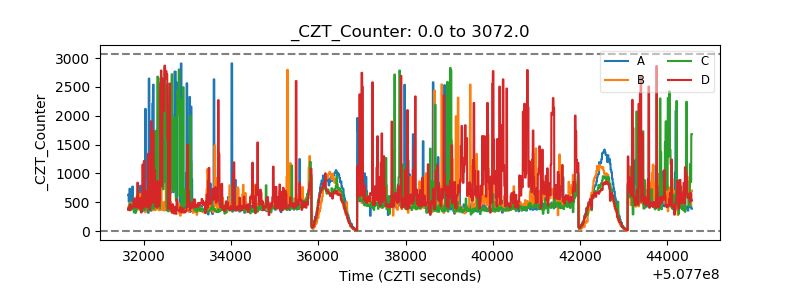 |
| +2.5 Volts monitor |  |
| +5 Volts monitor |  |
| _ROLL_ROT | 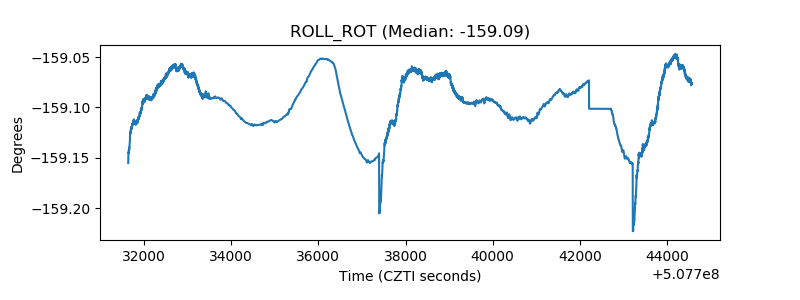 |
| _Roll_DEC | 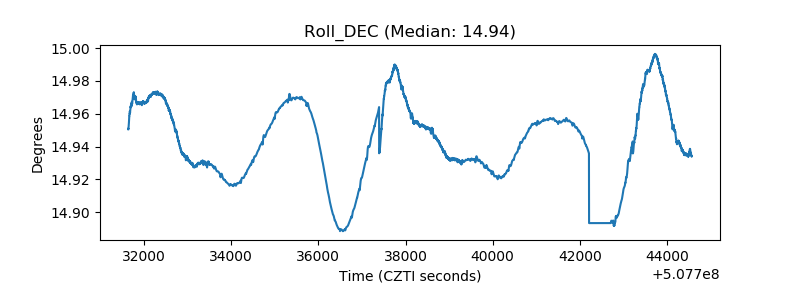 |
| _Roll_RA | 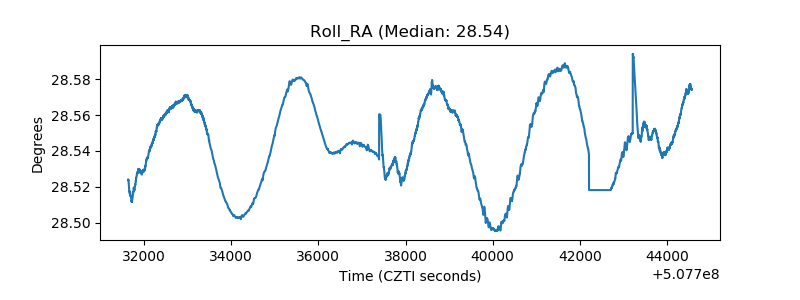 |
| Veto Counter | 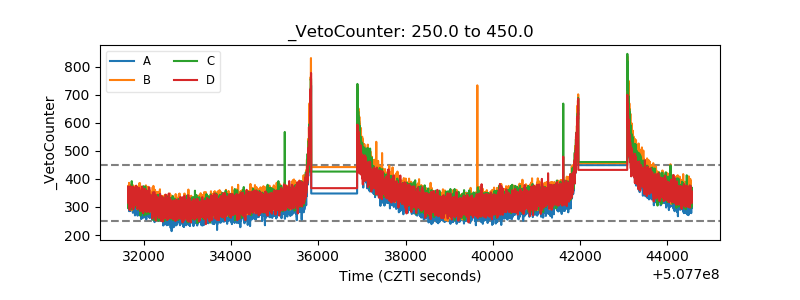 |