| Param | Original file | Final file |
|---|---|---|
| Filename | modeM0/AS1A14_066T02_9000006546_55999cztM0_level2.fits | modeM0/AS1A14_066T02_9000006546_55999cztM0_level2_quad_clean.evt |
| Size (bytes) | 493,401,600 | 91,252,800 |
| Size | 470.5 MB | 87.0 MB |
| Events in quadrant A | 5,955,796 | 558,271 |
| Events in quadrant B | 3,584,304 | 661,732 |
| Events in quadrant C | 3,901,306 | 556,388 |
| Events in quadrant D | 4,326,738 | 540,831 |
| Mode M9 | |||
|---|---|---|---|
| Quadrant | BADHDUFLAG | Total packets | Discarded packets |
| A | 0 | 19 | 0 |
| B | 0 | 20 | 0 |
| C | 0 | 20 | 0 |
| D | 0 | 20 | 0 |
| Mode M0 | |||
|---|---|---|---|
| Quadrant | BADHDUFLAG | Total packets | Discarded packets |
| A | 0 | 22146 | 2 |
| B | 0 | 15118 | 2 |
| C | 0 | 16459 | 2 |
| D | 0 | 17305 | 2 |
| Mode SS | |||
|---|---|---|---|
| Quadrant | BADHDUFLAG | Total packets | Discarded packets |
| A | 0 | 130 | 0 |
| B | 0 | 130 | 0 |
| C | 0 | 130 | 0 |
| D | 0 | 130 | 0 |
| Quadrant | Total seconds | Saturated seconds | Saturation percentage |
|---|---|---|---|
| A | 6387 | 728 | 11.398152% |
| B | 6387 | 101 | 1.581337% |
| C | 6386 | 409 | 6.404635% |
| D | 6386 | 275 | 4.306295% |
Noise dominated data is calculated using 1-second bins in cleaned event files. If a bin has >2000 counts, and if more than 50% of those come from <1% of pixels, then it is considered to be noise-dominated and hence unusable.
| Quadrant | # 1 sec bins | Bins with >0 counts | Bins with >2000 counts | High rate bins dominated by noise | Noise dominated (total time) | Noise dominated (detector-on time) | Marked lightcurve |
|---|---|---|---|---|---|---|---|
| A | 7527 | 6387 | 717 | 717 | 9.53% | 11.23% |  |
| B | 7527 | 6387 | 18 | 18 | 0.24% | 0.28% | 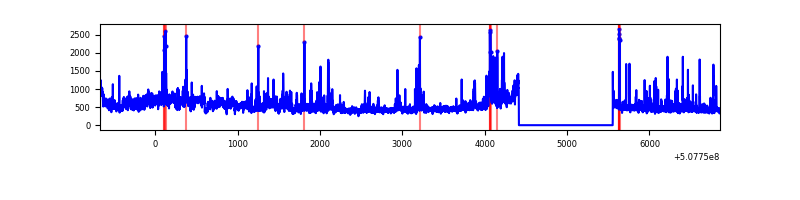 |
| C | 7526 | 6386 | 381 | 381 | 5.06% | 5.97% | 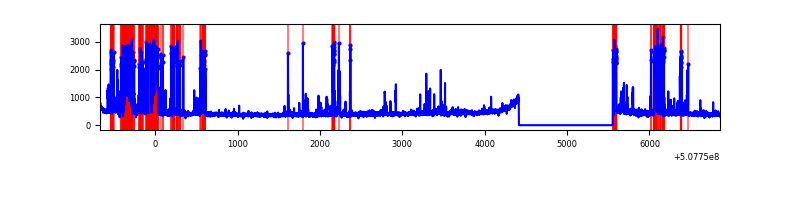 |
| D | 7526 | 6387 | 250 | 250 | 3.32% | 3.91% | 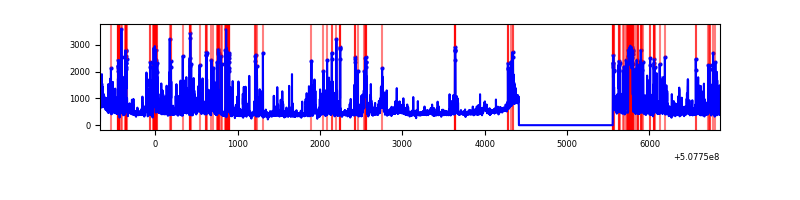 |
Top three noisy pixels from each quadrant. If the there are fewer than three noisy pixels in the level2.evt file, extra rows are filled as -1
| Pixel properties | Quadrant properties | ||||||
|---|---|---|---|---|---|---|---|
| Quadrant | DetID | PixID | Counts | Sigma | Mean | Median | Sigma |
| A | 12 | 115 | 1880188 | 11528.57 | 657 | 643 | 163.0 |
| A | 0 | 8 | 760315 | 4659.6 | 657 | 643 | 163.0 |
| A | 4 | 249 | 245836 | 1503.94 | 657 | 643 | 163.0 |
| B | 5 | 236 | 365916 | 2498.82 | 684 | 660 | 146.2 |
| B | 0 | 173 | 156160 | 1063.82 | 684 | 660 | 146.2 |
| B | 0 | 199 | 66523 | 450.59 | 684 | 660 | 146.2 |
| C | 12 | 254 | 1108619 | 6181.16 | 650 | 644 | 179.3 |
| C | 14 | 80 | 144373 | 801.83 | 650 | 644 | 179.3 |
| C | 12 | 252 | 36054 | 197.54 | 650 | 644 | 179.3 |
| D | 8 | 240 | 712874 | 3818.38 | 655 | 626 | 186.5 |
| D | 6 | 239 | 289462 | 1548.46 | 655 | 626 | 186.5 |
| D | 11 | 129 | 192977 | 1031.2 | 655 | 626 | 186.5 |
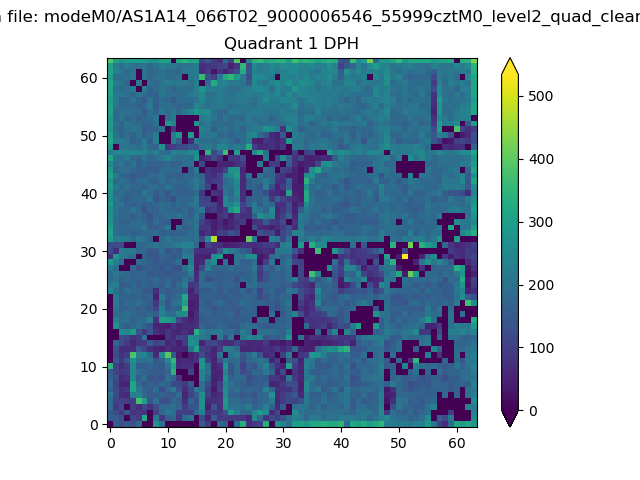
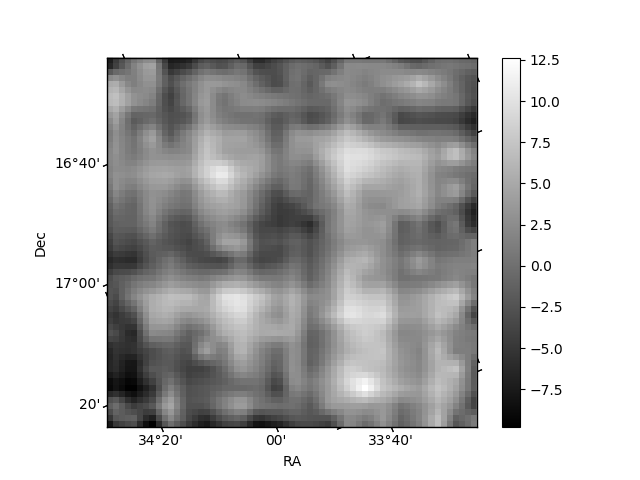
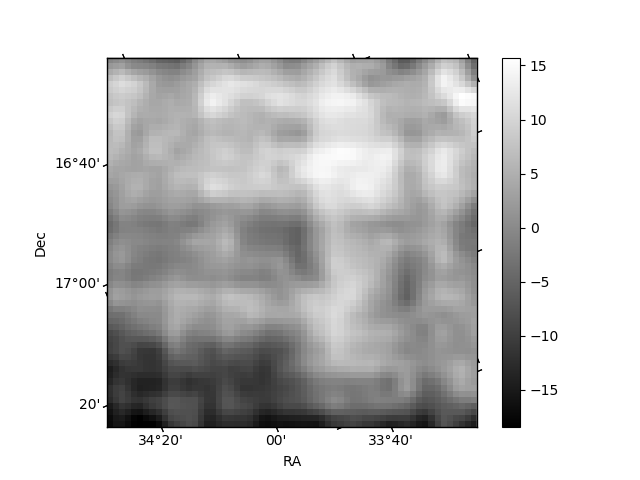
Histogram calculated using DETX and DETY for each event in the final _common_clean file
| Quadrant A | 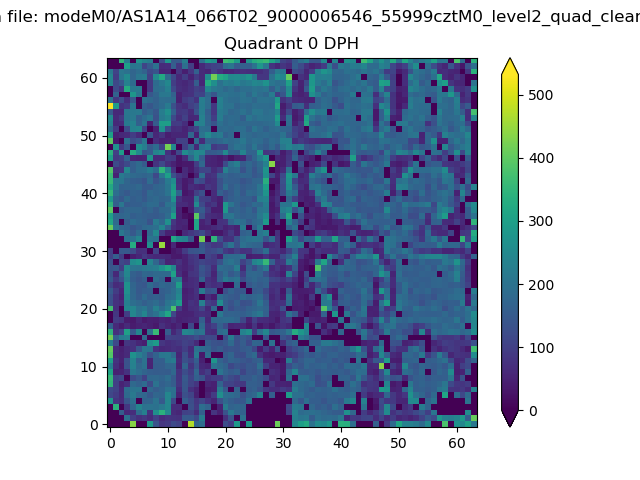 |
 |
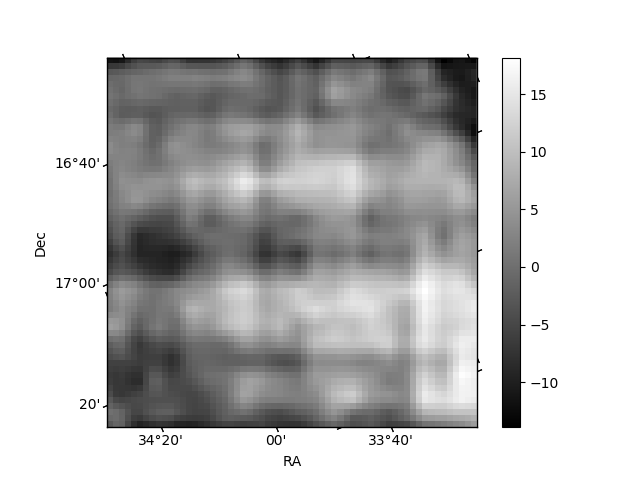
Quadrant B |
|---|---|---|---|
| Quadrant D | 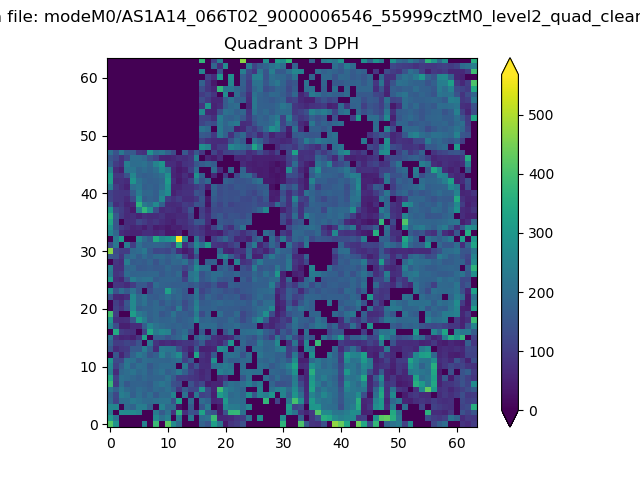 |
 |
Quadrant C |
| Plot type | Count rate plots | Images |
|---|---|---|
| Comparison with Poisson distribution Blue bars denote a histogram of data divided into 1 sec bins. Red curve is a Poisson curve with rate = median count rate of data. |
 |
 |
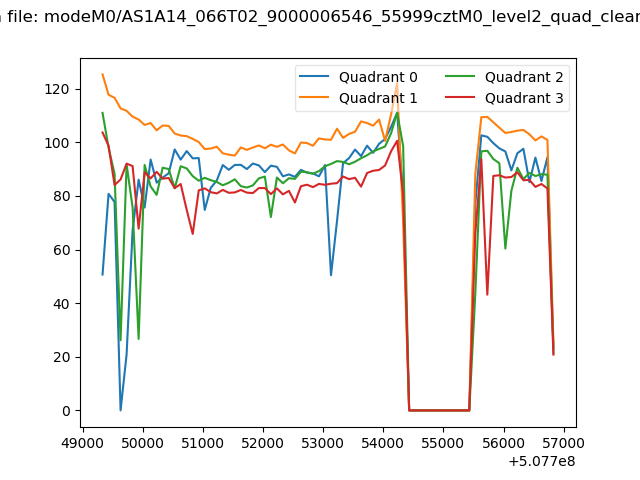
| Quadrant-wise count rates Data is divided into 100 sec bins |
 |
|
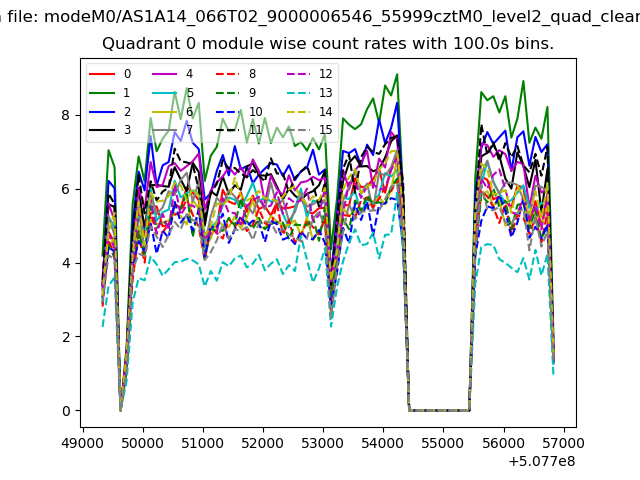
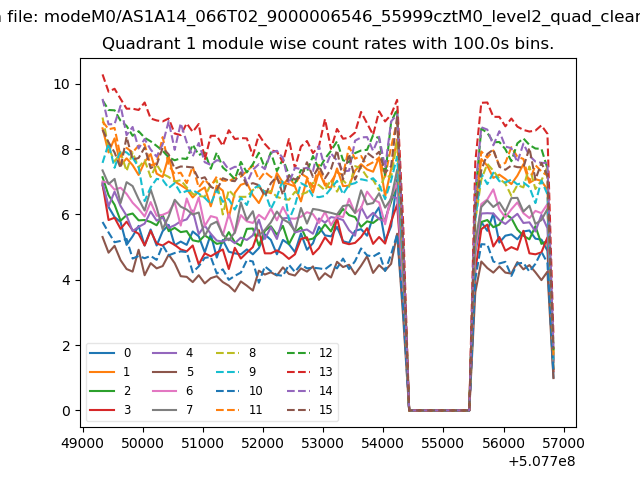
| Module-wise count rates for Quadrant A Data is divided into 100 sec bins |
 |
 |
| Module-wise count rates for Quadrant B Data is divided into 100 sec bins |
 |
 |
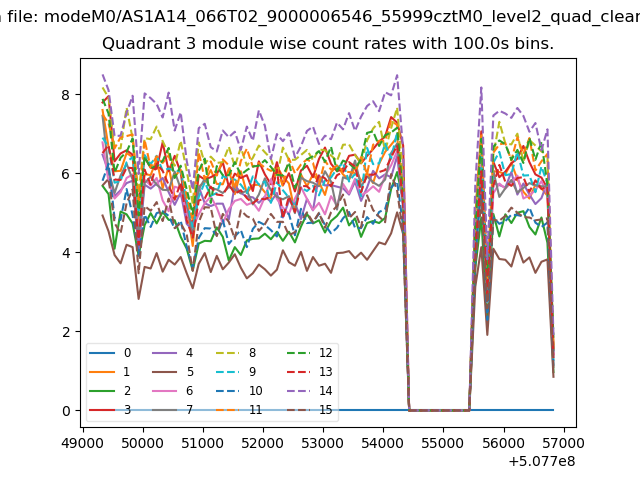
| Module-wise count rates for Quadrant C Data is divided into 100 sec bins |
 |
 |
| Module-wise count rates for Quadrant D Data is divided into 100 sec bins |
 |
 |
| Parameter | Plot |
|---|---|
| CZT HV Monitor | 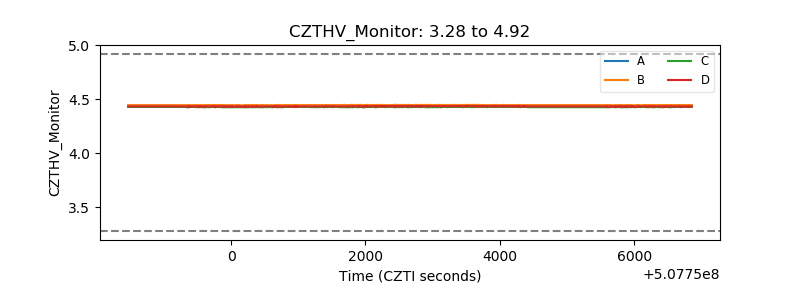 |
| D_VDD | 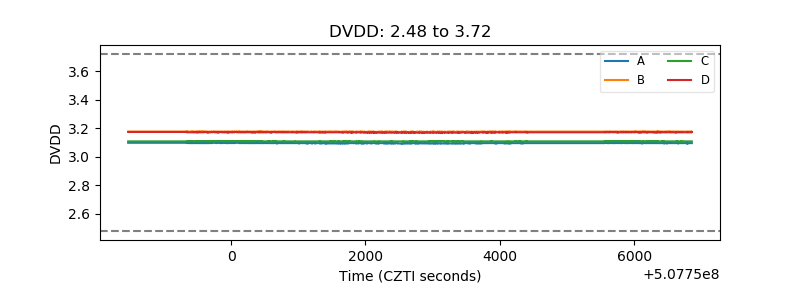 |
| Temperature 1 |  |
| Veto HV Monitor | 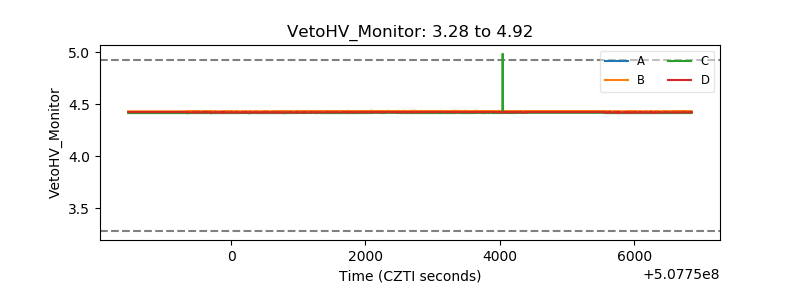 |
| Veto LLD | 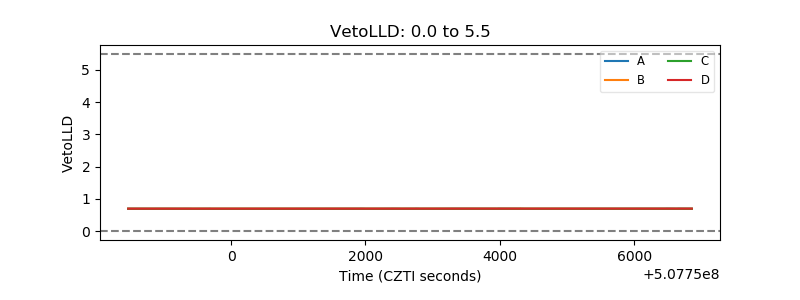 |
| Alpha Counter |  |
| _CPM_Rate | 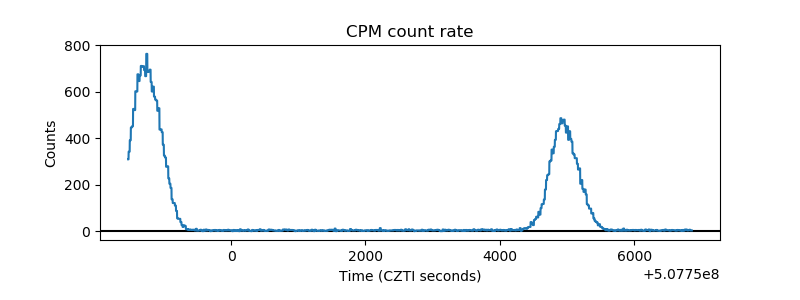 |
| CZT Counter |  |
| +2.5 Volts monitor |  |
| +5 Volts monitor |  |
| _ROLL_ROT | 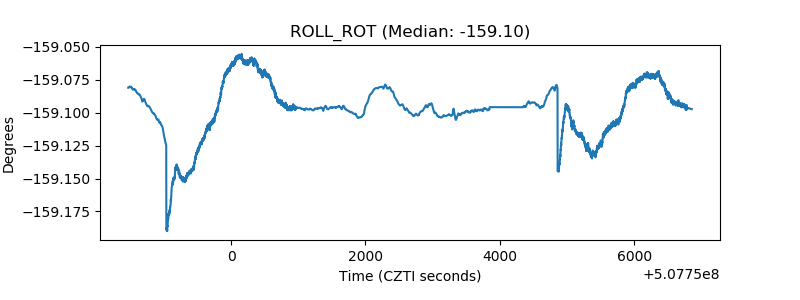 |
| _Roll_DEC | 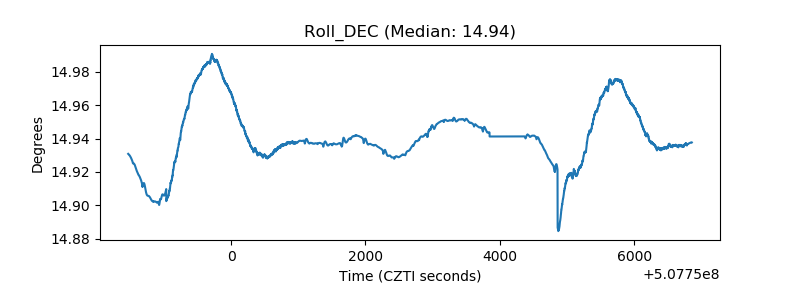 |
| _Roll_RA |  |
| Veto Counter | 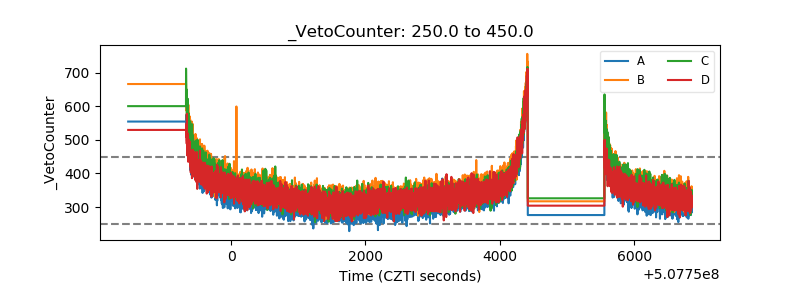 |