| Param | Original file | Final file |
|---|---|---|
| Filename | modeM0/AS1A14_066T02_9000006546_56000cztM0_level2.fits | modeM0/AS1A14_066T02_9000006546_56000cztM0_level2_quad_clean.evt |
| Size (bytes) | 577,932,480 | 88,591,680 |
| Size | 551.2 MB | 84.5 MB |
| Events in quadrant A | 9,564,121 | 420,991 |
| Events in quadrant B | 3,546,303 | 663,186 |
| Events in quadrant C | 3,253,721 | 584,994 |
| Events in quadrant D | 4,507,836 | 545,689 |
| Mode M9 | |||
|---|---|---|---|
| Quadrant | BADHDUFLAG | Total packets | Discarded packets |
| A | 0 | 21 | 0 |
| B | 0 | 21 | 0 |
| C | 0 | 21 | 0 |
| D | 0 | 21 | 0 |
| Mode M0 | |||
|---|---|---|---|
| Quadrant | BADHDUFLAG | Total packets | Discarded packets |
| A | 0 | 32964 | 2 |
| B | 0 | 15201 | 2 |
| C | 0 | 14947 | 2 |
| D | 0 | 18207 | 2 |
| Mode SS | |||
|---|---|---|---|
| Quadrant | BADHDUFLAG | Total packets | Discarded packets |
| A | 0 | 138 | 0 |
| B | 0 | 138 | 0 |
| C | 0 | 138 | 0 |
| D | 0 | 138 | 0 |
| Quadrant | Total seconds | Saturated seconds | Saturation percentage |
|---|---|---|---|
| A | 6704 | 2502 | 37.321002% |
| B | 6705 | 134 | 1.998509% |
| C | 6705 | 154 | 2.296793% |
| D | 6705 | 297 | 4.429530% |
Noise dominated data is calculated using 1-second bins in cleaned event files. If a bin has >2000 counts, and if more than 50% of those come from <1% of pixels, then it is considered to be noise-dominated and hence unusable.
| Quadrant | # 1 sec bins | Bins with >0 counts | Bins with >2000 counts | High rate bins dominated by noise | Noise dominated (total time) | Noise dominated (detector-on time) | Marked lightcurve |
|---|---|---|---|---|---|---|---|
| A | 8818 | 6703 | 2427 | 2427 | 27.52% | 36.21% |  |
| B | 8820 | 6706 | 37 | 37 | 0.42% | 0.55% |  |
| C | 8820 | 6706 | 106 | 106 | 1.20% | 1.58% |  |
| D | 8820 | 6707 | 276 | 276 | 3.13% | 4.12% |  |
Top three noisy pixels from each quadrant. If the there are fewer than three noisy pixels in the level2.evt file, extra rows are filled as -1
| Pixel properties | Quadrant properties | ||||||
|---|---|---|---|---|---|---|---|
| Quadrant | DetID | PixID | Counts | Sigma | Mean | Median | Sigma |
| A | 12 | 115 | 6544130 | 43304.88 | 606 | 591 | 151.1 |
| A | 3 | 14 | 187373 | 1236.12 | 606 | 591 | 151.1 |
| A | 7 | 64 | 115230 | 758.68 | 606 | 591 | 151.1 |
| B | 5 | 185 | 117449 | 757.99 | 715 | 686 | 154.0 |
| B | 0 | 199 | 116426 | 751.35 | 715 | 686 | 154.0 |
| B | 0 | 173 | 95996 | 618.73 | 715 | 686 | 154.0 |
| C | 12 | 254 | 386053 | 2010.12 | 698 | 693 | 191.7 |
| C | 12 | 252 | 48680 | 250.31 | 698 | 693 | 191.7 |
| C | 14 | 80 | 24183 | 122.53 | 698 | 693 | 191.7 |
| D | 8 | 240 | 595303 | 3043.49 | 689 | 659 | 195.4 |
| D | 2 | 249 | 362281 | 1850.84 | 689 | 659 | 195.4 |
| D | 6 | 239 | 301533 | 1539.92 | 689 | 659 | 195.4 |
Histogram calculated using DETX and DETY for each event in the final _common_clean file
| Quadrant A |  |
 |
Quadrant B |
|---|---|---|---|
| Quadrant D |  |
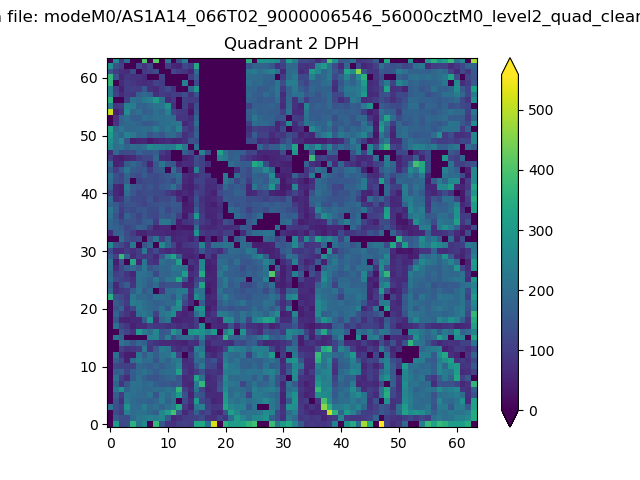 |
Quadrant C |
| Plot type | Count rate plots | Images |
|---|---|---|
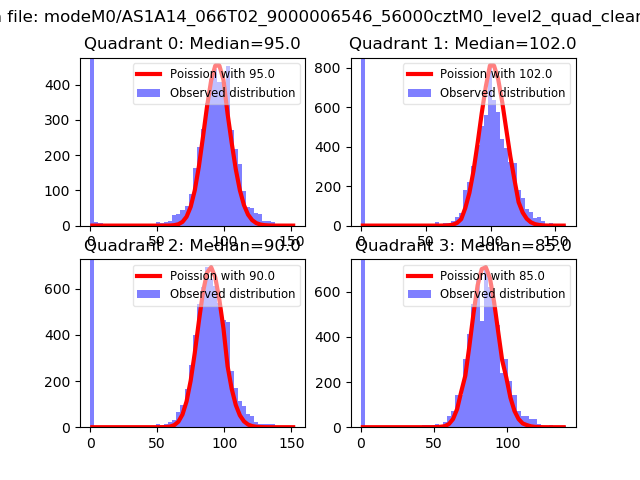
| Comparison with Poisson distribution Blue bars denote a histogram of data divided into 1 sec bins. Red curve is a Poisson curve with rate = median count rate of data. |
 |
 |
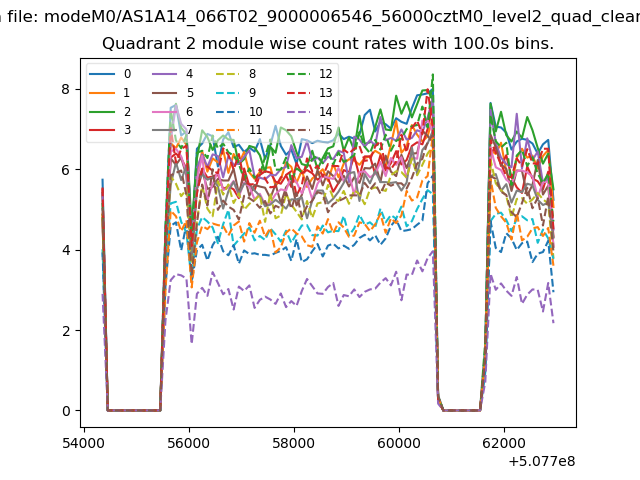
| Quadrant-wise count rates Data is divided into 100 sec bins |
 |
|
| Module-wise count rates for Quadrant A Data is divided into 100 sec bins |
 |
 |
| Module-wise count rates for Quadrant B Data is divided into 100 sec bins |
 |
 |
| Module-wise count rates for Quadrant C Data is divided into 100 sec bins |
 |
 |
| Module-wise count rates for Quadrant D Data is divided into 100 sec bins |
 |
 |
| Parameter | Plot |
|---|---|
| CZT HV Monitor |  |
| D_VDD |  |
| Temperature 1 |  |
| Veto HV Monitor |  |
| Veto LLD |  |
| Alpha Counter | 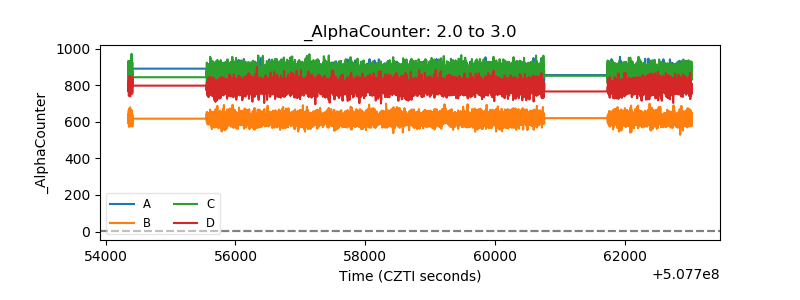 |
| _CPM_Rate |  |
| CZT Counter |  |
| +2.5 Volts monitor |  |
| +5 Volts monitor |  |
| _ROLL_ROT |  |
| _Roll_DEC |  |
| _Roll_RA |  |
| Veto Counter |  |