| Param | Original file | Final file |
|---|---|---|
| Filename | modeM0/AS1A14_066T02_9000006546_56001cztM0_level2.fits | modeM0/AS1A14_066T02_9000006546_56001cztM0_level2_quad_clean.evt |
| Size (bytes) | 681,099,840 | 92,557,440 |
| Size | 649.5 MB | 88.3 MB |
| Events in quadrant A | 10,682,797 | 443,493 |
| Events in quadrant B | 3,675,384 | 715,584 |
| Events in quadrant C | 3,331,582 | 636,431 |
| Events in quadrant D | 6,961,885 | 504,024 |
| Mode M9 | |||
|---|---|---|---|
| Quadrant | BADHDUFLAG | Total packets | Discarded packets |
| A | 0 | 7 | 0 |
| B | 0 | 7 | 0 |
| C | 0 | 7 | 0 |
| D | 0 | 7 | 0 |
| Mode M0 | |||
|---|---|---|---|
| Quadrant | BADHDUFLAG | Total packets | Discarded packets |
| A | 0 | 36712 | 1 |
| B | 0 | 16095 | 1 |
| C | 0 | 15689 | 1 |
| D | 0 | 25864 | 1 |
| Mode SS | |||
|---|---|---|---|
| Quadrant | BADHDUFLAG | Total packets | Discarded packets |
| A | 0 | 146 | 0 |
| B | 0 | 146 | 0 |
| C | 0 | 146 | 0 |
| D | 0 | 146 | 0 |
| Quadrant | Total seconds | Saturated seconds | Saturation percentage |
|---|---|---|---|
| A | 7224 | 2631 | 36.420266% |
| B | 7225 | 90 | 1.245675% |
| C | 7224 | 97 | 1.342746% |
| D | 7224 | 1252 | 17.331118% |
Noise dominated data is calculated using 1-second bins in cleaned event files. If a bin has >2000 counts, and if more than 50% of those come from <1% of pixels, then it is considered to be noise-dominated and hence unusable.
| Quadrant | # 1 sec bins | Bins with >0 counts | Bins with >2000 counts | High rate bins dominated by noise | Noise dominated (total time) | Noise dominated (detector-on time) | Marked lightcurve |
|---|---|---|---|---|---|---|---|
| A | 7904 | 7225 | 2655 | 2655 | 33.59% | 36.75% | 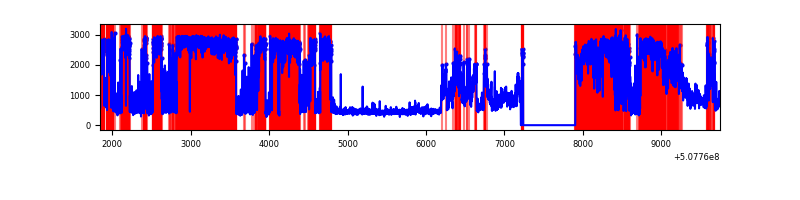 |
| B | 7905 | 7227 | 30 | 30 | 0.38% | 0.42% | 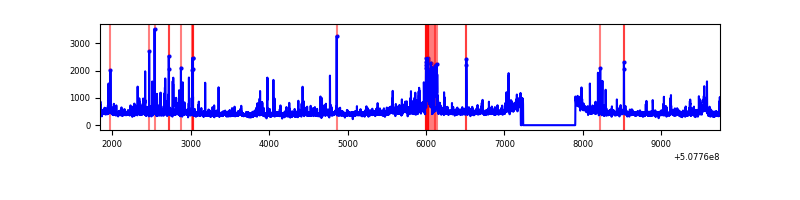 |
| C | 7904 | 7226 | 86 | 86 | 1.09% | 1.19% | 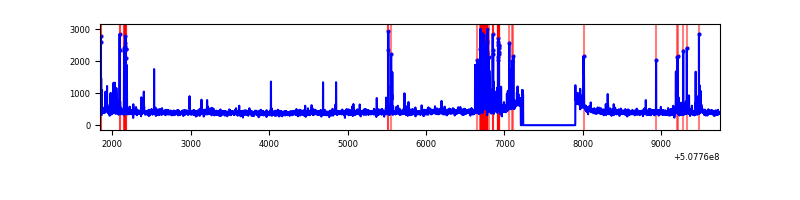 |
| D | 7904 | 7224 | 1255 | 1255 | 15.88% | 17.37% | 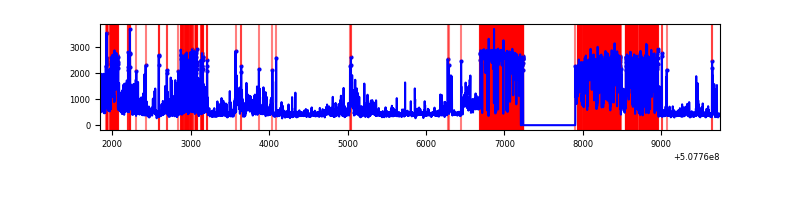 |
Top three noisy pixels from each quadrant. If the there are fewer than three noisy pixels in the level2.evt file, extra rows are filled as -1
| Pixel properties | Quadrant properties | ||||||
|---|---|---|---|---|---|---|---|
| Quadrant | DetID | PixID | Counts | Sigma | Mean | Median | Sigma |
| A | 12 | 115 | 7832410 | 50260.29 | 630 | 613 | 155.8 |
| A | 3 | 14 | 151456 | 968.03 | 630 | 613 | 155.8 |
| A | 4 | 3 | 76739 | 488.54 | 630 | 613 | 155.8 |
| B | 0 | 173 | 219694 | 1343.31 | 755 | 725 | 163.0 |
| B | 5 | 185 | 150503 | 918.84 | 755 | 725 | 163.0 |
| B | 0 | 199 | 73980 | 449.4 | 755 | 725 | 163.0 |
| C | 12 | 254 | 286185 | 1404.55 | 739 | 732 | 203.2 |
| C | 12 | 249 | 38876 | 187.68 | 739 | 732 | 203.2 |
| C | 12 | 252 | 37999 | 183.37 | 739 | 732 | 203.2 |
| D | 2 | 120 | 1368972 | 7272.26 | 657 | 627 | 188.2 |
| D | 2 | 62 | 1351723 | 7180.58 | 657 | 627 | 188.2 |
| D | 8 | 240 | 404545 | 2146.68 | 657 | 627 | 188.2 |
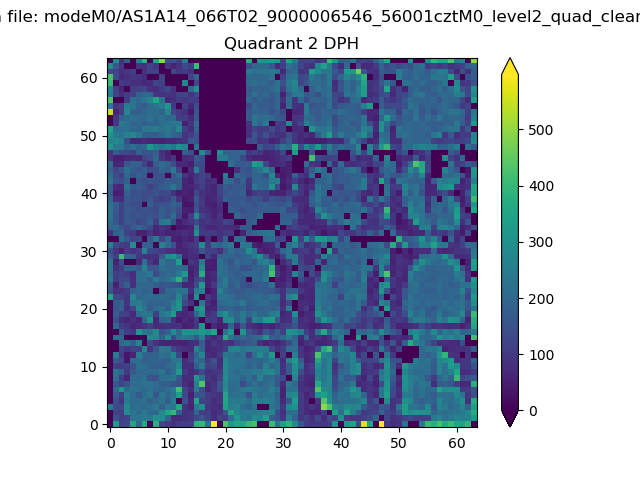
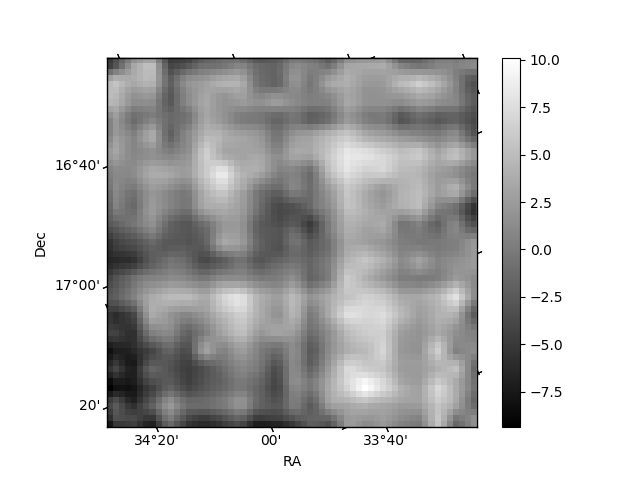
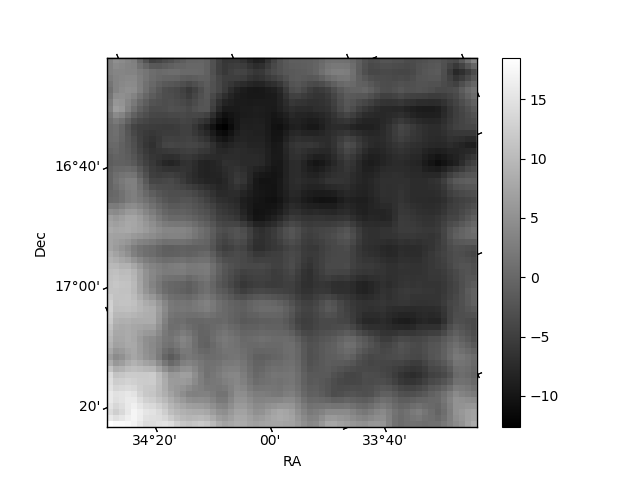
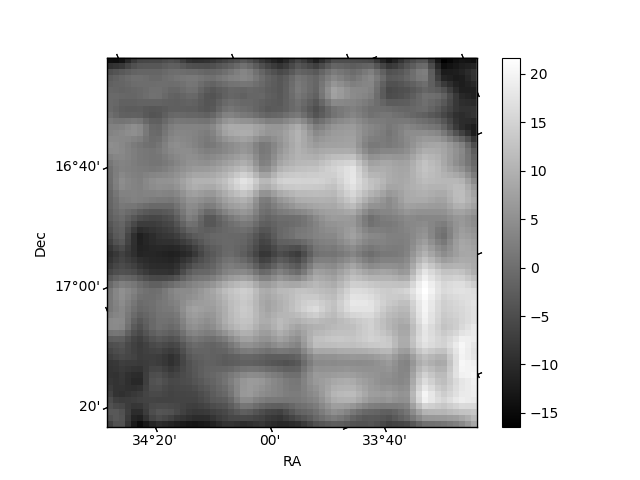
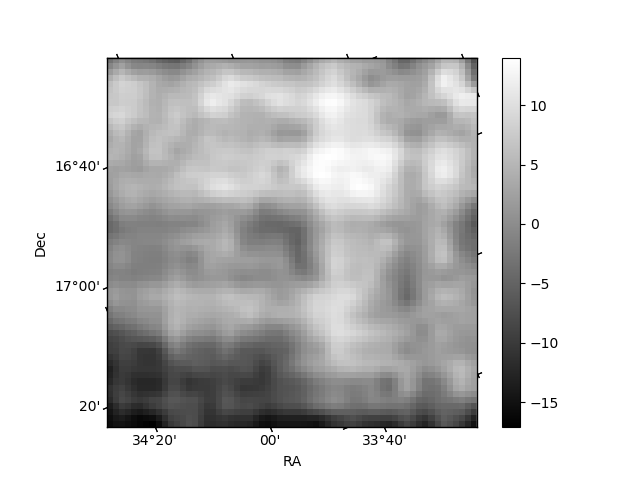
Histogram calculated using DETX and DETY for each event in the final _common_clean file
| Quadrant A | 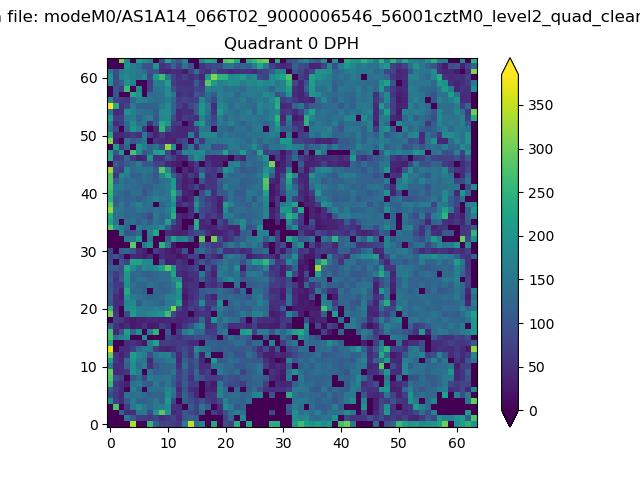 |
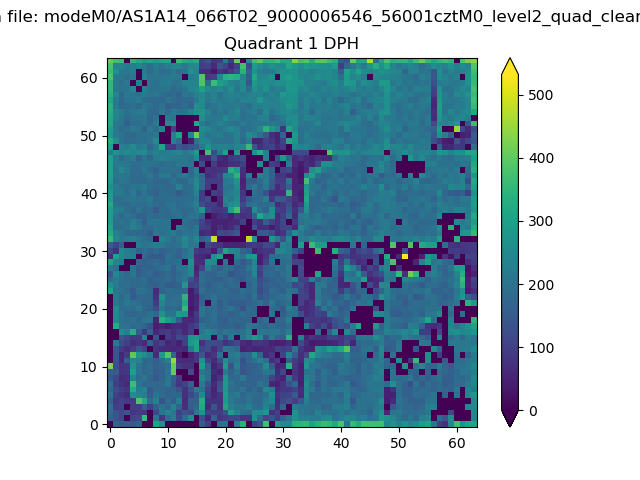 |
Quadrant B |
|---|---|---|---|
| Quadrant D | 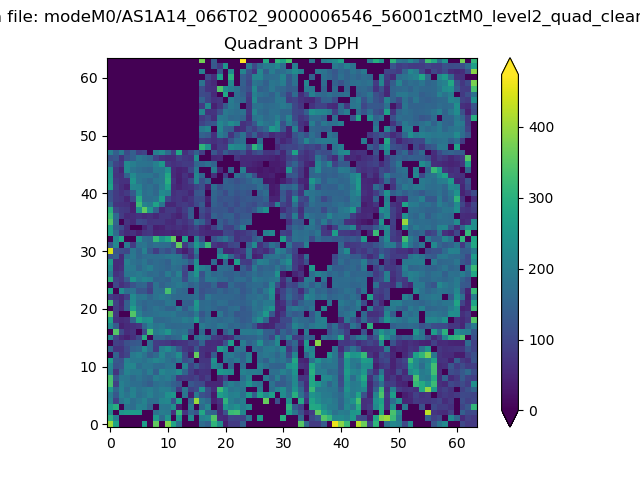 |
 |
Quadrant C |
| Plot type | Count rate plots | Images |
|---|---|---|
| Comparison with Poisson distribution Blue bars denote a histogram of data divided into 1 sec bins. Red curve is a Poisson curve with rate = median count rate of data. |
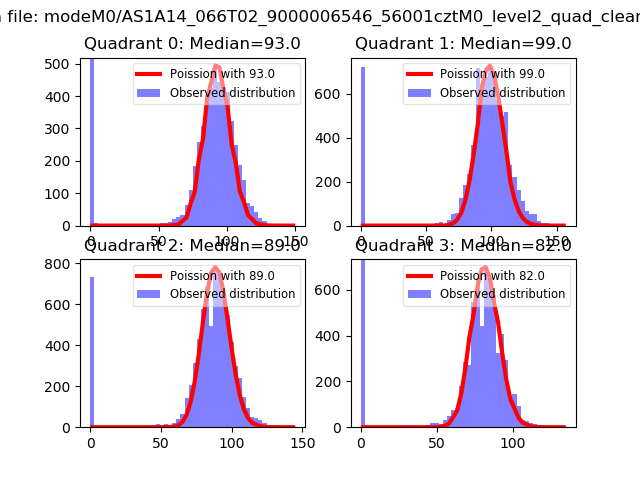 |
 |
| Quadrant-wise count rates Data is divided into 100 sec bins |
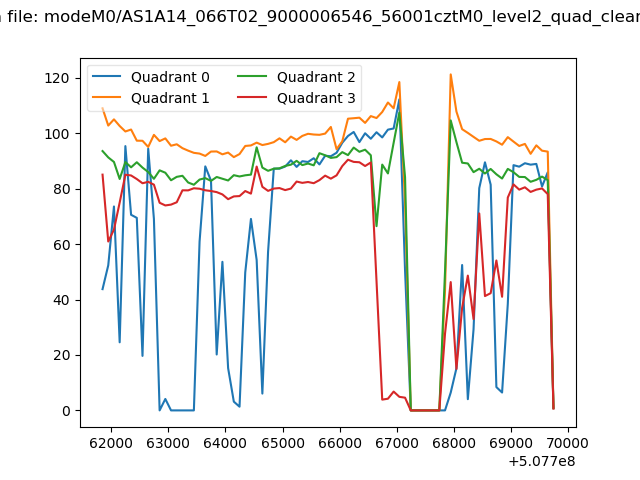 |
|
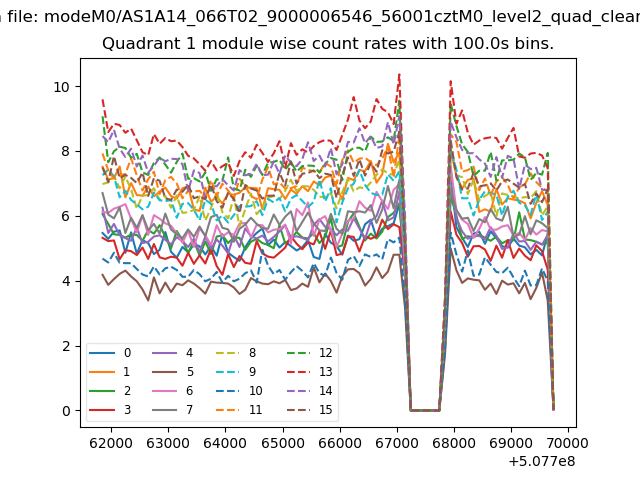
| Module-wise count rates for Quadrant A Data is divided into 100 sec bins |
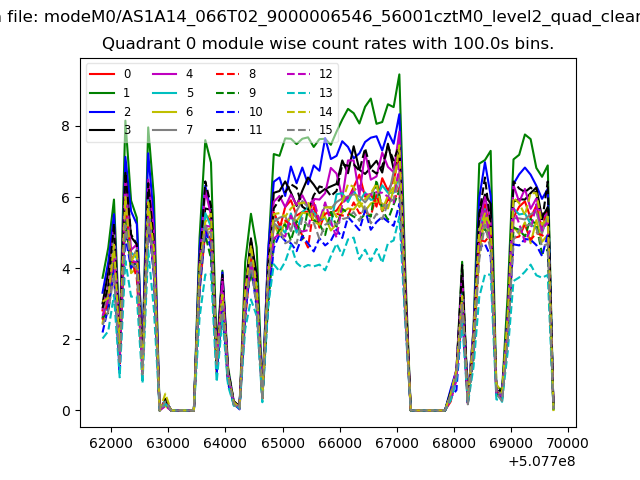 |
 |
| Module-wise count rates for Quadrant B Data is divided into 100 sec bins |
 |
 |
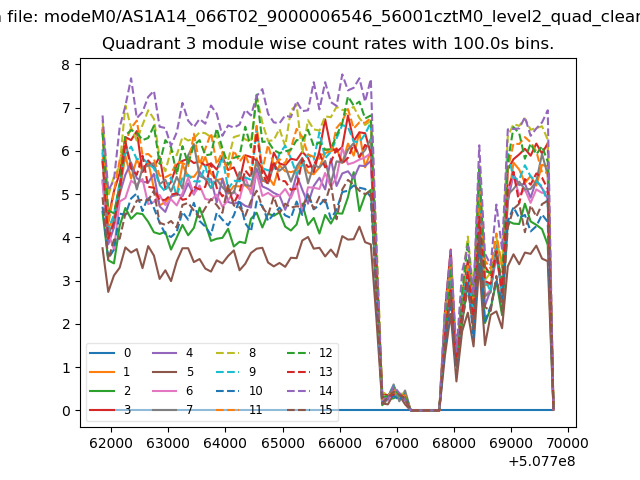
| Module-wise count rates for Quadrant C Data is divided into 100 sec bins |
 |
 |
| Module-wise count rates for Quadrant D Data is divided into 100 sec bins |
 |
 |
| Parameter | Plot |
|---|---|
| CZT HV Monitor | 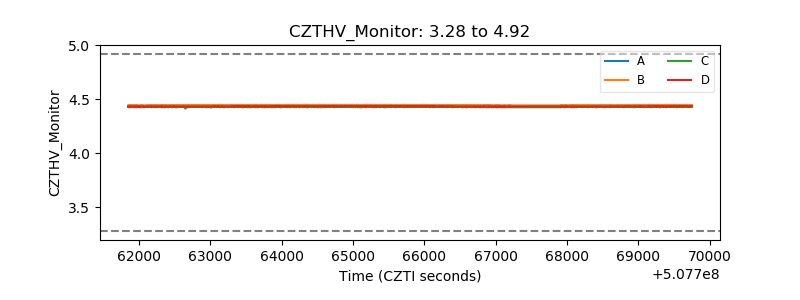 |
| D_VDD | 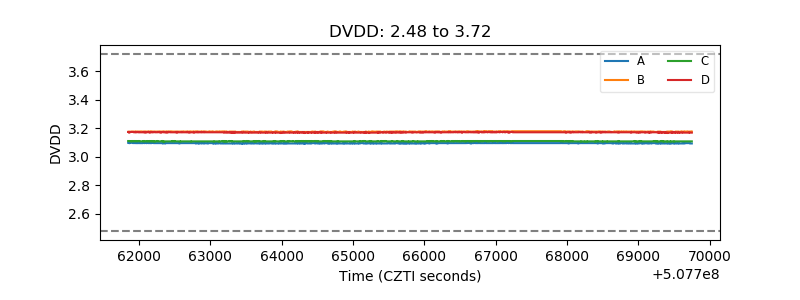 |
| Temperature 1 | 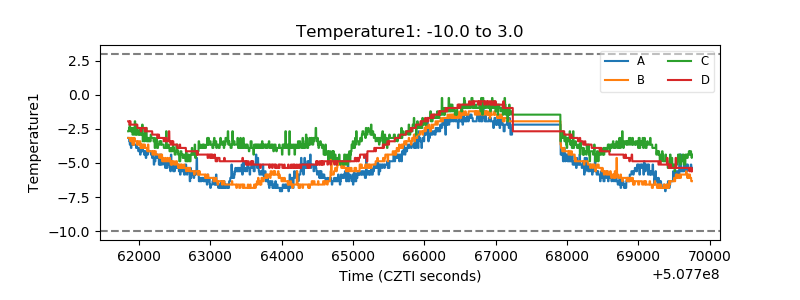 |
| Veto HV Monitor | 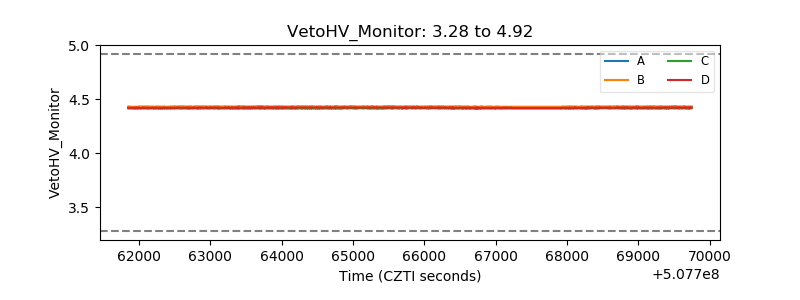 |
| Veto LLD | 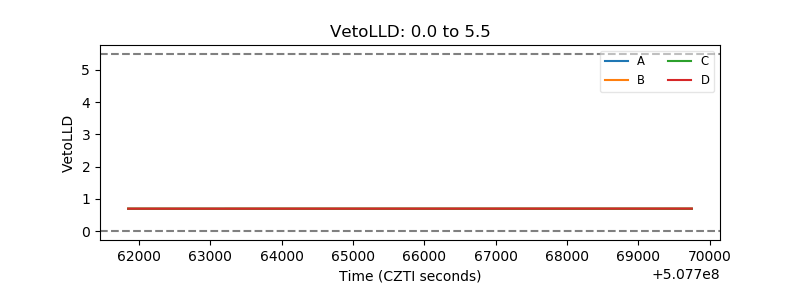 |
| Alpha Counter |  |
| _CPM_Rate | 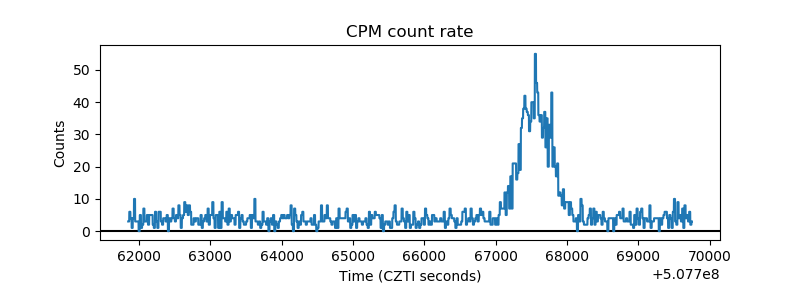 |
| CZT Counter | 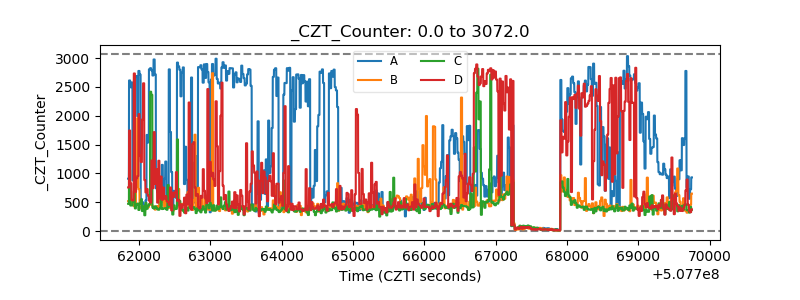 |
| +2.5 Volts monitor | 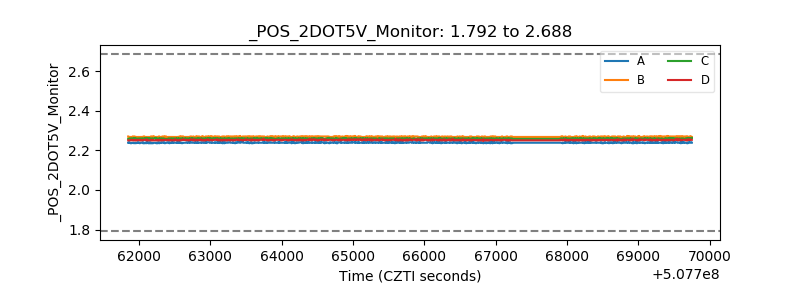 |
| +5 Volts monitor | 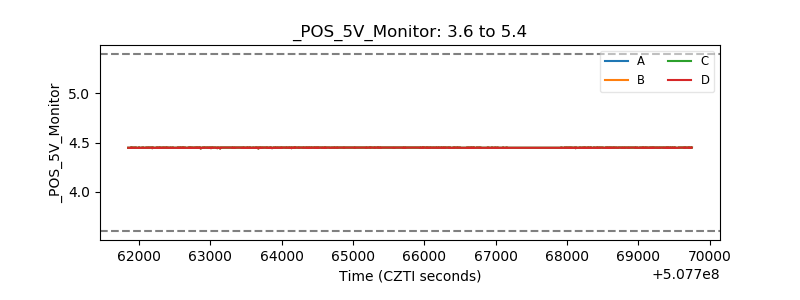 |
| _ROLL_ROT | 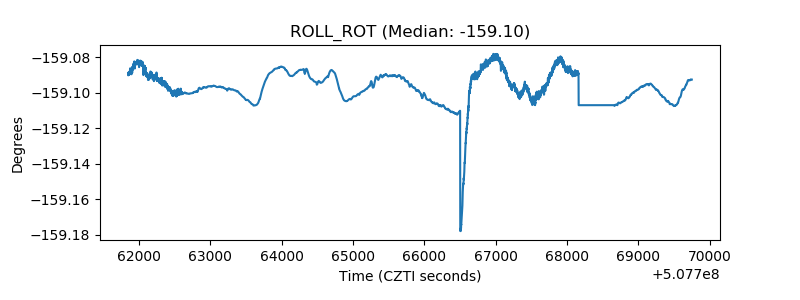 |
| _Roll_DEC | 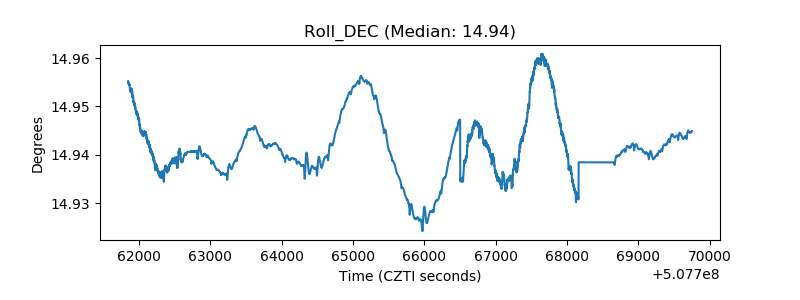 |
| _Roll_RA | 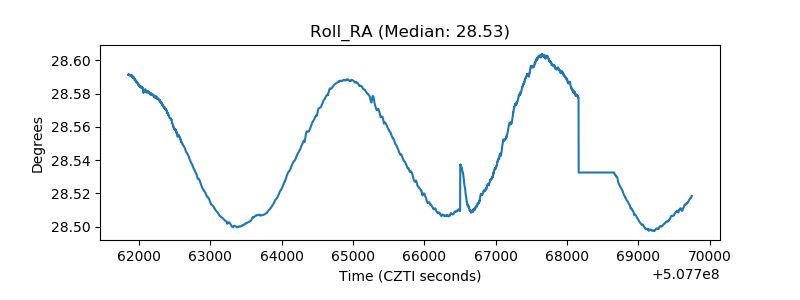 |
| Veto Counter | 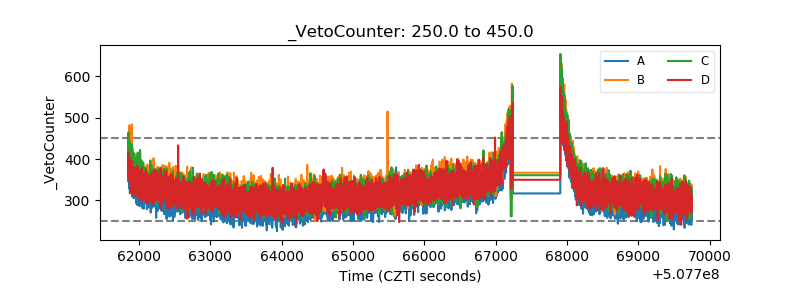 |