| Param | Original file | Final file |
|---|---|---|
| Filename | modeM0/AS1A14_066T02_9000006546_56002cztM0_level2.fits | modeM0/AS1A14_066T02_9000006546_56002cztM0_level2_quad_clean.evt |
| Size (bytes) | 527,112,000 | 98,447,040 |
| Size | 502.7 MB | 93.9 MB |
| Events in quadrant A | 6,737,590 | 597,900 |
| Events in quadrant B | 3,958,183 | 688,289 |
| Events in quadrant C | 3,215,168 | 631,505 |
| Events in quadrant D | 5,048,029 | 566,789 |
| Mode M9 | |||
|---|---|---|---|
| Quadrant | BADHDUFLAG | Total packets | Discarded packets |
| A | 0 | 1 | 0 |
| B | 0 | 1 | 0 |
| C | 0 | 1 | 0 |
| D | 0 | 1 | 0 |
| Mode M0 | |||
|---|---|---|---|
| Quadrant | BADHDUFLAG | Total packets | Discarded packets |
| A | 0 | 25013 | 2 |
| B | 0 | 16815 | 1 |
| C | 0 | 15193 | 1 |
| D | 0 | 20146 | 1 |
| Mode SS | |||
|---|---|---|---|
| Quadrant | BADHDUFLAG | Total packets | Discarded packets |
| A | 0 | 146 | 0 |
| B | 0 | 146 | 0 |
| C | 0 | 146 | 0 |
| D | 0 | 146 | 0 |
| Quadrant | Total seconds | Saturated seconds | Saturation percentage |
|---|---|---|---|
| A | 7122 | 819 | 11.499579% |
| B | 7123 | 267 | 3.748421% |
| C | 7123 | 34 | 0.477327% |
| D | 7123 | 449 | 6.303524% |
Noise dominated data is calculated using 1-second bins in cleaned event files. If a bin has >2000 counts, and if more than 50% of those come from <1% of pixels, then it is considered to be noise-dominated and hence unusable.
| Quadrant | # 1 sec bins | Bins with >0 counts | Bins with >2000 counts | High rate bins dominated by noise | Noise dominated (total time) | Noise dominated (detector-on time) | Marked lightcurve |
|---|---|---|---|---|---|---|---|
| A | 7227 | 7123 | 702 | 702 | 9.71% | 9.86% |  |
| B | 7228 | 7124 | 82 | 82 | 1.13% | 1.15% |  |
| C | 7228 | 7124 | 26 | 26 | 0.36% | 0.36% |  |
| D | 7228 | 7124 | 391 | 391 | 5.41% | 5.49% |  |
Top three noisy pixels from each quadrant. If the there are fewer than three noisy pixels in the level2.evt file, extra rows are filled as -1
| Pixel properties | Quadrant properties | ||||||
|---|---|---|---|---|---|---|---|
| Quadrant | DetID | PixID | Counts | Sigma | Mean | Median | Sigma |
| A | 12 | 115 | 2994641 | 16276.12 | 744 | 725 | 183.9 |
| A | 3 | 14 | 350477 | 1901.39 | 744 | 725 | 183.9 |
| A | 0 | 8 | 326071 | 1768.71 | 744 | 725 | 183.9 |
| B | 2 | 249 | 576338 | 3472.09 | 760 | 732 | 165.8 |
| B | 0 | 199 | 112679 | 675.27 | 760 | 732 | 165.8 |
| B | 0 | 173 | 80232 | 479.55 | 760 | 732 | 165.8 |
| C | 12 | 249 | 120721 | 578.19 | 754 | 748 | 207.5 |
| C | 12 | 252 | 49385 | 234.4 | 754 | 748 | 207.5 |
| C | 14 | 254 | 25173 | 117.71 | 754 | 748 | 207.5 |
| D | 8 | 240 | 457674 | 2206.07 | 728 | 697 | 207.1 |
| D | 2 | 120 | 431374 | 2079.11 | 728 | 697 | 207.1 |
| D | 8 | 129 | 383733 | 1849.12 | 728 | 697 | 207.1 |
Histogram calculated using DETX and DETY for each event in the final _common_clean file
| Quadrant A | 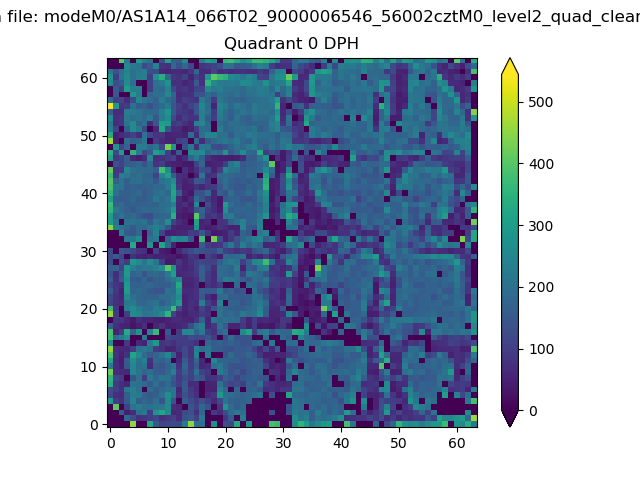 |
 |
Quadrant B |
|---|---|---|---|
| Quadrant D |  |
 |
Quadrant C |
| Plot type | Count rate plots | Images |
|---|---|---|
| Comparison with Poisson distribution Blue bars denote a histogram of data divided into 1 sec bins. Red curve is a Poisson curve with rate = median count rate of data. |
 |
 |
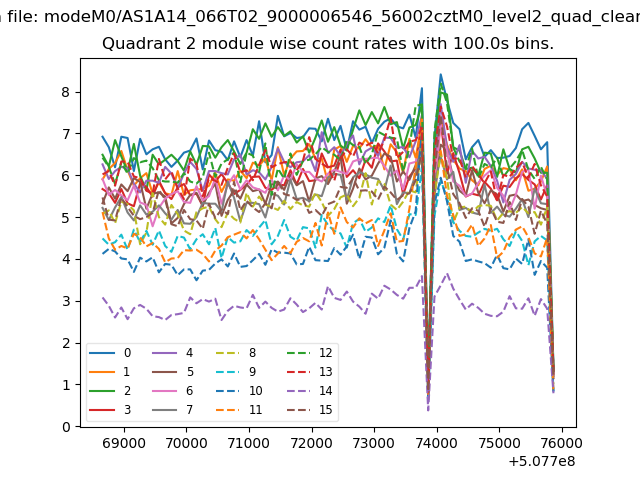
| Quadrant-wise count rates Data is divided into 100 sec bins |
 |
|
| Module-wise count rates for Quadrant A Data is divided into 100 sec bins |
 |
 |
| Module-wise count rates for Quadrant B Data is divided into 100 sec bins |
 |
 |
| Module-wise count rates for Quadrant C Data is divided into 100 sec bins |
 |
 |
| Module-wise count rates for Quadrant D Data is divided into 100 sec bins |
 |
 |
| Parameter | Plot |
|---|---|
| CZT HV Monitor | 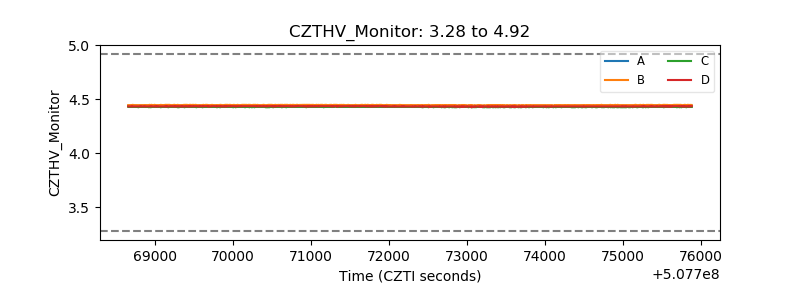 |
| D_VDD | 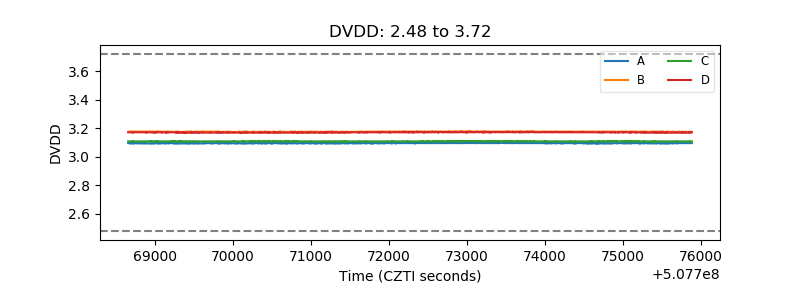 |
| Temperature 1 | 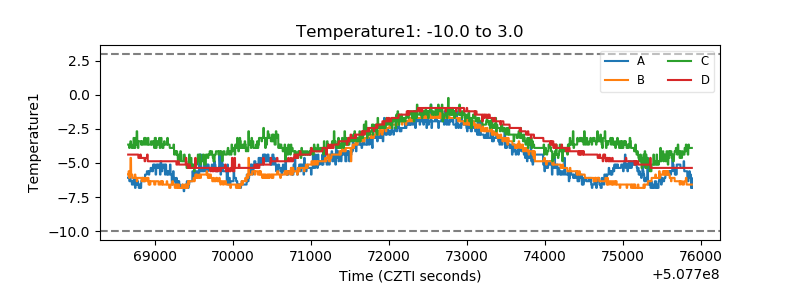 |
| Veto HV Monitor |  |
| Veto LLD |  |
| Alpha Counter |  |
| _CPM_Rate |  |
| CZT Counter | 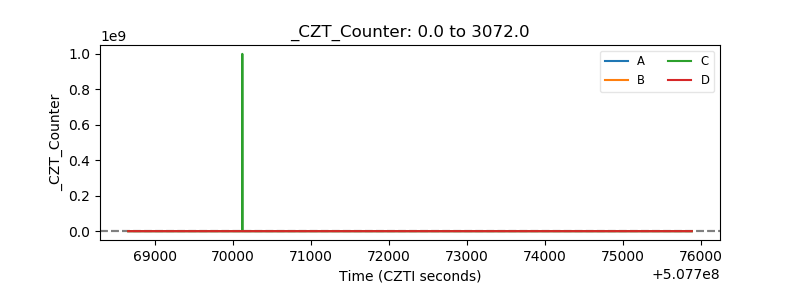 |
| +2.5 Volts monitor |  |
| +5 Volts monitor |  |
| _ROLL_ROT | 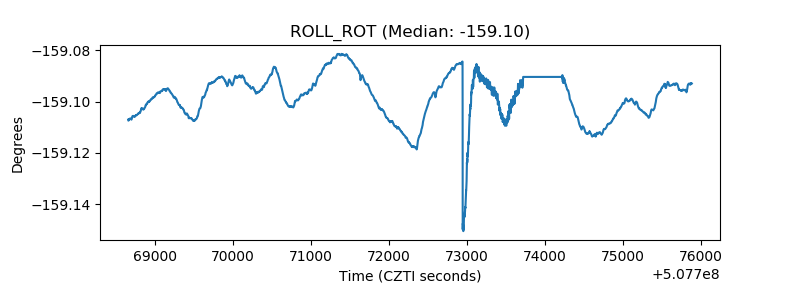 |
| _Roll_DEC |  |
| _Roll_RA |  |
| Veto Counter | 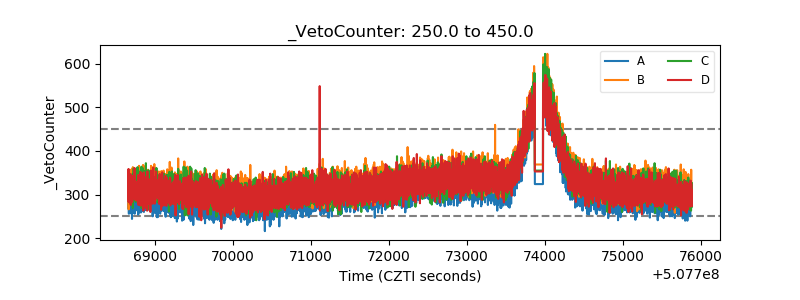 |