| Param | Original file | Final file |
|---|---|---|
| Filename | modeM0/AS1A14_066T02_9000006546_56003cztM0_level2.fits | modeM0/AS1A14_066T02_9000006546_56003cztM0_level2_quad_clean.evt |
| Size (bytes) | 512,020,800 | 110,825,280 |
| Size | 488.3 MB | 105.7 MB |
| Events in quadrant A | 4,981,735 | 699,132 |
| Events in quadrant B | 3,844,949 | 778,124 |
| Events in quadrant C | 3,914,484 | 689,932 |
| Events in quadrant D | 5,601,686 | 641,647 |
| Mode M0 | |||
|---|---|---|---|
| Quadrant | BADHDUFLAG | Total packets | Discarded packets |
| A | 0 | 20546 | 0 |
| B | 0 | 17035 | 0 |
| C | 0 | 17717 | 0 |
| D | 0 | 22095 | 1 |
| Mode SS | |||
|---|---|---|---|
| Quadrant | BADHDUFLAG | Total packets | Discarded packets |
| A | 0 | 158 | 0 |
| B | 0 | 158 | 0 |
| C | 0 | 158 | 0 |
| D | 0 | 158 | 0 |
| Quadrant | Total seconds | Saturated seconds | Saturation percentage |
|---|---|---|---|
| A | 7862 | 356 | 4.528110% |
| B | 7863 | 41 | 0.521429% |
| C | 7863 | 77 | 0.979270% |
| D | 7862 | 262 | 3.332485% |
Noise dominated data is calculated using 1-second bins in cleaned event files. If a bin has >2000 counts, and if more than 50% of those come from <1% of pixels, then it is considered to be noise-dominated and hence unusable.
| Quadrant | # 1 sec bins | Bins with >0 counts | Bins with >2000 counts | High rate bins dominated by noise | Noise dominated (total time) | Noise dominated (detector-on time) | Marked lightcurve |
|---|---|---|---|---|---|---|---|
| A | 7862 | 7862 | 335 | 335 | 4.26% | 4.26% |  |
| B | 7863 | 7863 | 12 | 12 | 0.15% | 0.15% |  |
| C | 7863 | 7863 | 77 | 77 | 0.98% | 0.98% |  |
| D | 7862 | 7862 | 299 | 299 | 3.80% | 3.80% |  |
Top three noisy pixels from each quadrant. If the there are fewer than three noisy pixels in the level2.evt file, extra rows are filled as -1
| Pixel properties | Quadrant properties | ||||||
|---|---|---|---|---|---|---|---|
| Quadrant | DetID | PixID | Counts | Sigma | Mean | Median | Sigma |
| A | 0 | 8 | 878754 | 4341.49 | 823 | 803 | 202.2 |
| A | 12 | 115 | 440346 | 2173.55 | 823 | 803 | 202.2 |
| A | 4 | 249 | 177671 | 874.62 | 823 | 803 | 202.2 |
| B | 0 | 199 | 218098 | 1202.41 | 834 | 803 | 180.7 |
| B | 5 | 185 | 68850 | 376.54 | 834 | 803 | 180.7 |
| B | 0 | 213 | 62606 | 341.99 | 834 | 803 | 180.7 |
| C | 14 | 80 | 321651 | 1429.68 | 817 | 810 | 224.4 |
| C | 9 | 38 | 150833 | 668.51 | 817 | 810 | 224.4 |
| C | 13 | 3 | 104048 | 460.03 | 817 | 810 | 224.4 |
| D | 3 | 176 | 548572 | 2400.02 | 803 | 765 | 228.3 |
| D | 8 | 240 | 500721 | 2190.38 | 803 | 765 | 228.3 |
| D | 2 | 249 | 268432 | 1172.69 | 803 | 765 | 228.3 |
Histogram calculated using DETX and DETY for each event in the final _common_clean file
| Quadrant A | 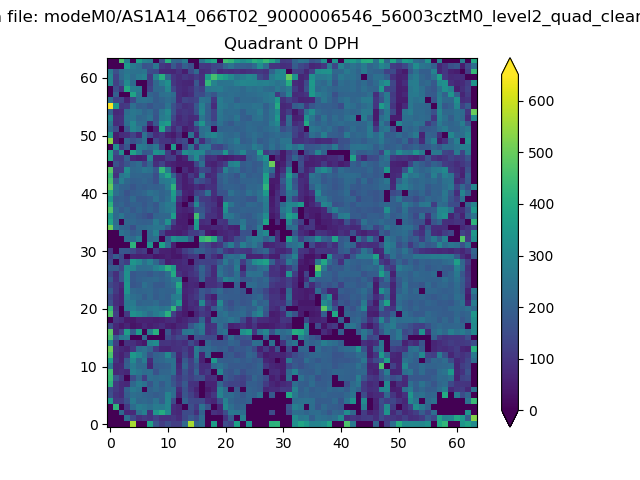 |
 |
Quadrant B |
|---|---|---|---|
| Quadrant D |  |
 |
Quadrant C |
| Plot type | Count rate plots | Images |
|---|---|---|
| Comparison with Poisson distribution Blue bars denote a histogram of data divided into 1 sec bins. Red curve is a Poisson curve with rate = median count rate of data. |
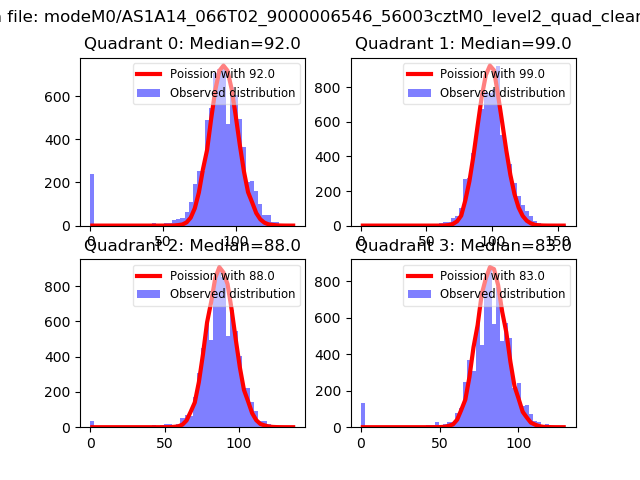 |
 |
| Quadrant-wise count rates Data is divided into 100 sec bins |
 |
|
| Module-wise count rates for Quadrant A Data is divided into 100 sec bins |
 |
 |
| Module-wise count rates for Quadrant B Data is divided into 100 sec bins |
 |
 |
| Module-wise count rates for Quadrant C Data is divided into 100 sec bins |
 |
 |
| Module-wise count rates for Quadrant D Data is divided into 100 sec bins |
 |
 |
| Parameter | Plot |
|---|---|
| CZT HV Monitor | 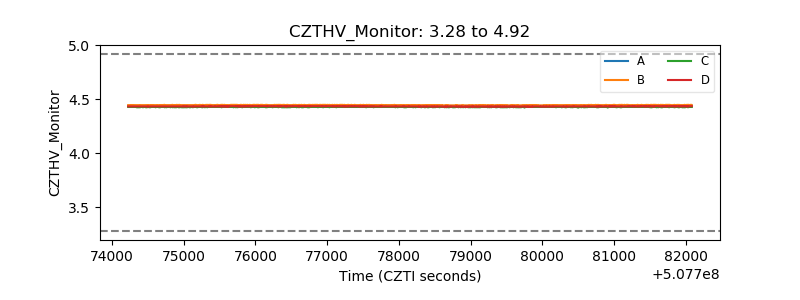 |
| D_VDD |  |
| Temperature 1 | 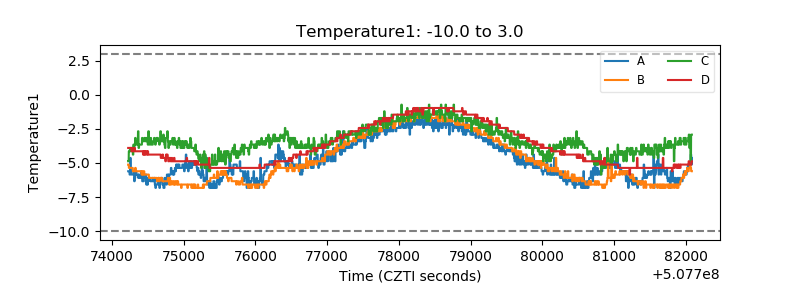 |
| Veto HV Monitor |  |
| Veto LLD |  |
| Alpha Counter |  |
| _CPM_Rate | 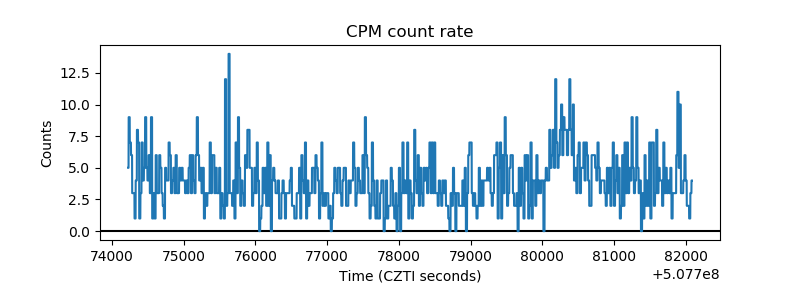 |
| CZT Counter | 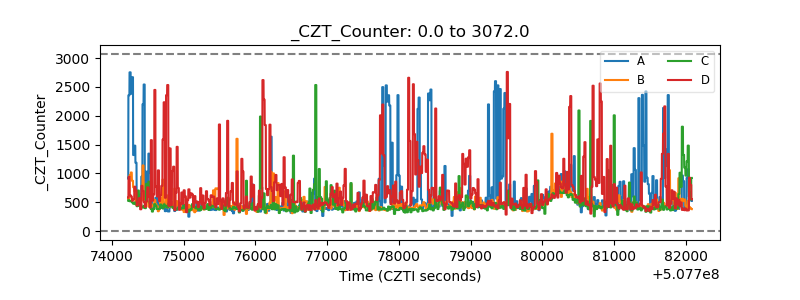 |
| +2.5 Volts monitor |  |
| +5 Volts monitor |  |
| _ROLL_ROT | 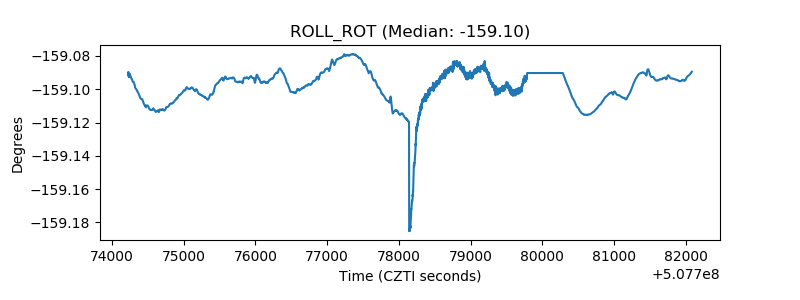 |
| _Roll_DEC | 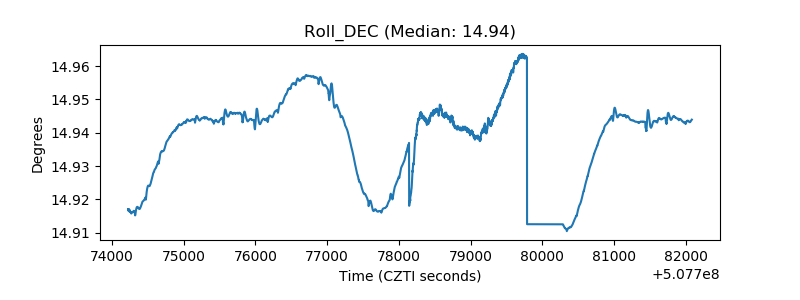 |
| _Roll_RA |  |
| Veto Counter | 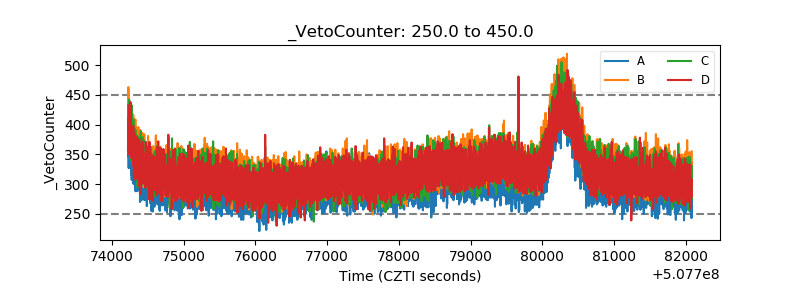 |