| Param | Original file | Final file |
|---|---|---|
| Filename | modeM0/AS1A14_066T02_9000006546_56004cztM0_level2.fits | modeM0/AS1A14_066T02_9000006546_56004cztM0_level2_quad_clean.evt |
| Size (bytes) | 521,930,880 | 111,409,920 |
| Size | 497.8 MB | 106.2 MB |
| Events in quadrant A | 4,866,459 | 718,632 |
| Events in quadrant B | 3,961,146 | 771,760 |
| Events in quadrant C | 4,305,248 | 698,817 |
| Events in quadrant D | 5,572,726 | 633,951 |
| Mode M0 | |||
|---|---|---|---|
| Quadrant | BADHDUFLAG | Total packets | Discarded packets |
| A | 0 | 20028 | 0 |
| B | 0 | 17569 | 2 |
| C | 0 | 18734 | 0 |
| D | 0 | 22197 | 0 |
| Mode SS | |||
|---|---|---|---|
| Quadrant | BADHDUFLAG | Total packets | Discarded packets |
| A | 0 | 158 | 0 |
| B | 0 | 158 | 0 |
| C | 0 | 158 | 0 |
| D | 0 | 158 | 0 |
| Quadrant | Total seconds | Saturated seconds | Saturation percentage |
|---|---|---|---|
| A | 7912 | 253 | 3.197674% |
| B | 7912 | 207 | 2.616279% |
| C | 7912 | 92 | 1.162791% |
| D | 7912 | 467 | 5.902427% |
Noise dominated data is calculated using 1-second bins in cleaned event files. If a bin has >2000 counts, and if more than 50% of those come from <1% of pixels, then it is considered to be noise-dominated and hence unusable.
| Quadrant | # 1 sec bins | Bins with >0 counts | Bins with >2000 counts | High rate bins dominated by noise | Noise dominated (total time) | Noise dominated (detector-on time) | Marked lightcurve |
|---|---|---|---|---|---|---|---|
| A | 7912 | 7912 | 225 | 225 | 2.84% | 2.84% |  |
| B | 7912 | 7912 | 81 | 81 | 1.02% | 1.02% |  |
| C | 7912 | 7912 | 120 | 120 | 1.52% | 1.52% |  |
| D | 7912 | 7912 | 374 | 374 | 4.73% | 4.73% |  |
Top three noisy pixels from each quadrant. If the there are fewer than three noisy pixels in the level2.evt file, extra rows are filled as -1
| Pixel properties | Quadrant properties | ||||||
|---|---|---|---|---|---|---|---|
| Quadrant | DetID | PixID | Counts | Sigma | Mean | Median | Sigma |
| A | 0 | 8 | 735965 | 3470.54 | 855 | 833 | 211.8 |
| A | 4 | 249 | 363057 | 1710.05 | 855 | 833 | 211.8 |
| A | 3 | 14 | 169857 | 797.96 | 855 | 833 | 211.8 |
| B | 2 | 249 | 256638 | 1393.36 | 851 | 819 | 183.6 |
| B | 0 | 199 | 104367 | 563.99 | 851 | 819 | 183.6 |
| B | 0 | 213 | 69192 | 372.4 | 851 | 819 | 183.6 |
| C | 13 | 3 | 496666 | 2152.5 | 841 | 833 | 230.4 |
| C | 9 | 38 | 176187 | 761.24 | 841 | 833 | 230.4 |
| C | 15 | 199 | 124422 | 536.52 | 841 | 833 | 230.4 |
| D | 8 | 240 | 604993 | 2629.77 | 814 | 778 | 229.8 |
| D | 8 | 245 | 465792 | 2023.91 | 814 | 778 | 229.8 |
| D | 2 | 120 | 433143 | 1881.81 | 814 | 778 | 229.8 |
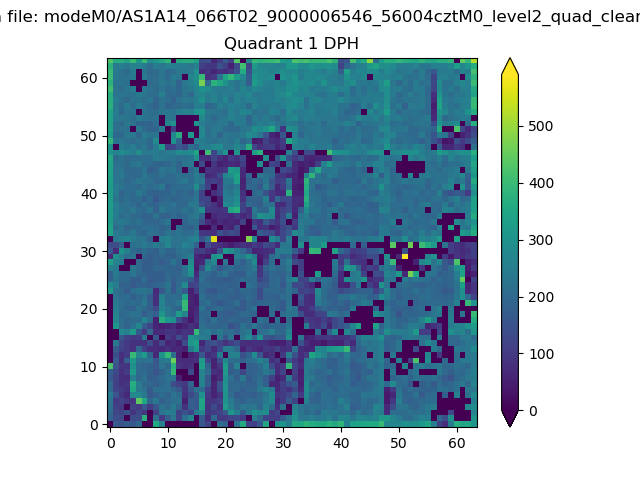
Histogram calculated using DETX and DETY for each event in the final _common_clean file
| Quadrant A |  |
 |
Quadrant B |
|---|---|---|---|
| Quadrant D |  |
 |
Quadrant C |
| Plot type | Count rate plots | Images |
|---|---|---|
| Comparison with Poisson distribution Blue bars denote a histogram of data divided into 1 sec bins. Red curve is a Poisson curve with rate = median count rate of data. |
 |
 |
| Quadrant-wise count rates Data is divided into 100 sec bins |
 |
|
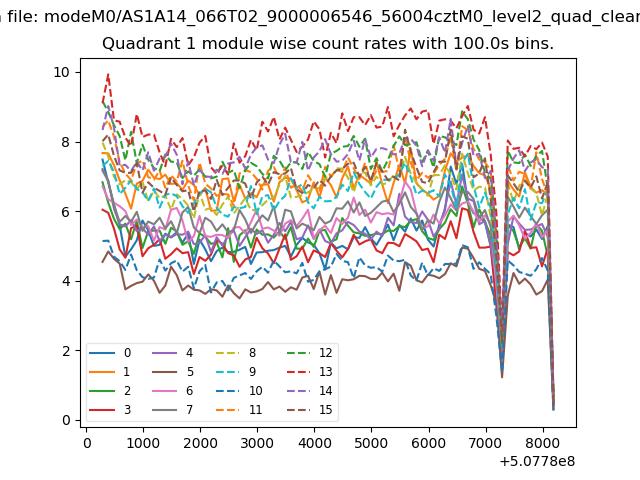
| Module-wise count rates for Quadrant A Data is divided into 100 sec bins |
 |
 |
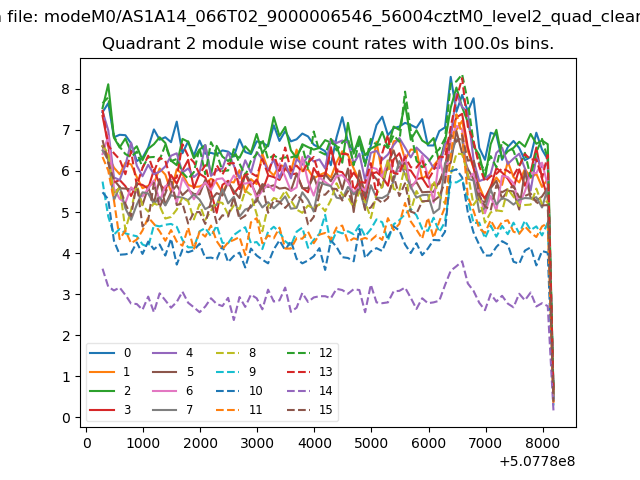
| Module-wise count rates for Quadrant B Data is divided into 100 sec bins |
 |
 |
| Module-wise count rates for Quadrant C Data is divided into 100 sec bins |
 |
 |
| Module-wise count rates for Quadrant D Data is divided into 100 sec bins |
 |
 |
| Parameter | Plot |
|---|---|
| CZT HV Monitor | 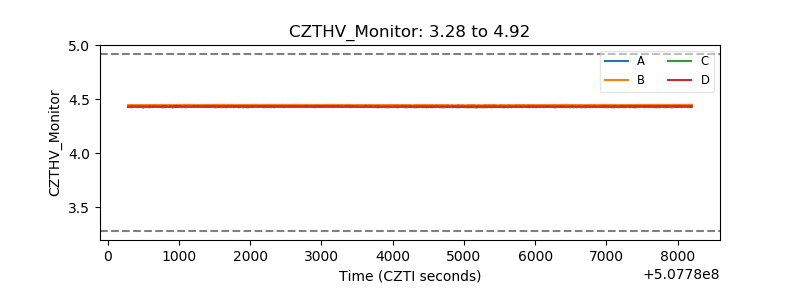 |
| D_VDD |  |
| Temperature 1 | 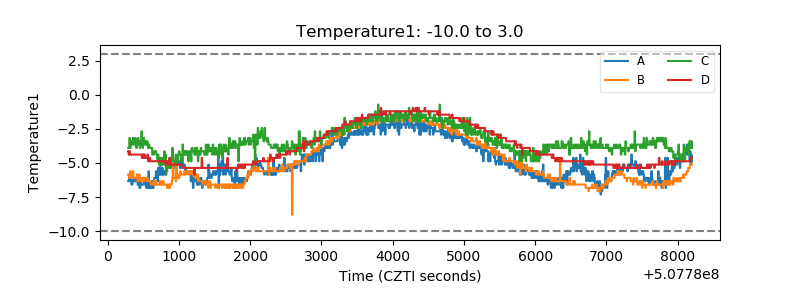 |
| Veto HV Monitor |  |
| Veto LLD | 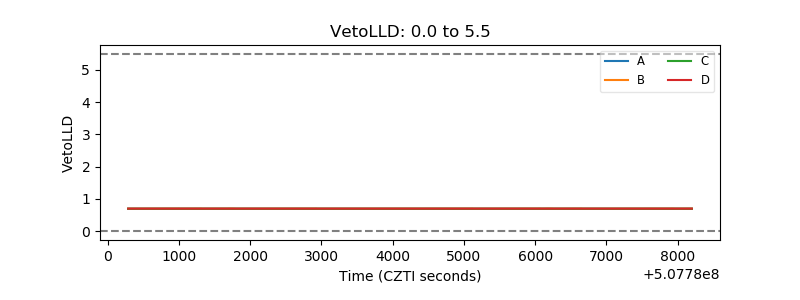 |
| Alpha Counter |  |
| _CPM_Rate |  |
| CZT Counter | 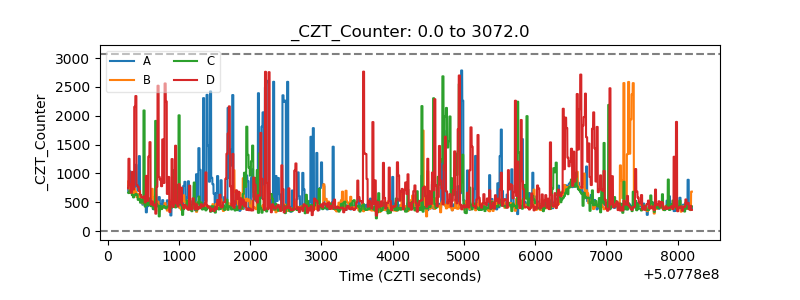 |
| +2.5 Volts monitor |  |
| +5 Volts monitor |  |
| _ROLL_ROT | 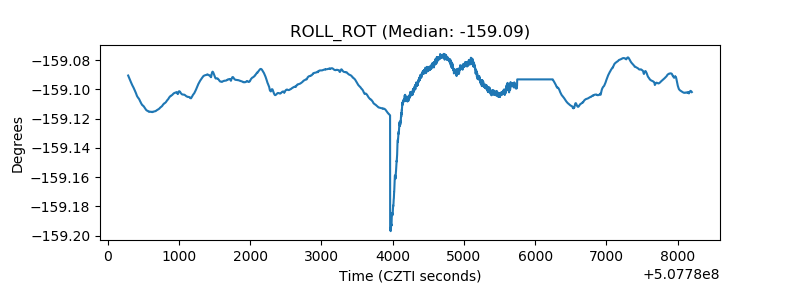 |
| _Roll_DEC |  |
| _Roll_RA |  |
| Veto Counter | 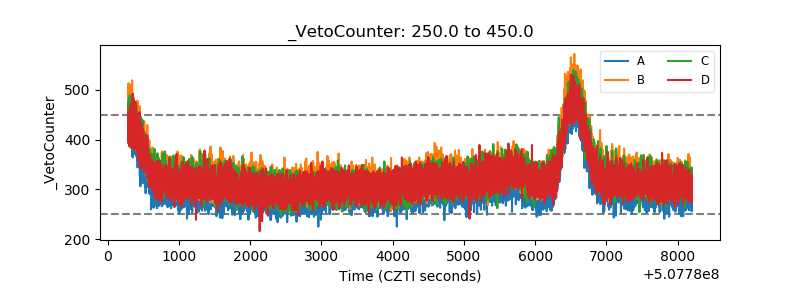 |