| Param | Original file | Final file |
|---|---|---|
| Filename | modeM0/AS1A14_066T02_9000006546_56007cztM0_level2.fits | modeM0/AS1A14_066T02_9000006546_56007cztM0_level2_quad_clean.evt |
| Size (bytes) | 1,396,699,200 | 264,611,520 |
| Size | 1.3 GB | 252.4 MB |
| Events in quadrant A | 12,539,059 | 1,737,963 |
| Events in quadrant B | 9,789,724 | 1,843,926 |
| Events in quadrant C | 9,887,009 | 1,689,218 |
| Events in quadrant D | 17,967,951 | 1,389,413 |
| Mode M9 | |||
|---|---|---|---|
| Quadrant | BADHDUFLAG | Total packets | Discarded packets |
| A | 0 | 12 | 0 |
| B | 0 | 12 | 0 |
| C | 0 | 12 | 0 |
| D | 0 | 12 | 0 |
| Mode M0 | |||
|---|---|---|---|
| Quadrant | BADHDUFLAG | Total packets | Discarded packets |
| A | 0 | 50838 | 3 |
| B | 0 | 43195 | 3 |
| C | 0 | 44420 | 3 |
| D | 0 | 67071 | 3 |
| Mode SS | |||
|---|---|---|---|
| Quadrant | BADHDUFLAG | Total packets | Discarded packets |
| A | 0 | 396 | 0 |
| B | 0 | 396 | 0 |
| C | 0 | 396 | 0 |
| D | 0 | 396 | 0 |
| Quadrant | Total seconds | Saturated seconds | Saturation percentage |
|---|---|---|---|
| A | 19606 | 888 | 4.529226% |
| B | 19606 | 739 | 3.769254% |
| C | 19606 | 580 | 2.958278% |
| D | 19606 | 2749 | 14.021218% |
Noise dominated data is calculated using 1-second bins in cleaned event files. If a bin has >2000 counts, and if more than 50% of those come from <1% of pixels, then it is considered to be noise-dominated and hence unusable.
| Quadrant | # 1 sec bins | Bins with >0 counts | Bins with >2000 counts | High rate bins dominated by noise | Noise dominated (total time) | Noise dominated (detector-on time) | Marked lightcurve |
|---|---|---|---|---|---|---|---|
| A | 20816 | 19606 | 402 | 402 | 1.93% | 2.05% | 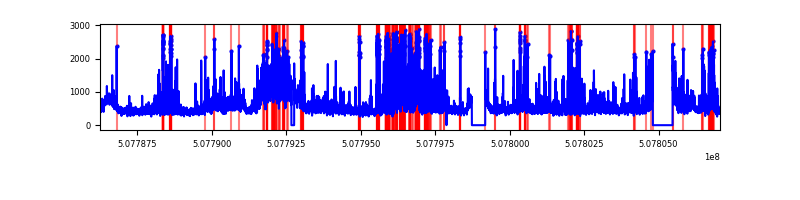 |
| B | 20816 | 19606 | 127 | 127 | 0.61% | 0.65% | 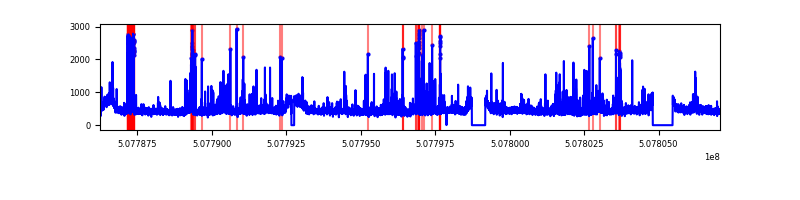 |
| C | 20816 | 19606 | 343 | 343 | 1.65% | 1.75% | 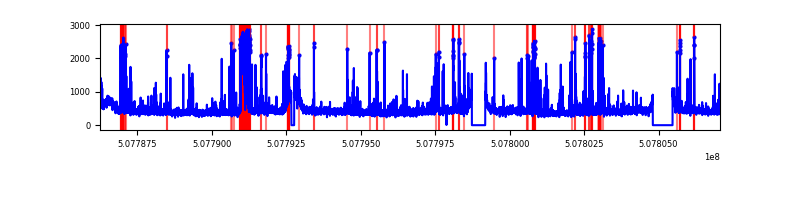 |
| D | 20816 | 19606 | 2259 | 2259 | 10.85% | 11.52% | 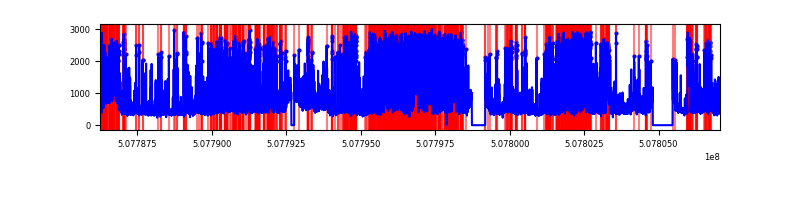 |
Top three noisy pixels from each quadrant. If the there are fewer than three noisy pixels in the level2.evt file, extra rows are filled as -1
| Pixel properties | Quadrant properties | ||||||
|---|---|---|---|---|---|---|---|
| Quadrant | DetID | PixID | Counts | Sigma | Mean | Median | Sigma |
| A | 3 | 14 | 1256232 | 2396.41 | 2131 | 2073 | 523.3 |
| A | 4 | 249 | 1198551 | 2286.19 | 2131 | 2073 | 523.3 |
| A | 0 | 8 | 840550 | 1602.14 | 2131 | 2073 | 523.3 |
| B | 2 | 249 | 378974 | 832.56 | 2114 | 2029 | 452.8 |
| B | 0 | 213 | 213299 | 466.63 | 2114 | 2029 | 452.8 |
| B | 0 | 199 | 200216 | 437.74 | 2114 | 2029 | 452.8 |
| C | 15 | 199 | 772333 | 1351.67 | 2082 | 2063 | 569.9 |
| C | 13 | 3 | 461133 | 805.57 | 2082 | 2063 | 569.9 |
| C | 2 | 12 | 127351 | 219.85 | 2082 | 2063 | 569.9 |
| D | 8 | 129 | 4305416 | 7788.93 | 1964 | 1878 | 552.5 |
| D | 8 | 240 | 2109252 | 3814.12 | 1964 | 1878 | 552.5 |
| D | 11 | 129 | 1087039 | 1964.02 | 1964 | 1878 | 552.5 |
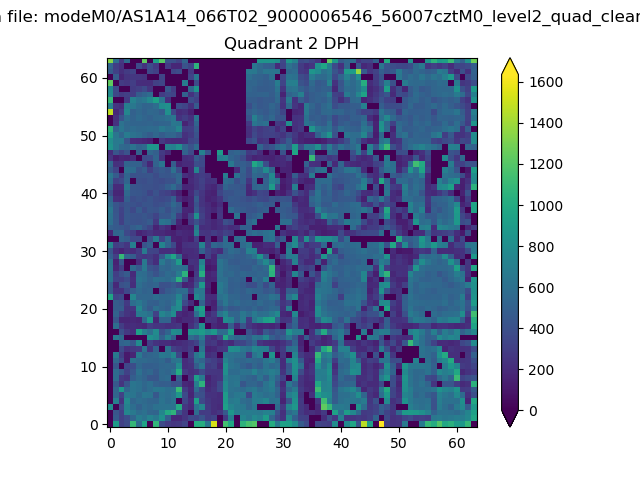
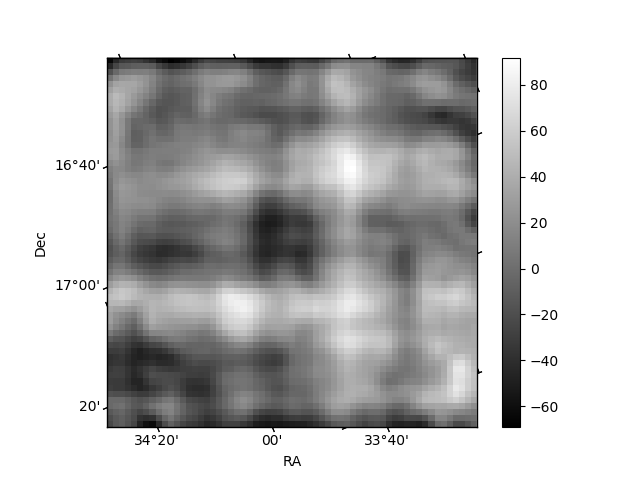
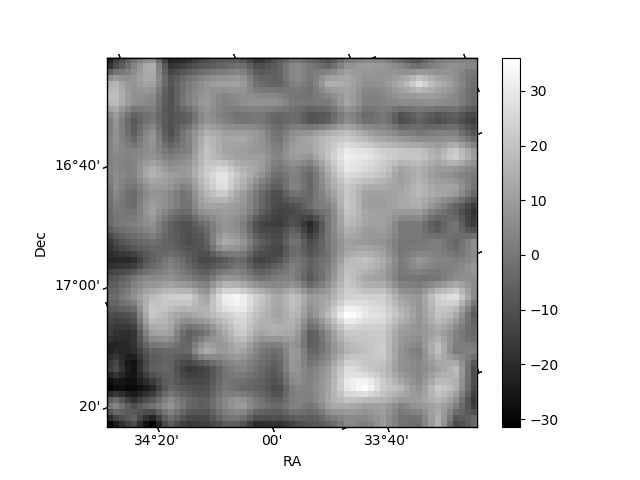
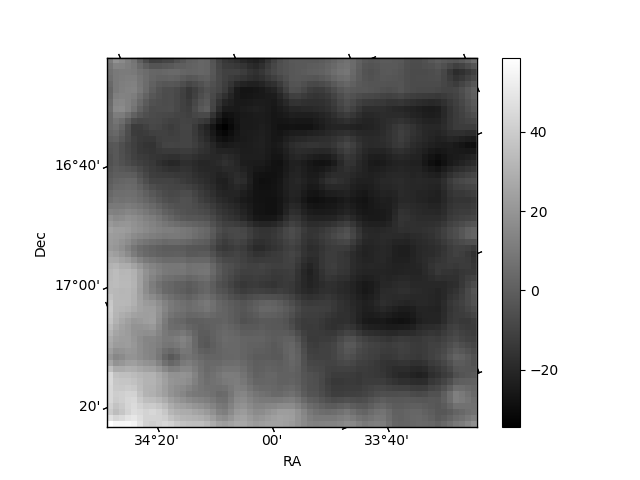
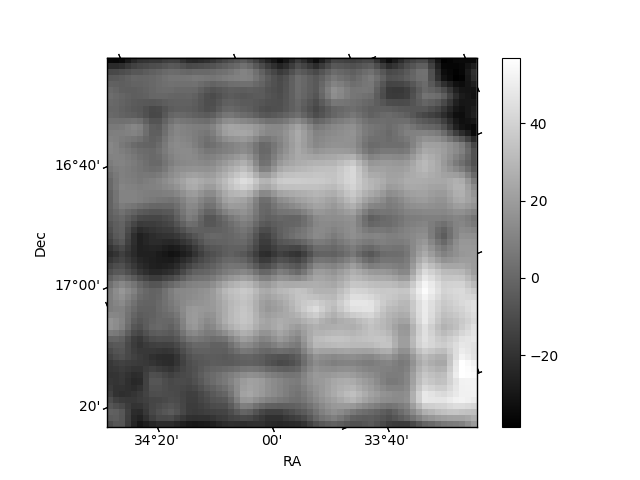
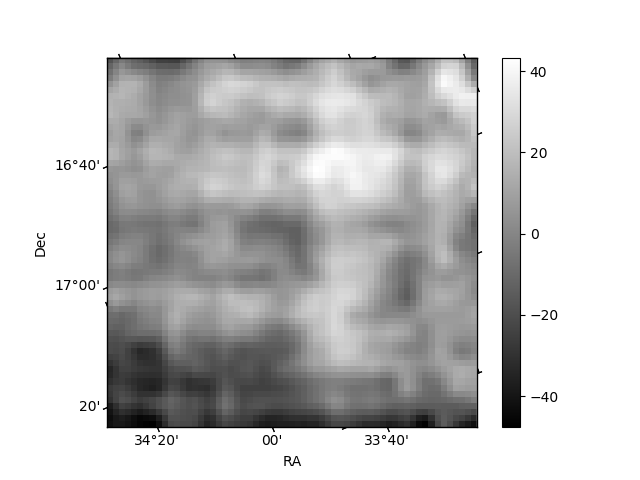
Histogram calculated using DETX and DETY for each event in the final _common_clean file
| Quadrant A | 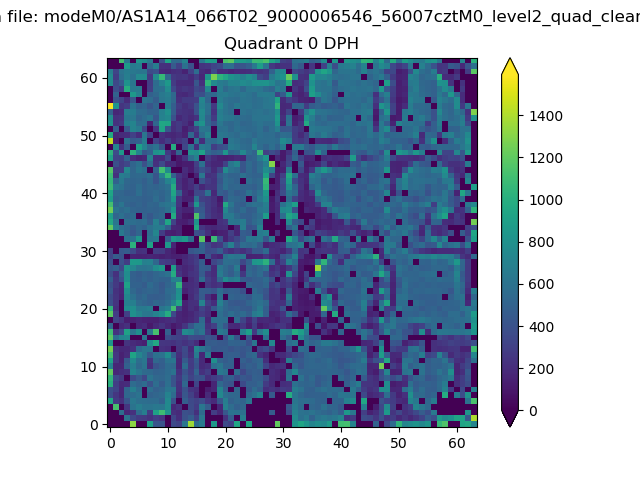 |
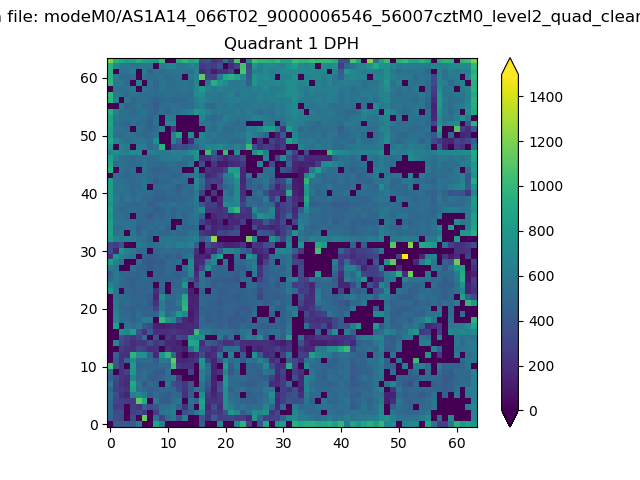 |
Quadrant B |
|---|---|---|---|
| Quadrant D | 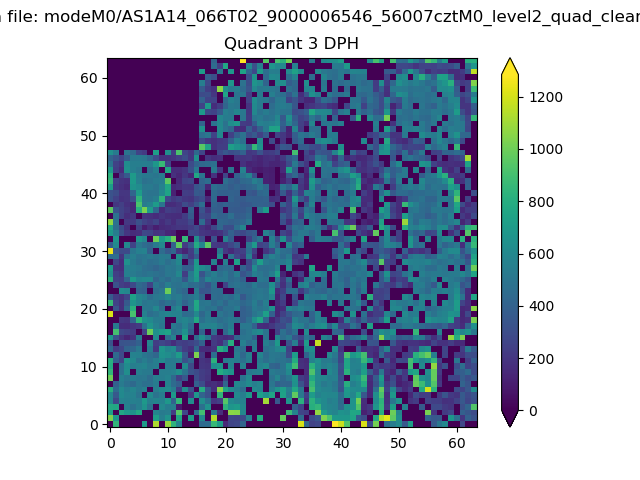 |
 |
Quadrant C |
| Plot type | Count rate plots | Images |
|---|---|---|
| Comparison with Poisson distribution Blue bars denote a histogram of data divided into 1 sec bins. Red curve is a Poisson curve with rate = median count rate of data. |
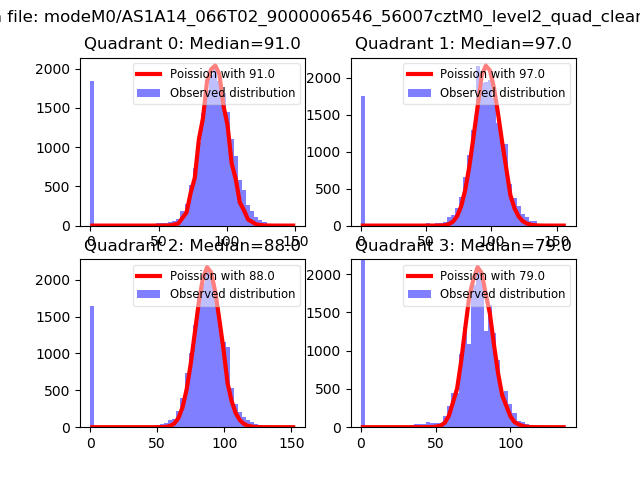 |
 |
| Quadrant-wise count rates Data is divided into 100 sec bins |
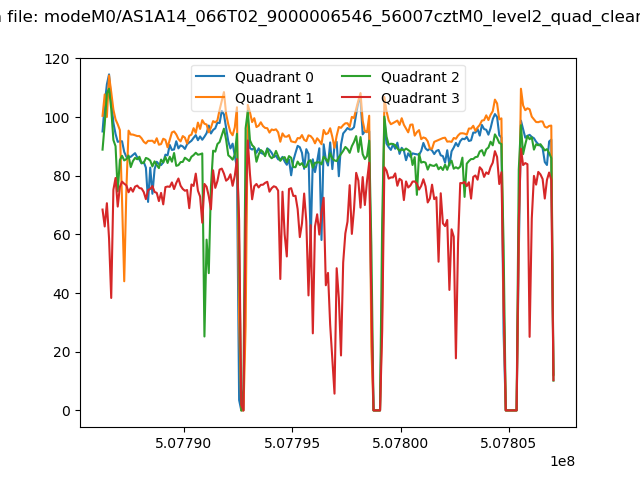 |
|
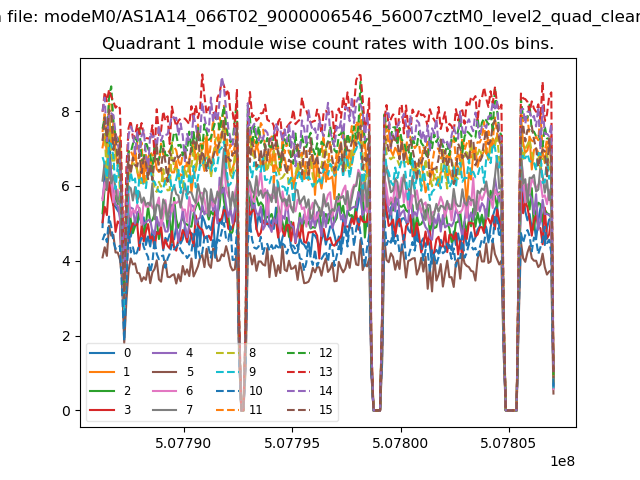
| Module-wise count rates for Quadrant A Data is divided into 100 sec bins |
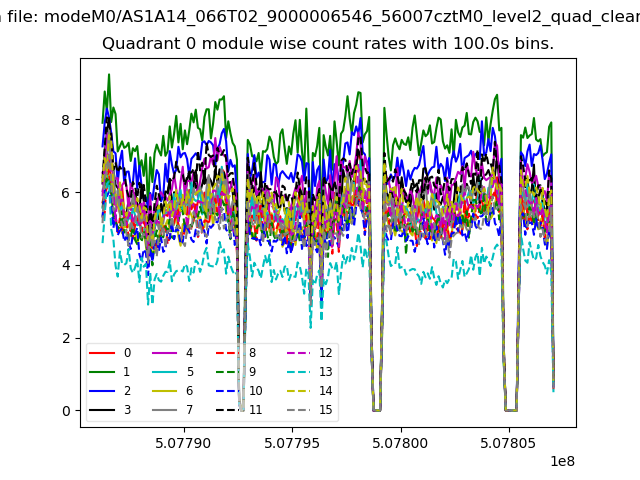 |
 |
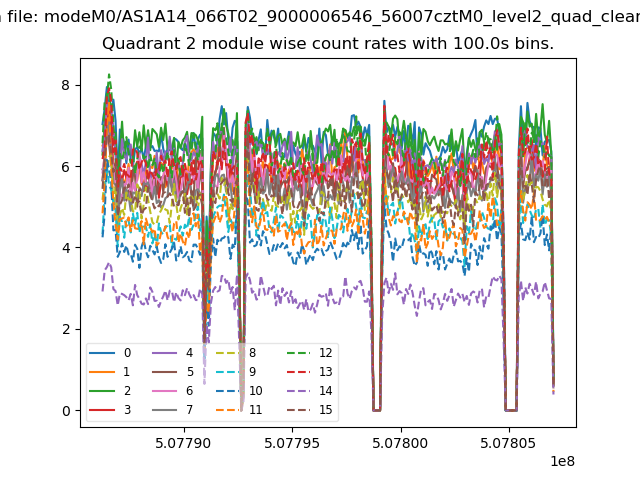
| Module-wise count rates for Quadrant B Data is divided into 100 sec bins |
 |
 |
| Module-wise count rates for Quadrant C Data is divided into 100 sec bins |
 |
 |
| Module-wise count rates for Quadrant D Data is divided into 100 sec bins |
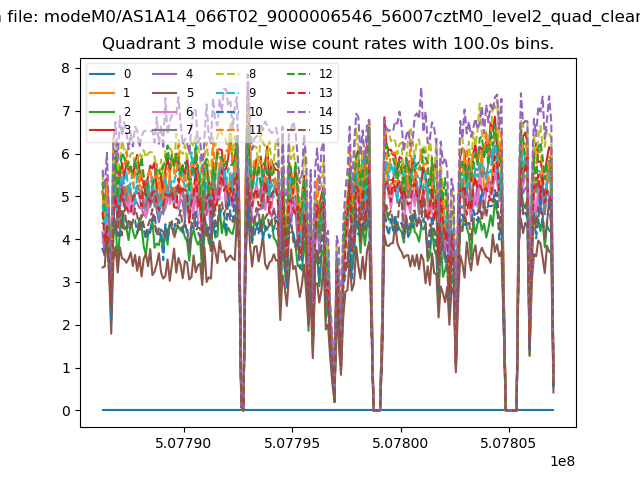 |
 |
| Parameter | Plot |
|---|---|
| CZT HV Monitor | 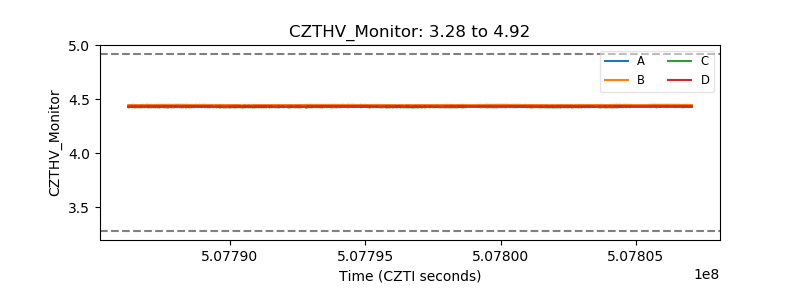 |
| D_VDD | 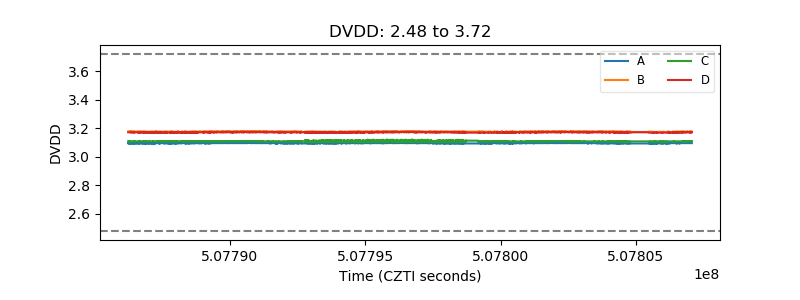 |
| Temperature 1 | 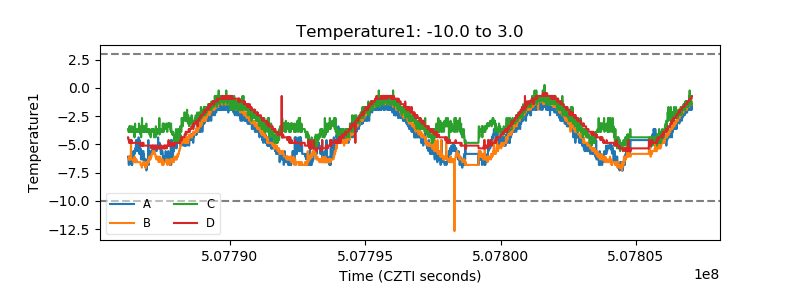 |
| Veto HV Monitor | 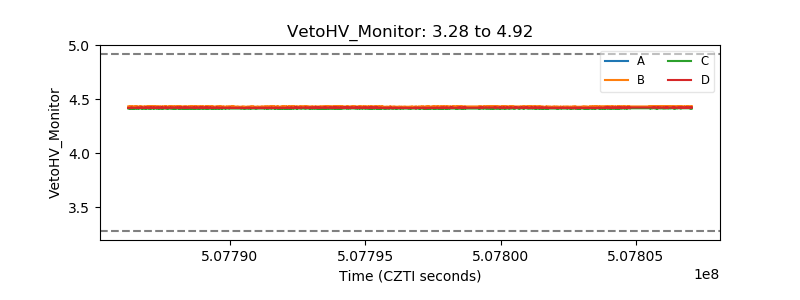 |
| Veto LLD | 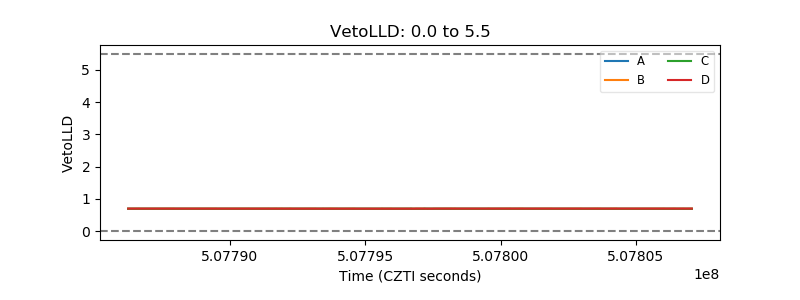 |
| Alpha Counter | 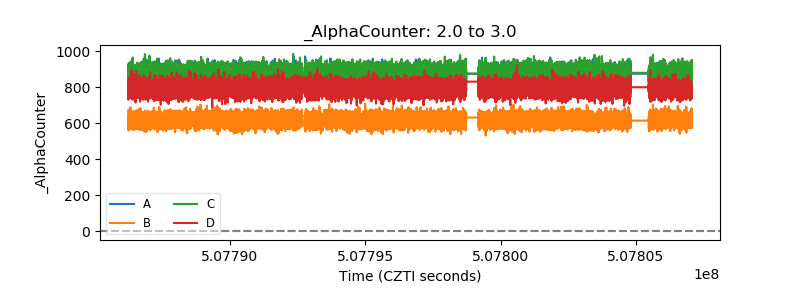 |
| _CPM_Rate | 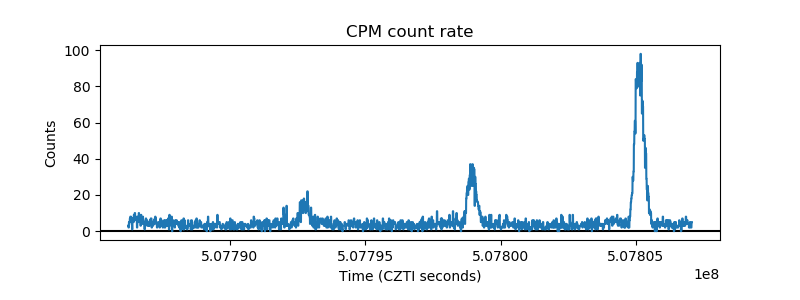 |
| CZT Counter | 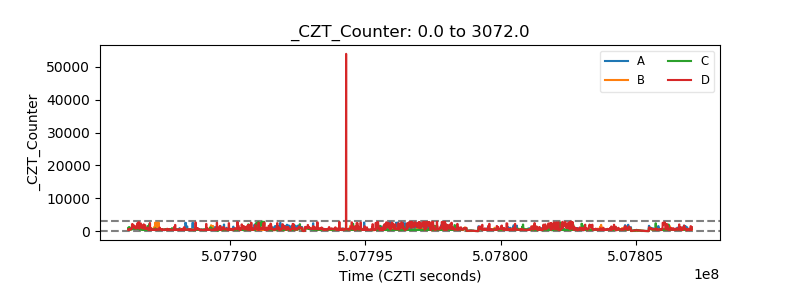 |
| +2.5 Volts monitor | 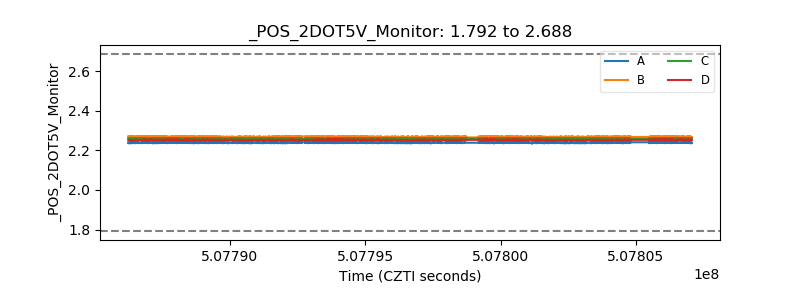 |
| +5 Volts monitor | 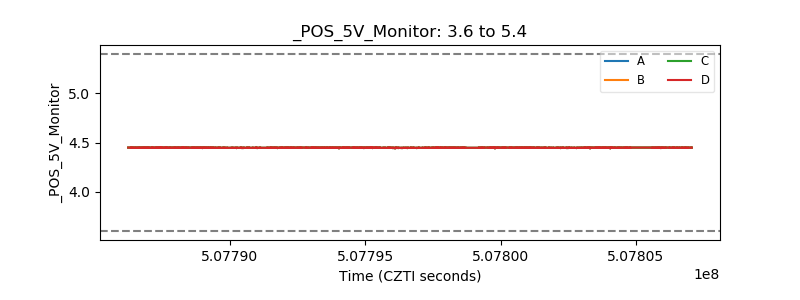 |
| _ROLL_ROT | 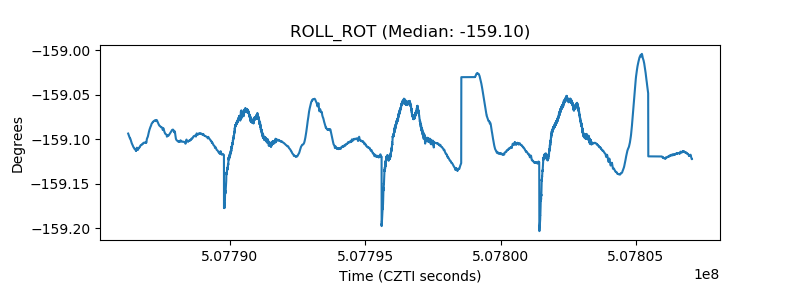 |
| _Roll_DEC | 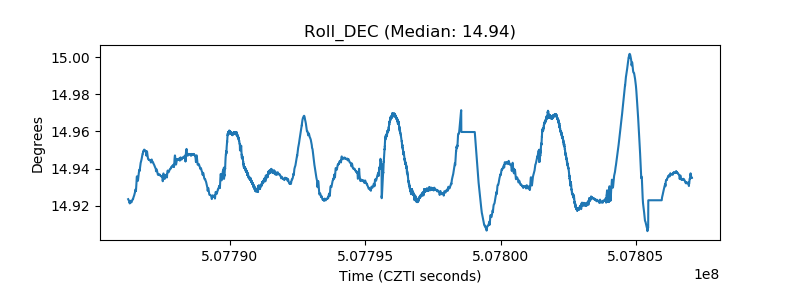 |
| _Roll_RA | 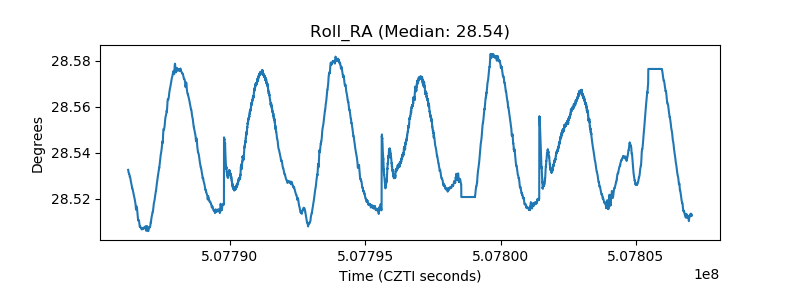 |
| Veto Counter | 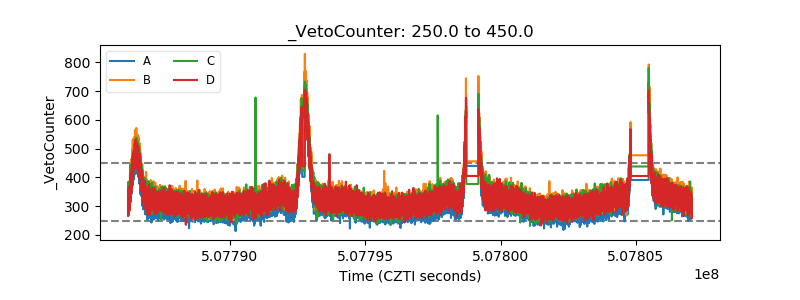 |