| Param | Original file | Final file |
|---|---|---|
| Filename | modeM0/AS1A14_066T02_9000006546_56016cztM0_level2.fits | modeM0/AS1A14_066T02_9000006546_56016cztM0_level2_quad_clean.evt |
| Size (bytes) | 652,104,000 | 102,072,960 |
| Size | 621.9 MB | 97.3 MB |
| Events in quadrant A | 9,404,053 | 558,631 |
| Events in quadrant B | 4,114,661 | 736,605 |
| Events in quadrant C | 4,163,777 | 656,477 |
| Events in quadrant D | 5,872,276 | 614,646 |
| Mode M9 | |||
|---|---|---|---|
| Quadrant | BADHDUFLAG | Total packets | Discarded packets |
| A | 0 | 5 | 0 |
| B | 0 | 6 | 0 |
| C | 0 | 6 | 0 |
| D | 0 | 6 | 0 |
| Mode M0 | |||
|---|---|---|---|
| Quadrant | BADHDUFLAG | Total packets | Discarded packets |
| A | 0 | 33264 | 7 |
| B | 0 | 17591 | 2 |
| C | 0 | 18245 | 2 |
| D | 0 | 22675 | 2 |
| Mode SS | |||
|---|---|---|---|
| Quadrant | BADHDUFLAG | Total packets | Discarded packets |
| A | 0 | 152 | 0 |
| B | 0 | 152 | 0 |
| C | 0 | 152 | 0 |
| D | 0 | 152 | 0 |
| Quadrant | Total seconds | Saturated seconds | Saturation percentage |
|---|---|---|---|
| A | 7534 | 1815 | 24.090788% |
| B | 7534 | 248 | 3.291744% |
| C | 7534 | 219 | 2.906822% |
| D | 7534 | 359 | 4.765065% |
Noise dominated data is calculated using 1-second bins in cleaned event files. If a bin has >2000 counts, and if more than 50% of those come from <1% of pixels, then it is considered to be noise-dominated and hence unusable.
| Quadrant | # 1 sec bins | Bins with >0 counts | Bins with >2000 counts | High rate bins dominated by noise | Noise dominated (total time) | Noise dominated (detector-on time) | Marked lightcurve |
|---|---|---|---|---|---|---|---|
| A | 7899 | 7536 | 1722 | 1722 | 21.80% | 22.85% | 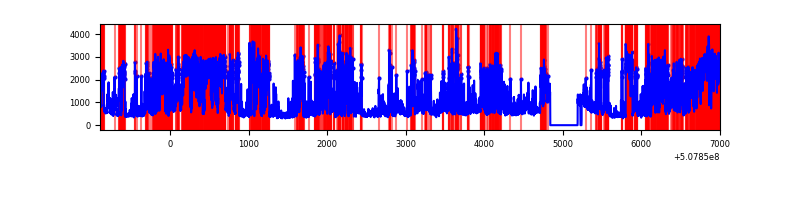 |
| B | 7899 | 7536 | 76 | 76 | 0.96% | 1.01% | 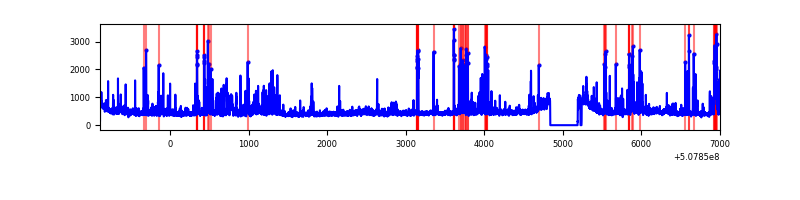 |
| C | 7899 | 7536 | 154 | 154 | 1.95% | 2.04% | 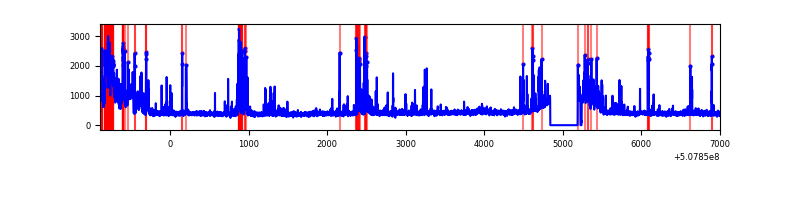 |
| D | 7899 | 7536 | 299 | 299 | 3.79% | 3.97% | 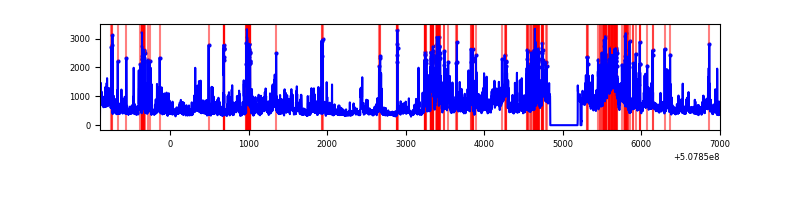 |
Top three noisy pixels from each quadrant. If the there are fewer than three noisy pixels in the level2.evt file, extra rows are filled as -1
| Pixel properties | Quadrant properties | ||||||
|---|---|---|---|---|---|---|---|
| Quadrant | DetID | PixID | Counts | Sigma | Mean | Median | Sigma |
| A | 12 | 115 | 4714987 | 25660.71 | 744 | 726 | 183.7 |
| A | 0 | 8 | 1033832 | 5623.41 | 744 | 726 | 183.7 |
| A | 4 | 249 | 307060 | 1667.44 | 744 | 726 | 183.7 |
| B | 5 | 185 | 216177 | 1224.5 | 806 | 775 | 175.9 |
| B | 4 | 171 | 181325 | 1026.37 | 806 | 775 | 175.9 |
| B | 10 | 247 | 147033 | 831.43 | 806 | 775 | 175.9 |
| C | 13 | 3 | 521096 | 2403.92 | 787 | 784 | 216.4 |
| C | 15 | 199 | 342065 | 1576.77 | 787 | 784 | 216.4 |
| C | 14 | 80 | 92124 | 422.0 | 787 | 784 | 216.4 |
| D | 11 | 129 | 2006842 | 9050.97 | 778 | 744 | 221.6 |
| D | 2 | 249 | 230512 | 1036.65 | 778 | 744 | 221.6 |
| D | 6 | 239 | 154709 | 694.65 | 778 | 744 | 221.6 |
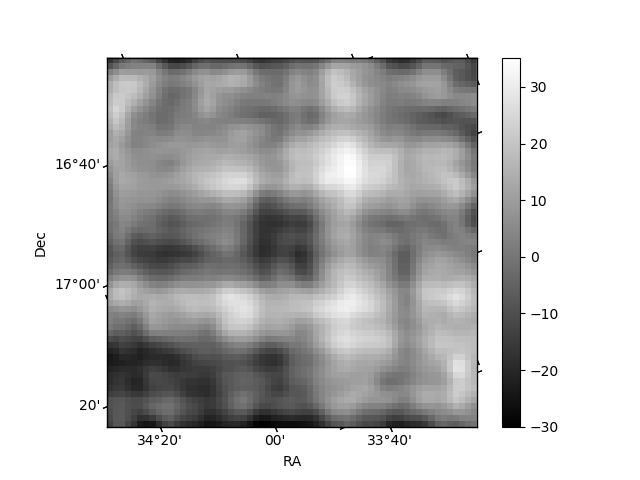
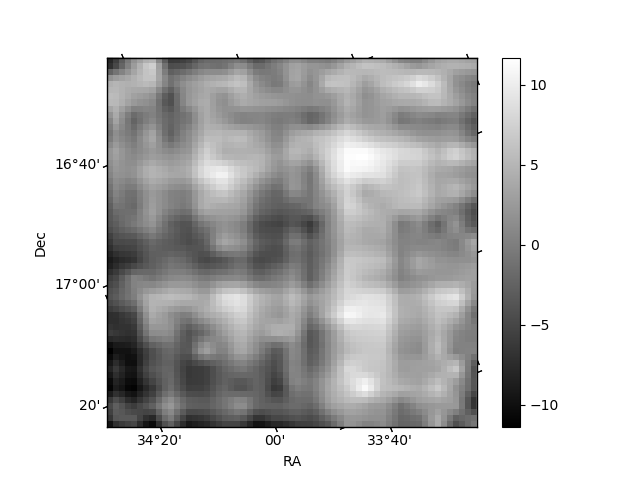
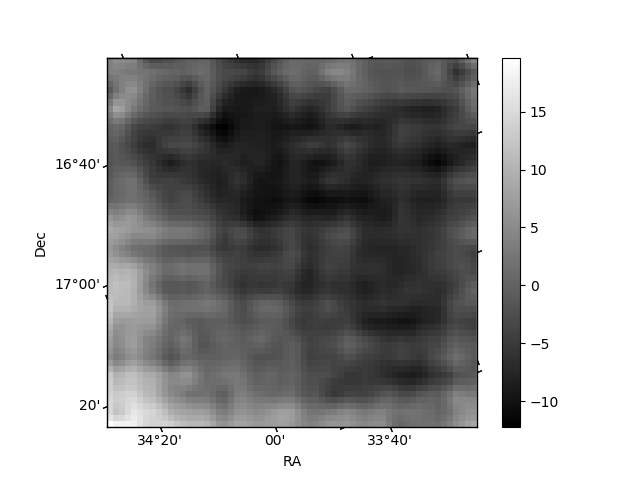
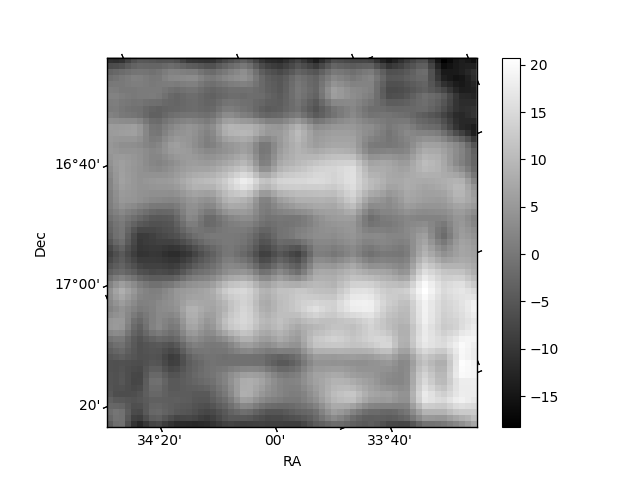
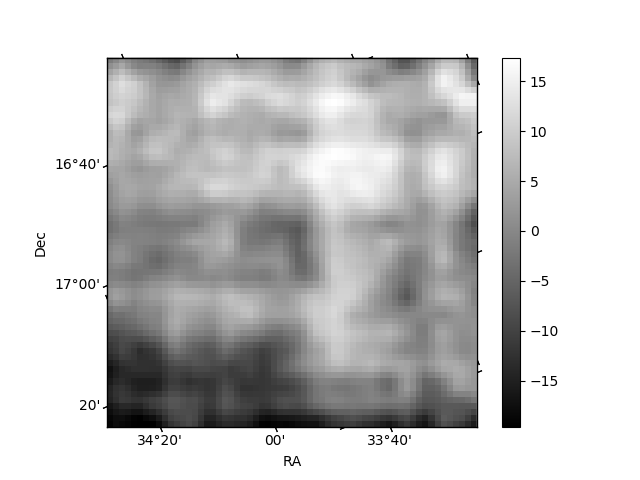
Histogram calculated using DETX and DETY for each event in the final _common_clean file
| Quadrant A | 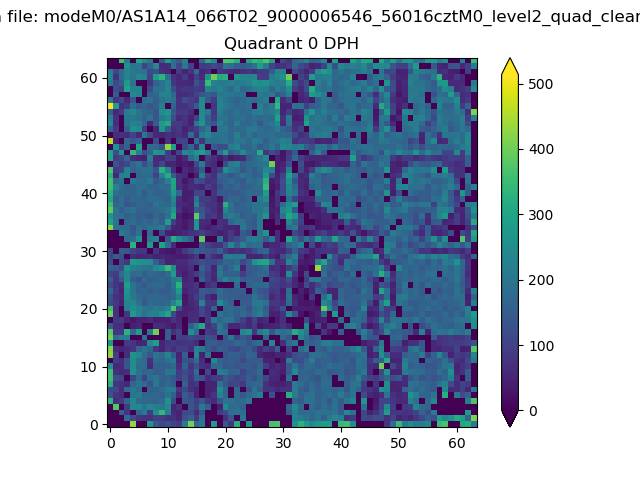 |
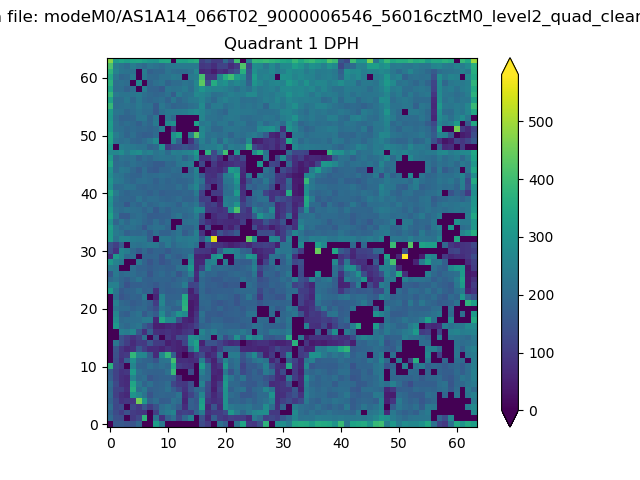 |
Quadrant B |
|---|---|---|---|
| Quadrant D | 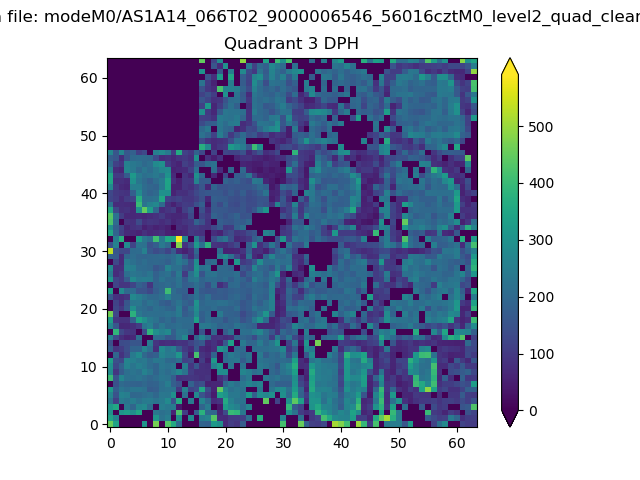 |
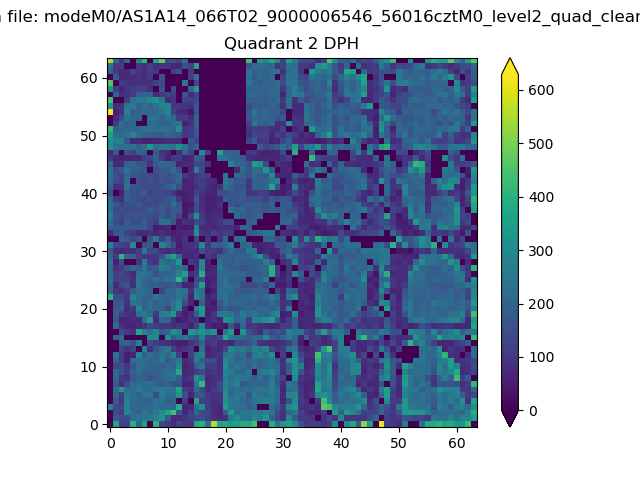 |
Quadrant C |
| Plot type | Count rate plots | Images |
|---|---|---|
| Comparison with Poisson distribution Blue bars denote a histogram of data divided into 1 sec bins. Red curve is a Poisson curve with rate = median count rate of data. |
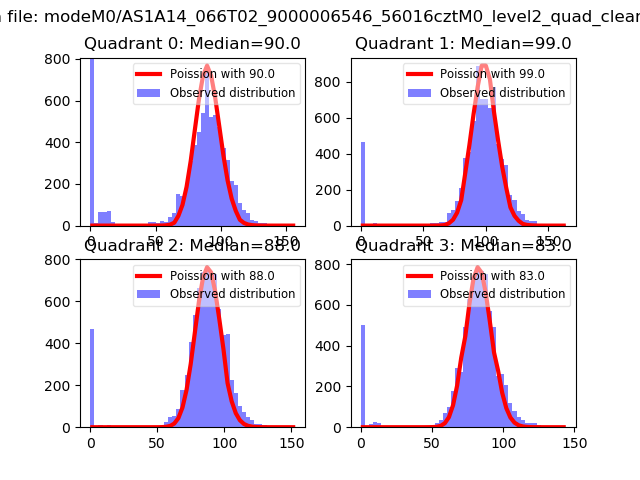 |
 |
| Quadrant-wise count rates Data is divided into 100 sec bins |
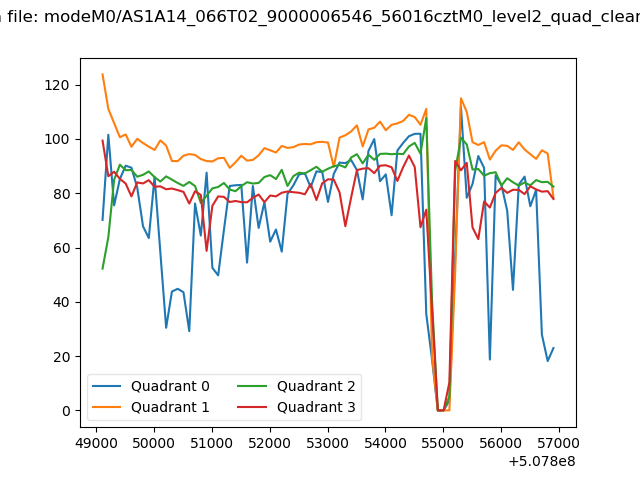 |
|
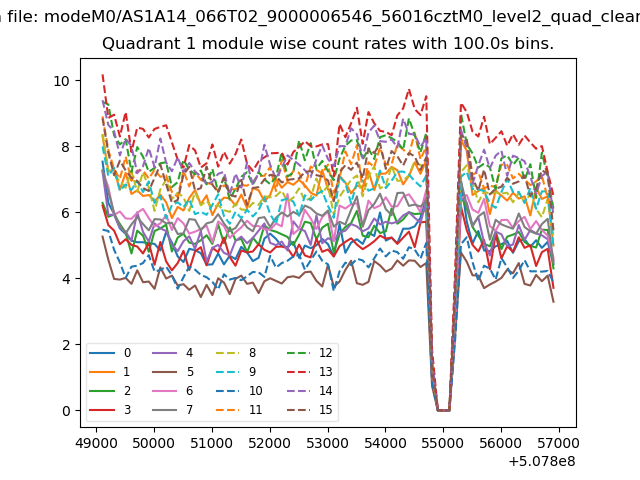
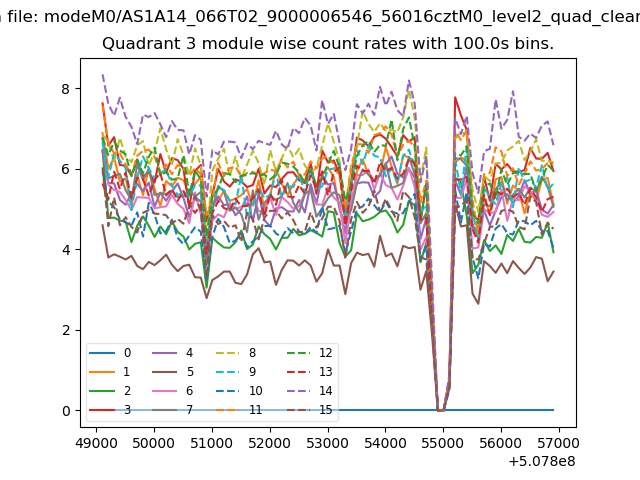
| Module-wise count rates for Quadrant A Data is divided into 100 sec bins |
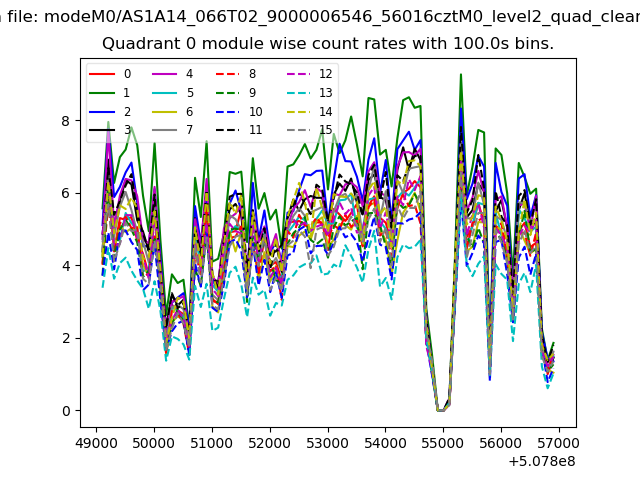 |
 |
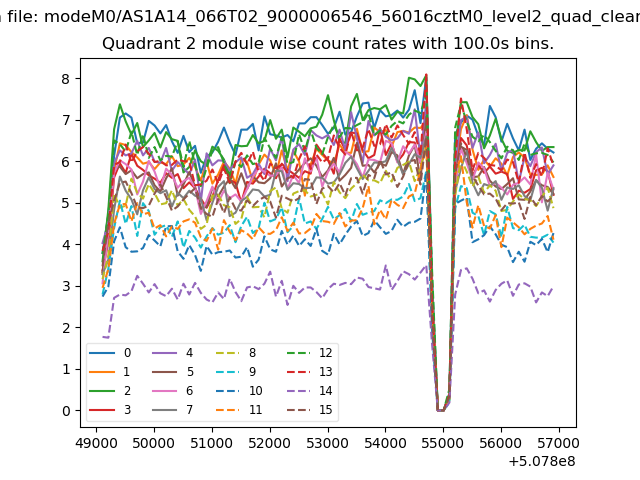
| Module-wise count rates for Quadrant B Data is divided into 100 sec bins |
 |
 |
| Module-wise count rates for Quadrant C Data is divided into 100 sec bins |
 |
 |
| Module-wise count rates for Quadrant D Data is divided into 100 sec bins |
 |
 |
| Parameter | Plot |
|---|---|
| CZT HV Monitor | 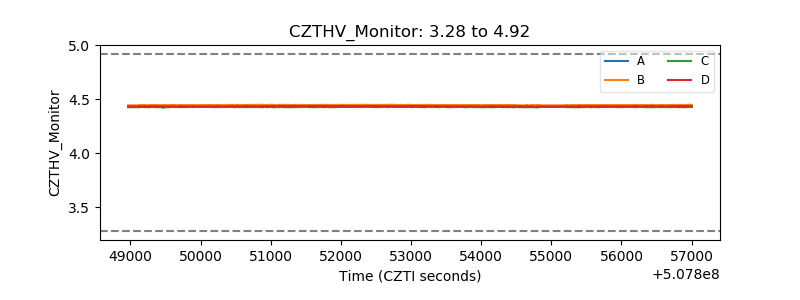 |
| D_VDD | 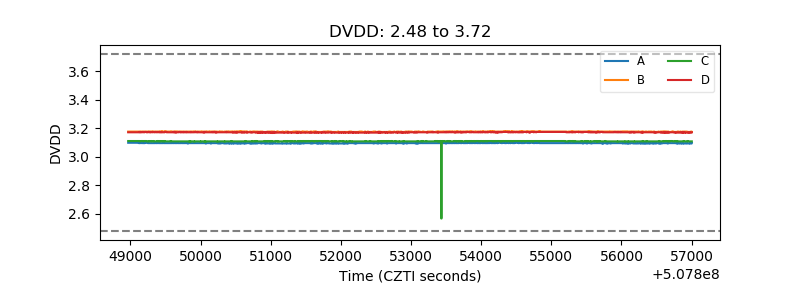 |
| Temperature 1 | 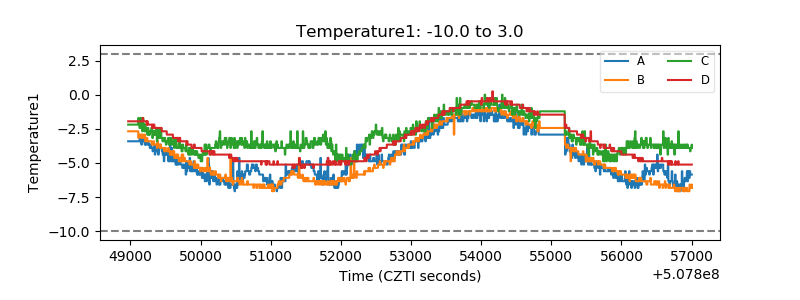 |
| Veto HV Monitor | 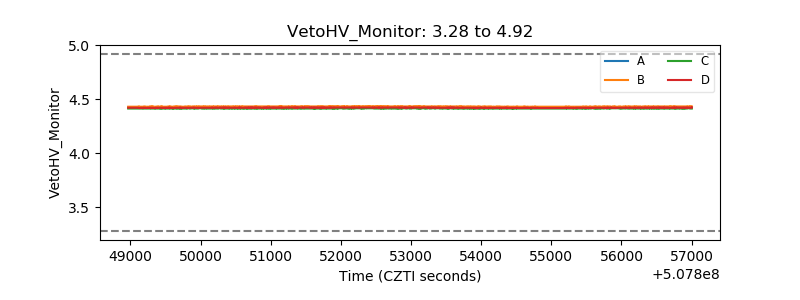 |
| Veto LLD | 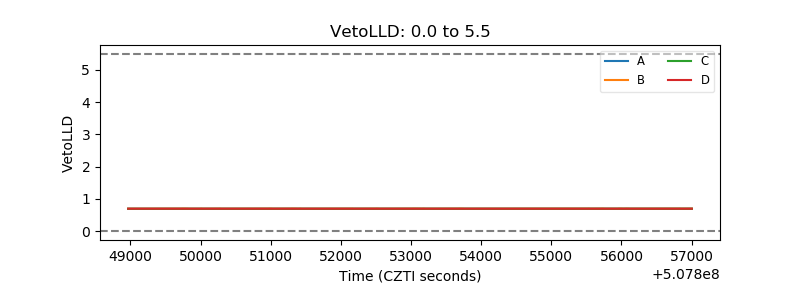 |
| Alpha Counter | 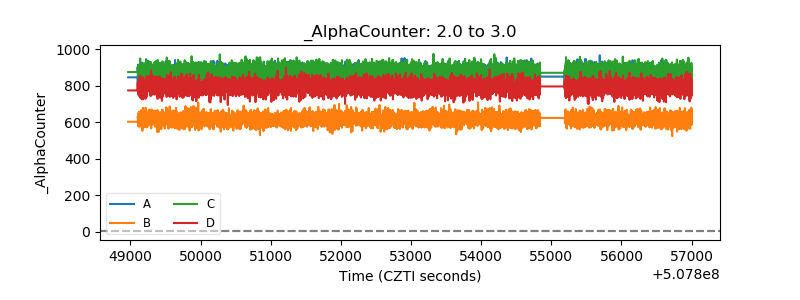 |
| _CPM_Rate | 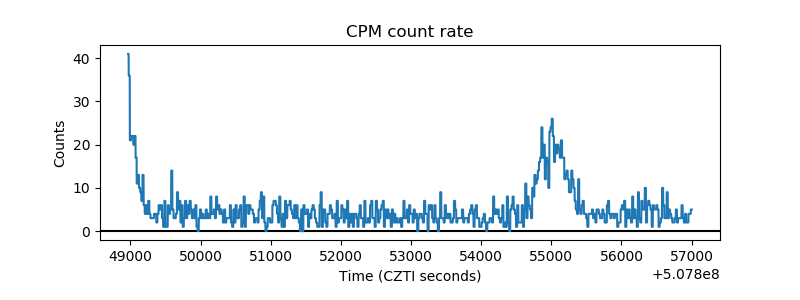 |
| CZT Counter | 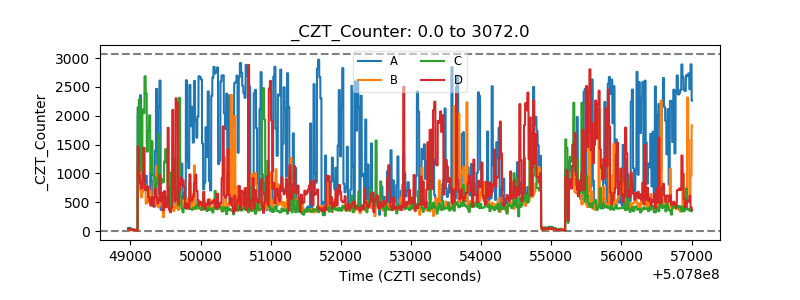 |
| +2.5 Volts monitor | 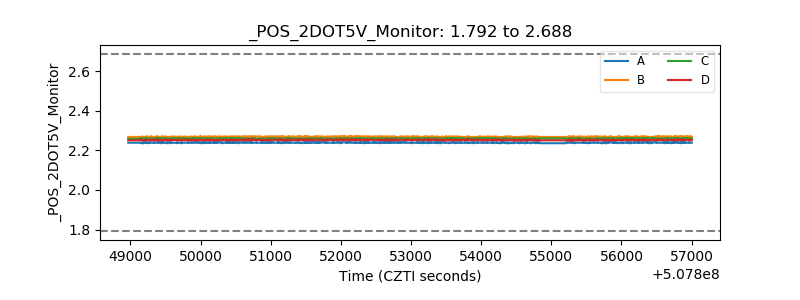 |
| +5 Volts monitor | 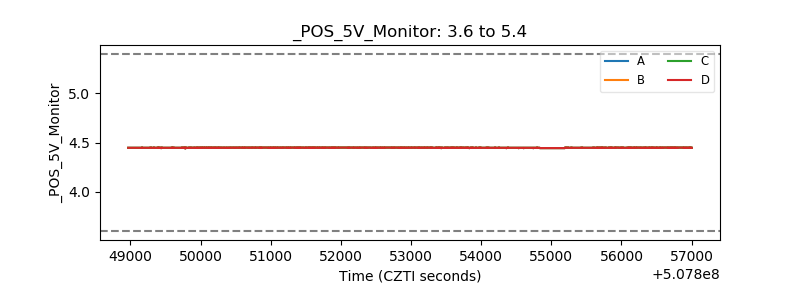 |
| _ROLL_ROT | 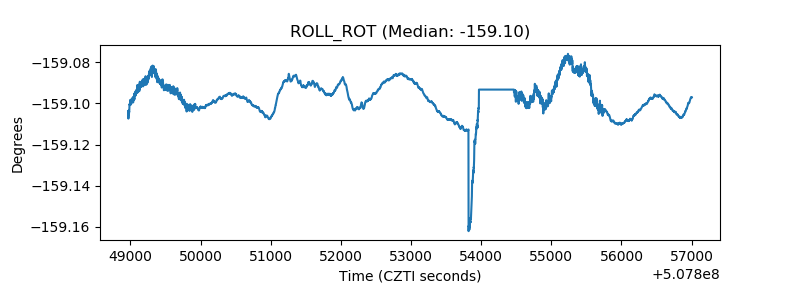 |
| _Roll_DEC | 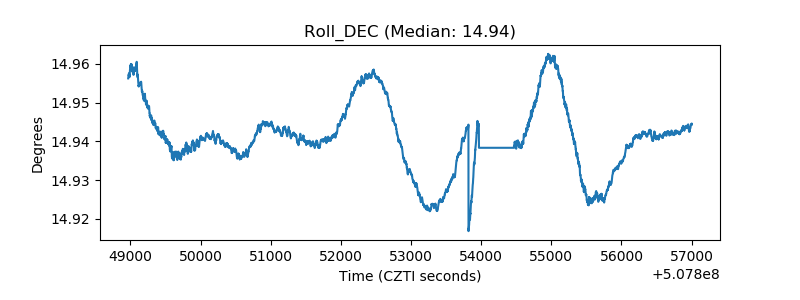 |
| _Roll_RA | 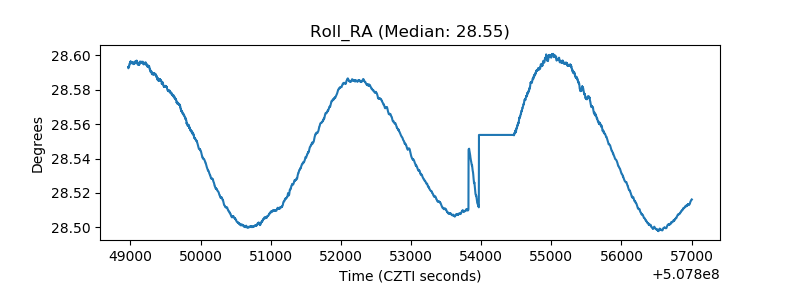 |
| Veto Counter | 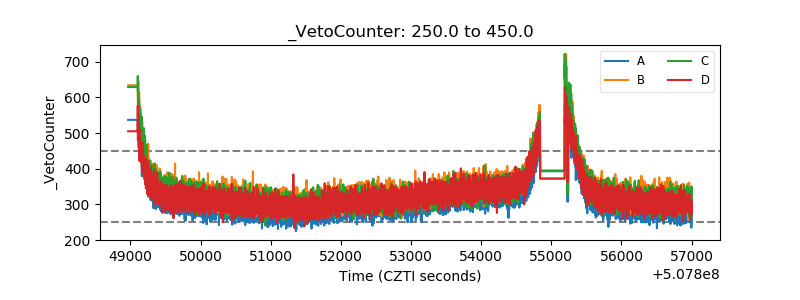 |