| Param | Original file | Final file |
|---|---|---|
| Filename | modeM0/AS1A14_066T02_9000006546_56018cztM0_level2.fits | modeM0/AS1A14_066T02_9000006546_56018cztM0_level2_quad_clean.evt |
| Size (bytes) | 587,531,520 | 114,647,040 |
| Size | 560.3 MB | 109.3 MB |
| Events in quadrant A | 5,669,945 | 722,246 |
| Events in quadrant B | 4,462,395 | 811,784 |
| Events in quadrant C | 5,521,611 | 682,674 |
| Events in quadrant D | 5,455,562 | 682,140 |
| Mode M0 | |||
|---|---|---|---|
| Quadrant | BADHDUFLAG | Total packets | Discarded packets |
| A | 0 | 22733 | 0 |
| B | 0 | 19101 | 0 |
| C | 0 | 22541 | 0 |
| D | 0 | 22021 | 0 |
| Mode SS | |||
|---|---|---|---|
| Quadrant | BADHDUFLAG | Total packets | Discarded packets |
| A | 0 | 166 | 0 |
| B | 0 | 166 | 0 |
| C | 0 | 166 | 0 |
| D | 0 | 166 | 0 |
| Quadrant | Total seconds | Saturated seconds | Saturation percentage |
|---|---|---|---|
| A | 8232 | 579 | 7.033528% |
| B | 8233 | 167 | 2.028422% |
| C | 8233 | 685 | 8.320175% |
| D | 8233 | 202 | 2.453541% |
Noise dominated data is calculated using 1-second bins in cleaned event files. If a bin has >2000 counts, and if more than 50% of those come from <1% of pixels, then it is considered to be noise-dominated and hence unusable.
| Quadrant | # 1 sec bins | Bins with >0 counts | Bins with >2000 counts | High rate bins dominated by noise | Noise dominated (total time) | Noise dominated (detector-on time) | Marked lightcurve |
|---|---|---|---|---|---|---|---|
| A | 8232 | 8232 | 338 | 338 | 4.11% | 4.11% | 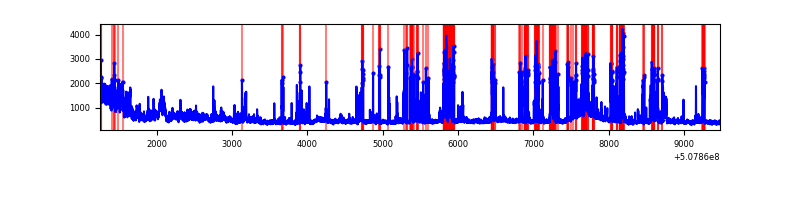 |
| B | 8233 | 8233 | 65 | 65 | 0.79% | 0.79% | 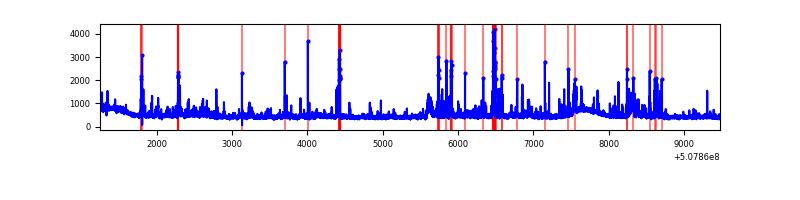 |
| C | 8233 | 8233 | 486 | 486 | 5.90% | 5.90% | 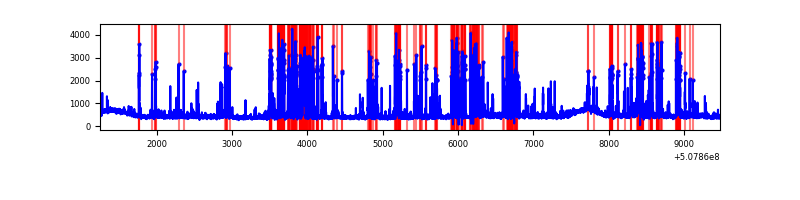 |
| D | 8233 | 8233 | 165 | 165 | 2.00% | 2.00% | 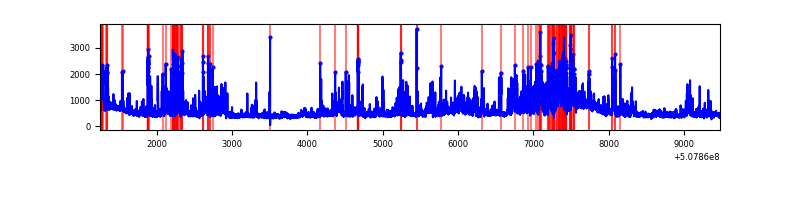 |
Top three noisy pixels from each quadrant. If the there are fewer than three noisy pixels in the level2.evt file, extra rows are filled as -1
| Pixel properties | Quadrant properties | ||||||
|---|---|---|---|---|---|---|---|
| Quadrant | DetID | PixID | Counts | Sigma | Mean | Median | Sigma |
| A | 0 | 8 | 1440884 | 6595.22 | 883 | 860 | 218.3 |
| A | 12 | 115 | 560674 | 2563.91 | 883 | 860 | 218.3 |
| A | 15 | 32 | 130361 | 593.11 | 883 | 860 | 218.3 |
| B | 5 | 172 | 254196 | 1296.27 | 899 | 862 | 195.4 |
| B | 10 | 247 | 183159 | 932.78 | 899 | 862 | 195.4 |
| B | 5 | 185 | 149826 | 762.22 | 899 | 862 | 195.4 |
| C | 15 | 199 | 1805373 | 7802.67 | 848 | 842 | 231.3 |
| C | 12 | 252 | 192218 | 827.5 | 848 | 842 | 231.3 |
| C | 14 | 80 | 102371 | 439.0 | 848 | 842 | 231.3 |
| D | 11 | 129 | 729044 | 2986.39 | 868 | 831 | 243.8 |
| D | 6 | 239 | 408511 | 1671.89 | 868 | 831 | 243.8 |
| D | 2 | 249 | 283698 | 1160.03 | 868 | 831 | 243.8 |
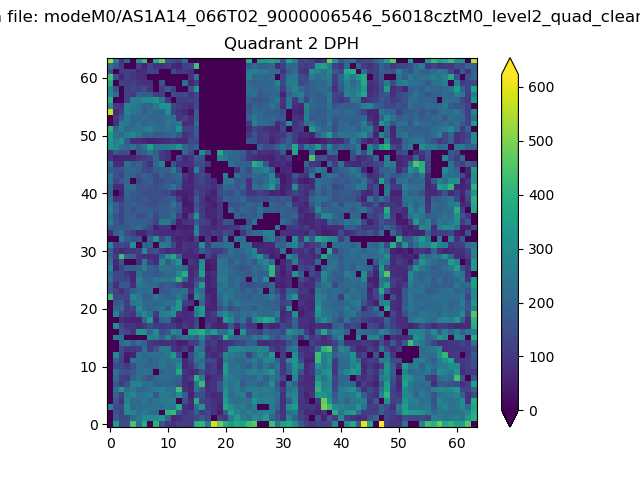
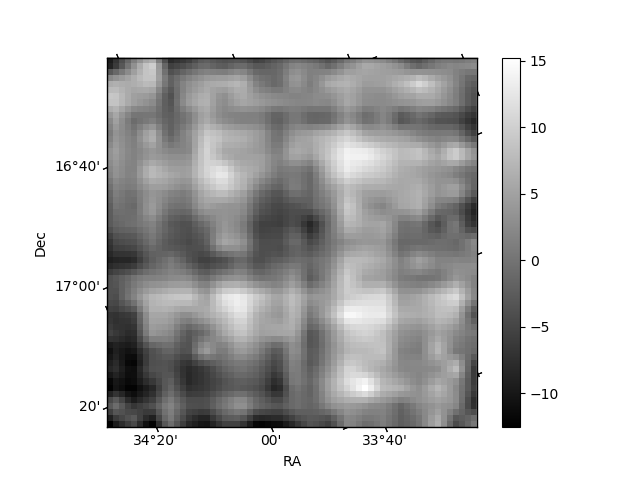
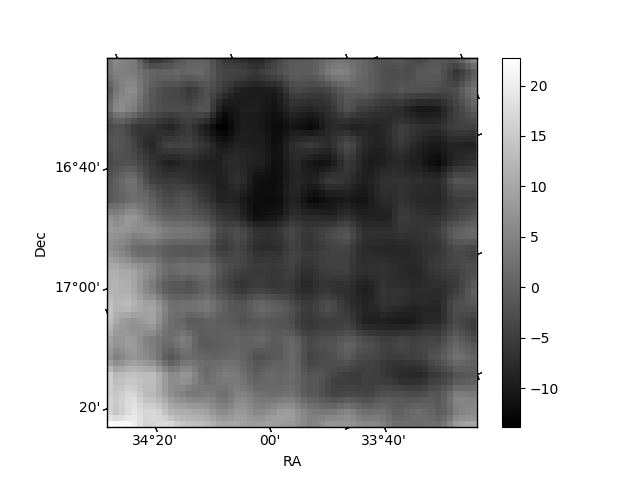
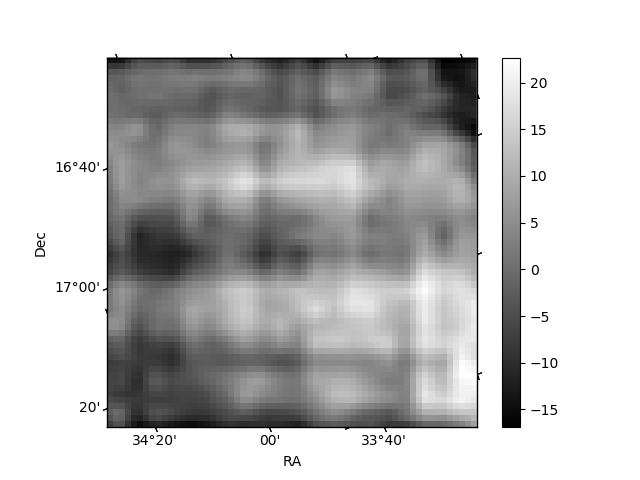
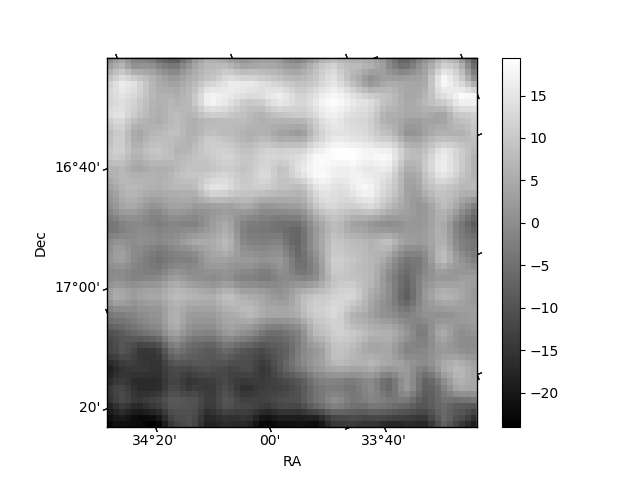
Histogram calculated using DETX and DETY for each event in the final _common_clean file
| Quadrant A | 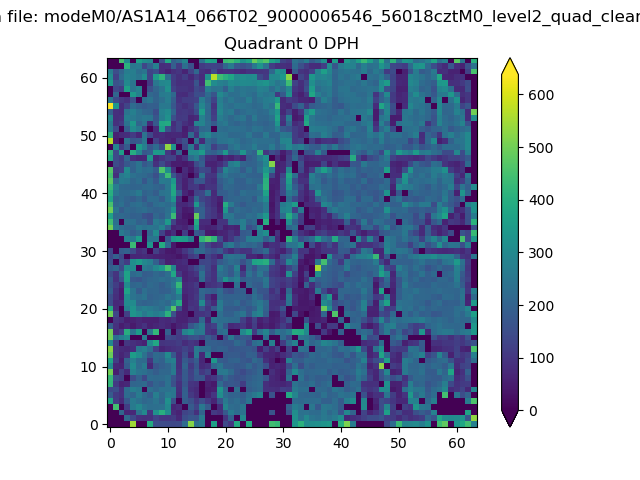 |
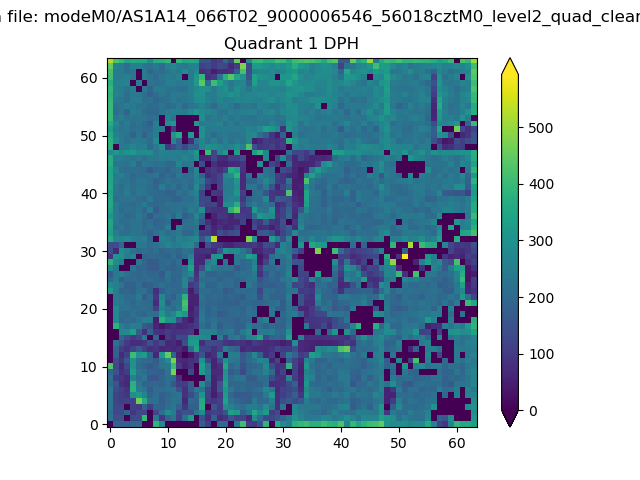 |
Quadrant B |
|---|---|---|---|
| Quadrant D | 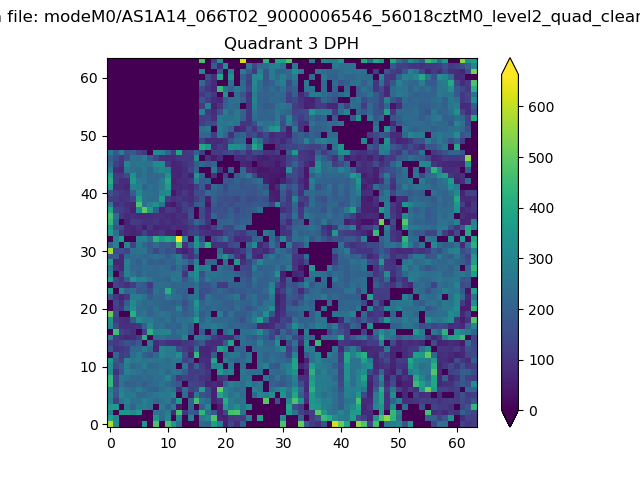 |
 |
Quadrant C |
| Plot type | Count rate plots | Images |
|---|---|---|
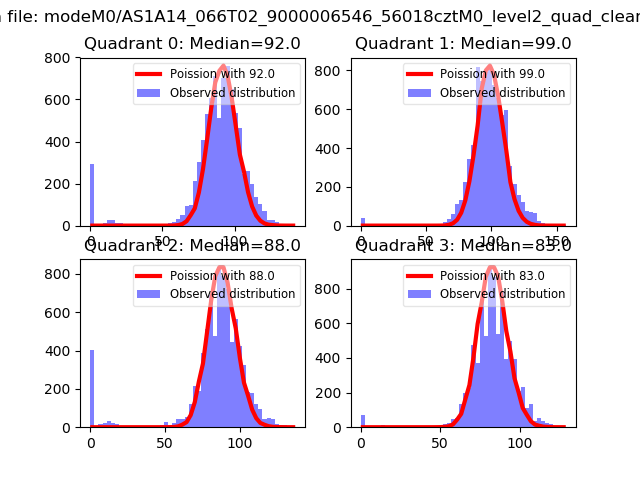
| Comparison with Poisson distribution Blue bars denote a histogram of data divided into 1 sec bins. Red curve is a Poisson curve with rate = median count rate of data. |
 |
 |
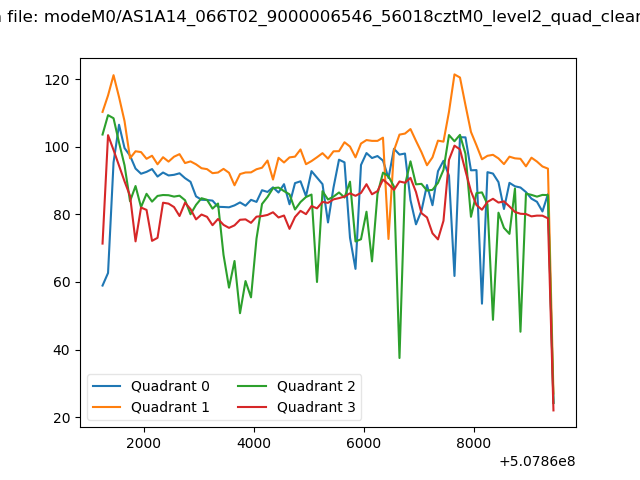
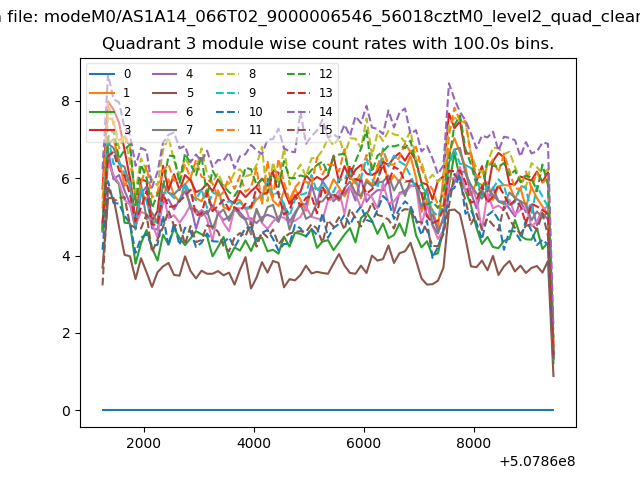
| Quadrant-wise count rates Data is divided into 100 sec bins |
 |
|
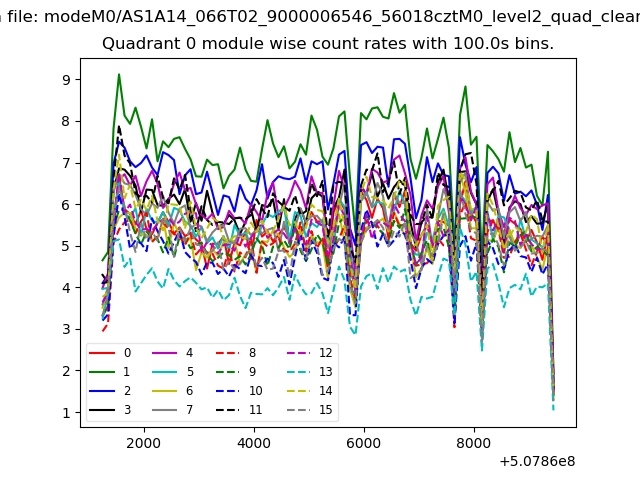
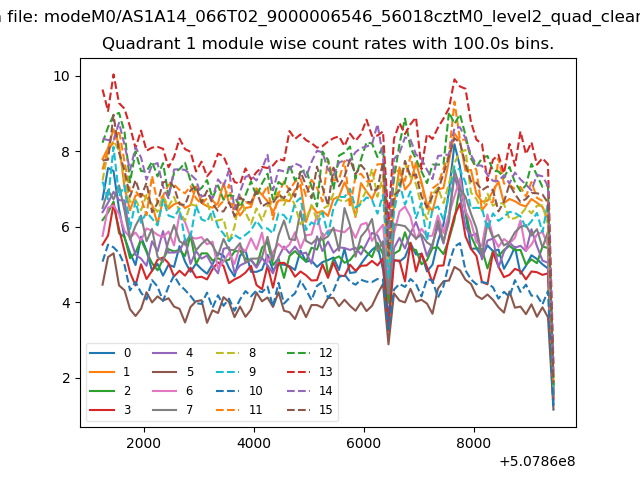
| Module-wise count rates for Quadrant A Data is divided into 100 sec bins |
 |
 |
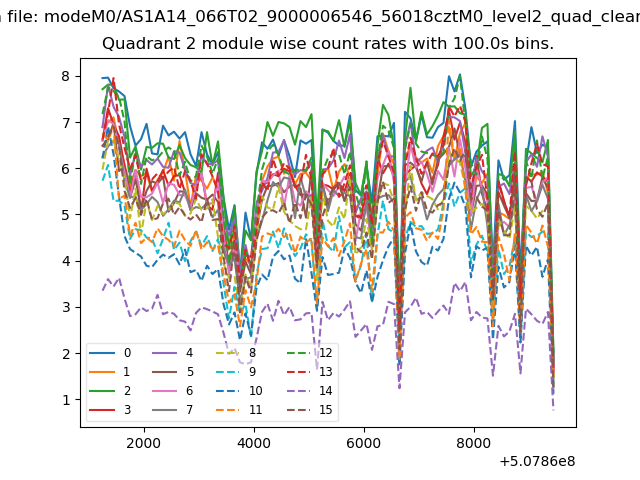
| Module-wise count rates for Quadrant B Data is divided into 100 sec bins |
 |
 |
| Module-wise count rates for Quadrant C Data is divided into 100 sec bins |
 |
 |
| Module-wise count rates for Quadrant D Data is divided into 100 sec bins |
 |
 |
| Parameter | Plot |
|---|---|
| CZT HV Monitor | 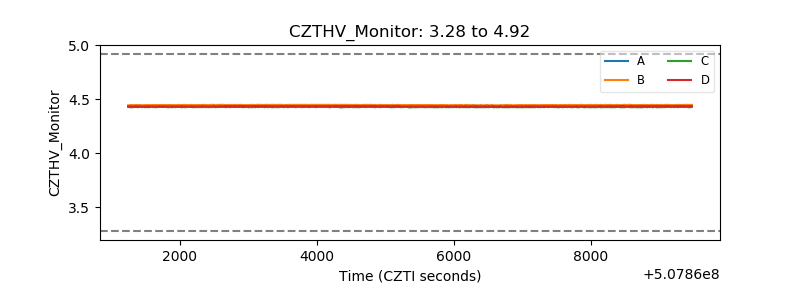 |
| D_VDD | 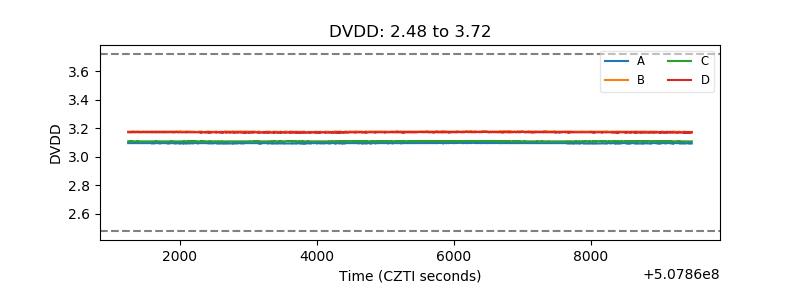 |
| Temperature 1 | 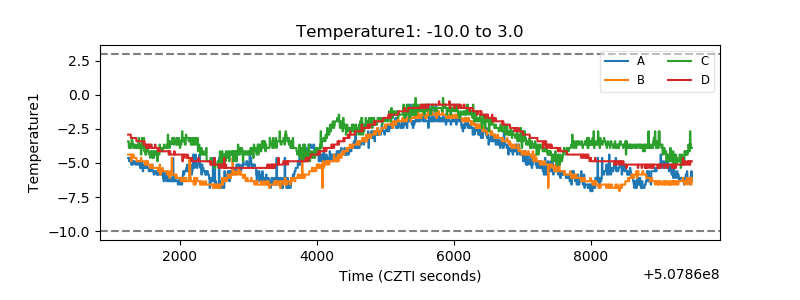 |
| Veto HV Monitor | 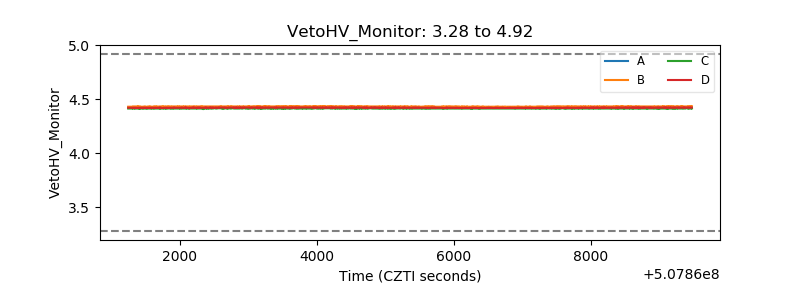 |
| Veto LLD | 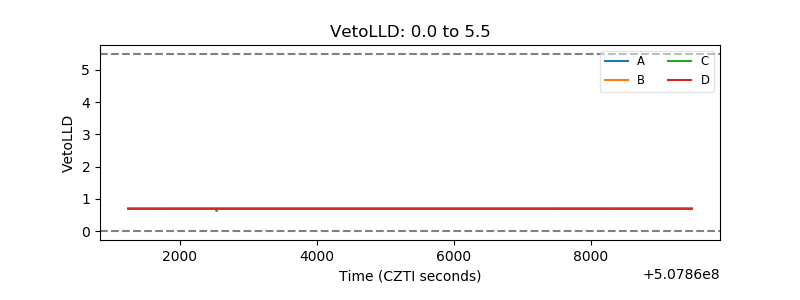 |
| Alpha Counter | 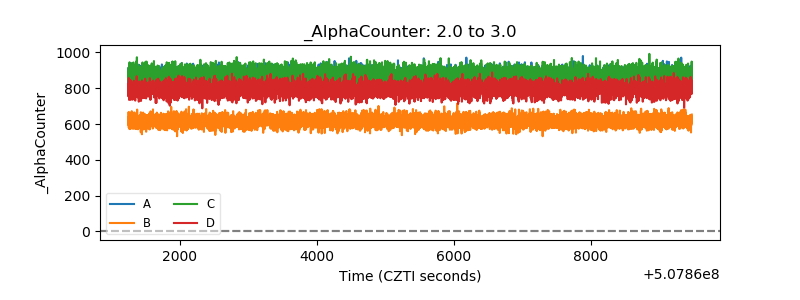 |
| _CPM_Rate | 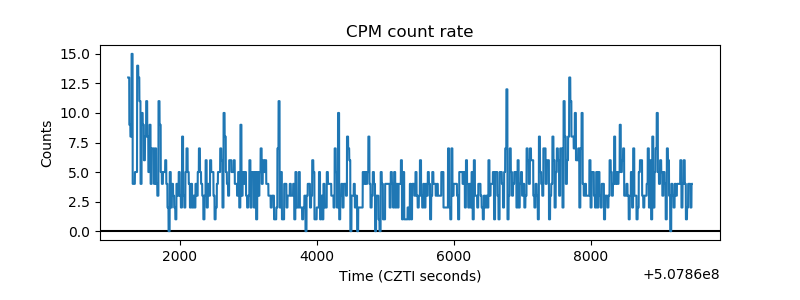 |
| CZT Counter | 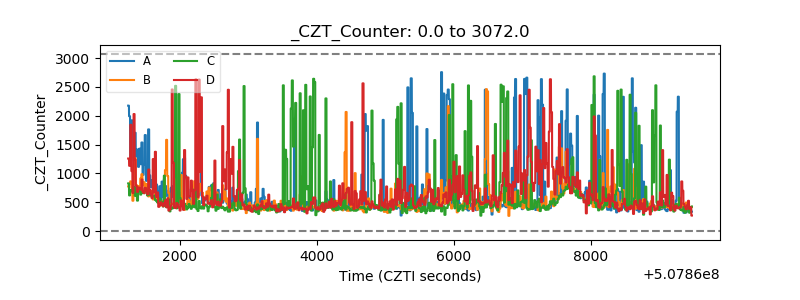 |
| +2.5 Volts monitor |  |
| +5 Volts monitor |  |
| _ROLL_ROT | 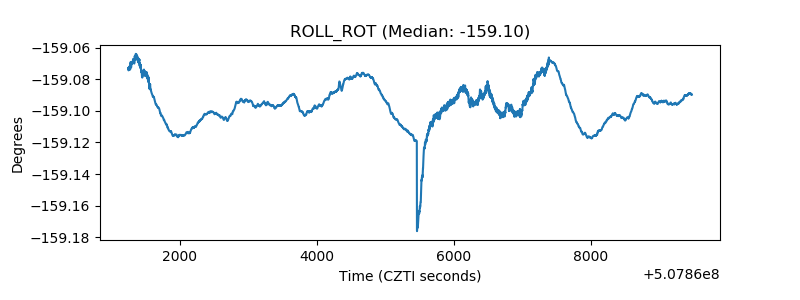 |
| _Roll_DEC | 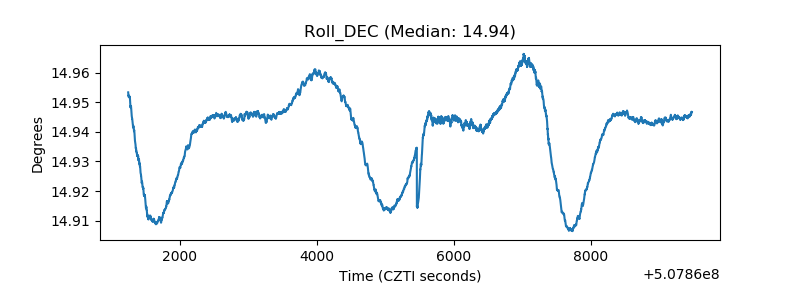 |
| _Roll_RA | 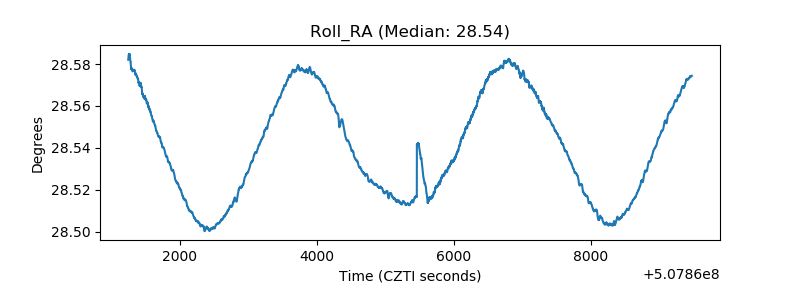 |
| Veto Counter | 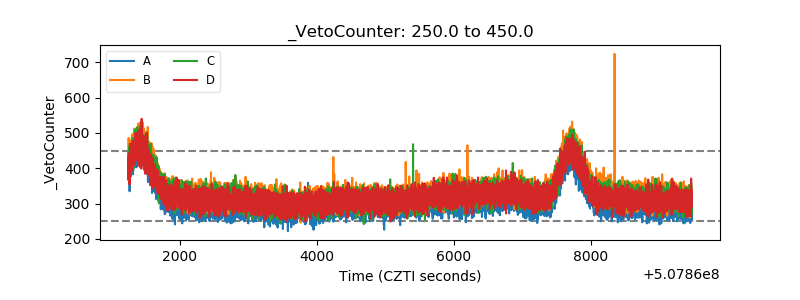 |