| Param | Original file | Final file |
|---|---|---|
| Filename | modeM0/AS1A14_066T02_9000006546_56021cztM0_level2.fits | modeM0/AS1A14_066T02_9000006546_56021cztM0_level2_quad_clean.evt |
| Size (bytes) | 1,219,798,080 | 263,214,720 |
| Size | 1.1 GB | 251.0 MB |
| Events in quadrant A | 11,166,286 | 1,669,494 |
| Events in quadrant B | 9,595,719 | 1,825,023 |
| Events in quadrant C | 9,933,048 | 1,632,591 |
| Events in quadrant D | 12,973,193 | 1,521,894 |
| Mode M9 | |||
|---|---|---|---|
| Quadrant | BADHDUFLAG | Total packets | Discarded packets |
| A | 0 | 9 | 0 |
| B | 0 | 9 | 0 |
| C | 0 | 9 | 0 |
| D | 0 | 9 | 0 |
| Mode M0 | |||
|---|---|---|---|
| Quadrant | BADHDUFLAG | Total packets | Discarded packets |
| A | 0 | 47286 | 3 |
| B | 0 | 42553 | 2 |
| C | 0 | 44091 | 2 |
| D | 0 | 52129 | 2 |
| Mode SS | |||
|---|---|---|---|
| Quadrant | BADHDUFLAG | Total packets | Discarded packets |
| A | 0 | 388 | 0 |
| B | 0 | 388 | 0 |
| C | 0 | 388 | 0 |
| D | 0 | 388 | 0 |
| Quadrant | Total seconds | Saturated seconds | Saturation percentage |
|---|---|---|---|
| A | 19159 | 1111 | 5.798841% |
| B | 19160 | 686 | 3.580376% |
| C | 19160 | 747 | 3.898747% |
| D | 19160 | 1046 | 5.459290% |
Noise dominated data is calculated using 1-second bins in cleaned event files. If a bin has >2000 counts, and if more than 50% of those come from <1% of pixels, then it is considered to be noise-dominated and hence unusable.
| Quadrant | # 1 sec bins | Bins with >0 counts | Bins with >2000 counts | High rate bins dominated by noise | Noise dominated (total time) | Noise dominated (detector-on time) | Marked lightcurve |
|---|---|---|---|---|---|---|---|
| A | 20059 | 19161 | 617 | 617 | 3.08% | 3.22% | 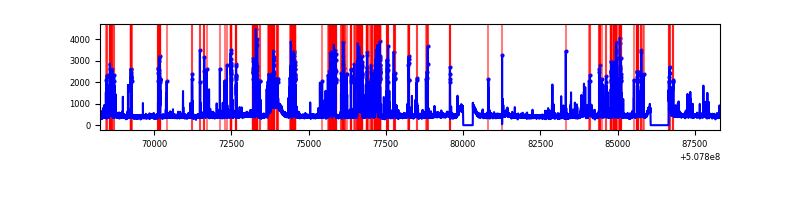 |
| B | 20060 | 19162 | 113 | 113 | 0.56% | 0.59% | 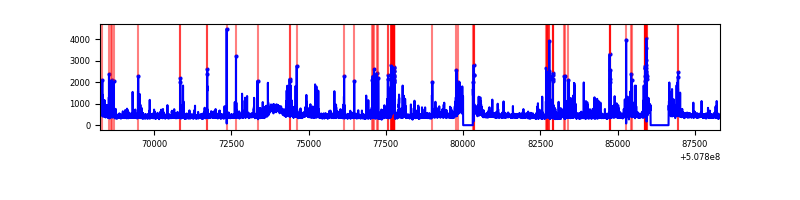 |
| C | 20060 | 19162 | 357 | 357 | 1.78% | 1.86% | 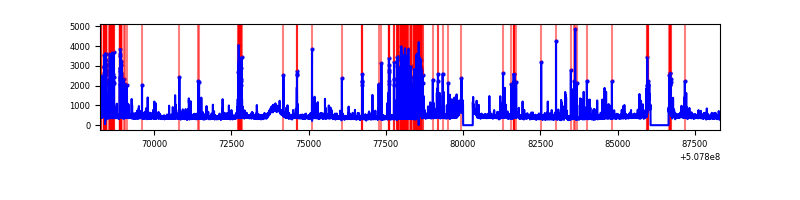 |
| D | 20060 | 19162 | 803 | 803 | 4.00% | 4.19% | 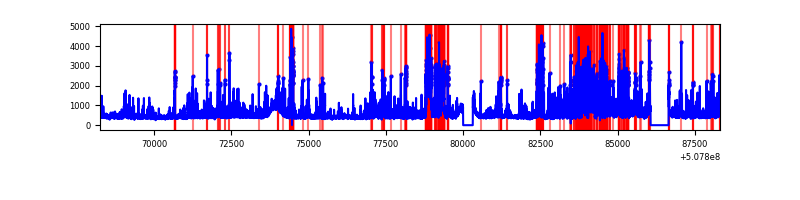 |
Top three noisy pixels from each quadrant. If the there are fewer than three noisy pixels in the level2.evt file, extra rows are filled as -1
| Pixel properties | Quadrant properties | ||||||
|---|---|---|---|---|---|---|---|
| Quadrant | DetID | PixID | Counts | Sigma | Mean | Median | Sigma |
| A | 0 | 8 | 2604162 | 5227.14 | 2041 | 1989 | 497.8 |
| A | 15 | 32 | 345328 | 689.68 | 2041 | 1989 | 497.8 |
| A | 12 | 115 | 100761 | 198.41 | 2041 | 1989 | 497.8 |
| B | 5 | 185 | 428242 | 964.84 | 2048 | 1968 | 441.8 |
| B | 4 | 171 | 385206 | 867.43 | 2048 | 1968 | 441.8 |
| B | 10 | 247 | 235818 | 529.3 | 2048 | 1968 | 441.8 |
| C | 15 | 199 | 1050326 | 1931.32 | 1997 | 1982 | 542.8 |
| C | 12 | 252 | 469048 | 860.45 | 1997 | 1982 | 542.8 |
| C | 14 | 80 | 271754 | 496.99 | 1997 | 1982 | 542.8 |
| D | 11 | 129 | 2434261 | 4355.14 | 1984 | 1896 | 558.5 |
| D | 8 | 129 | 1093671 | 1954.82 | 1984 | 1896 | 558.5 |
| D | 6 | 239 | 384736 | 685.47 | 1984 | 1896 | 558.5 |
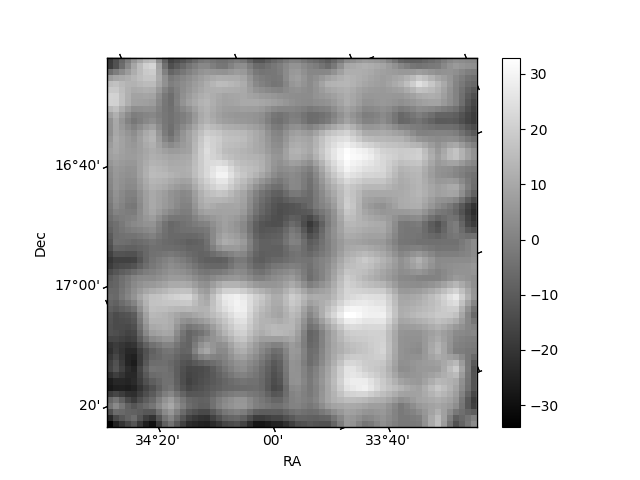
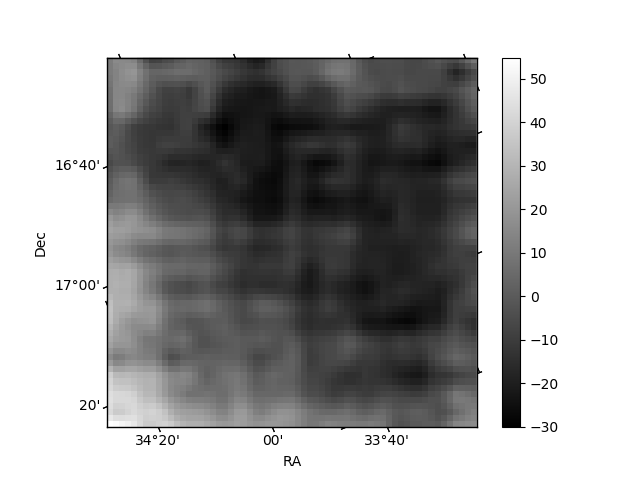
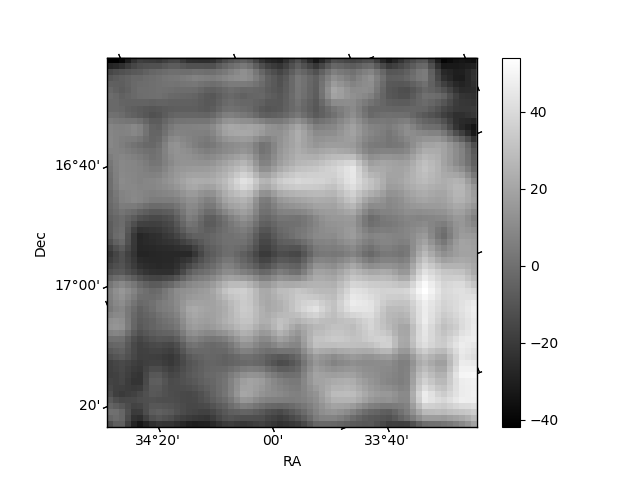
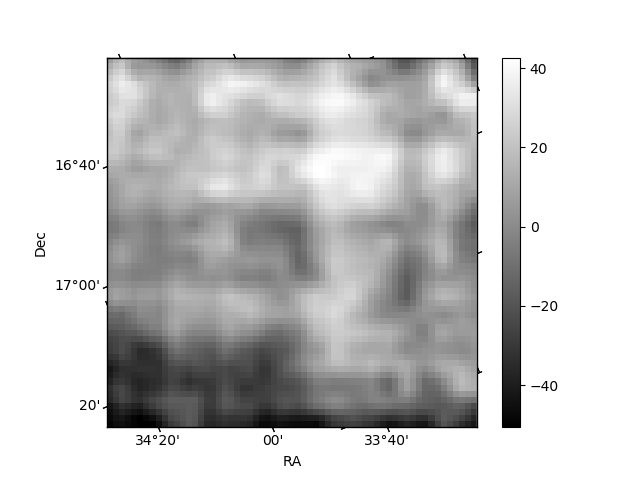
Histogram calculated using DETX and DETY for each event in the final _common_clean file
| Quadrant A | 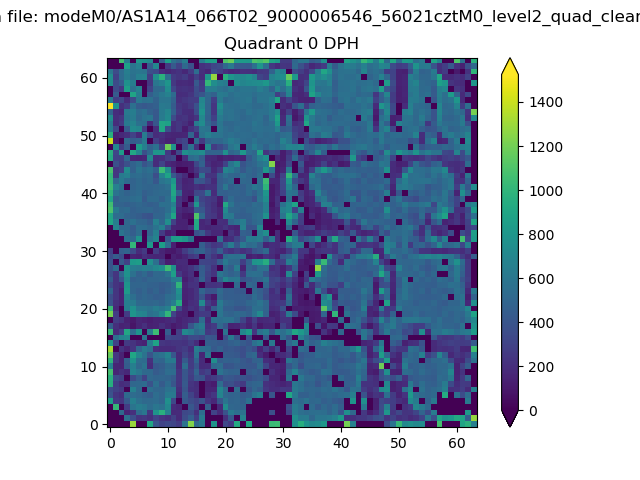 |
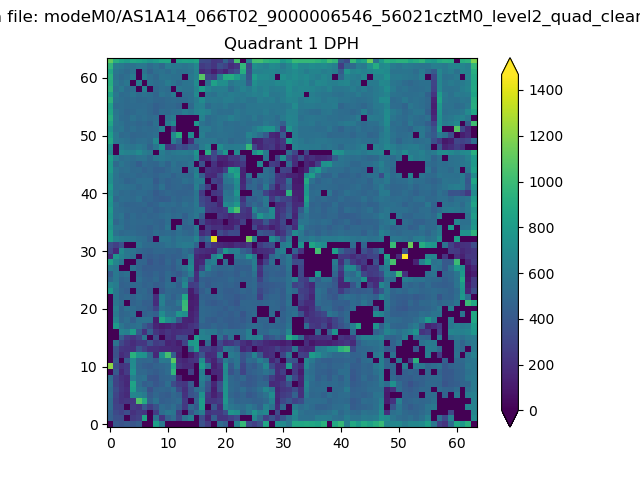 |
Quadrant B |
|---|---|---|---|
| Quadrant D | 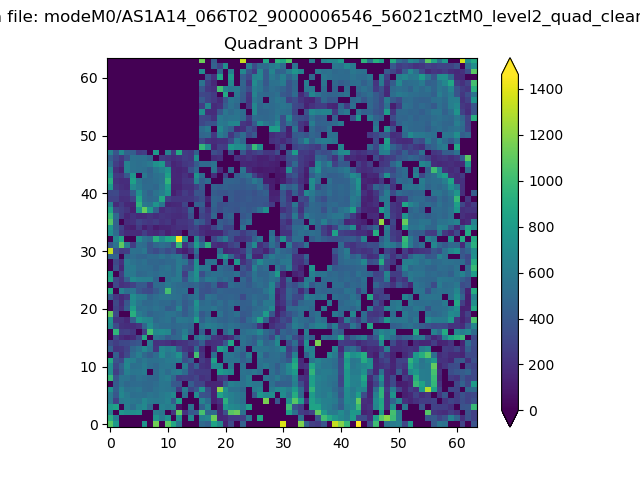 |
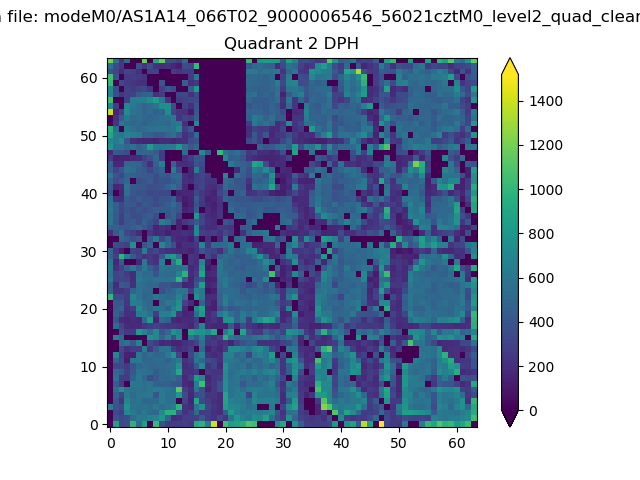 |
Quadrant C |
| Plot type | Count rate plots | Images |
|---|---|---|
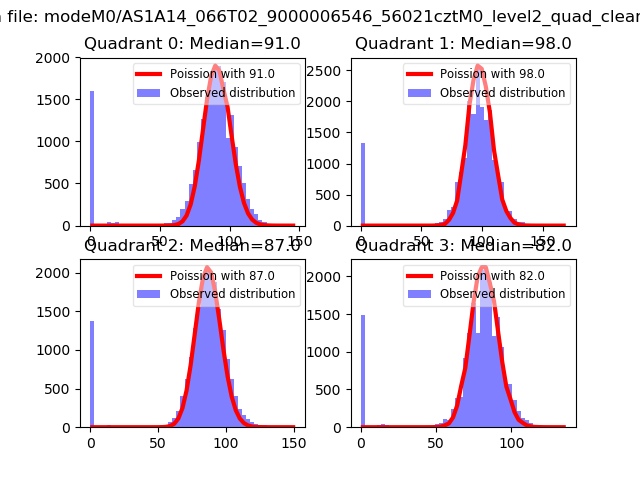
| Comparison with Poisson distribution Blue bars denote a histogram of data divided into 1 sec bins. Red curve is a Poisson curve with rate = median count rate of data. |
 |
 |
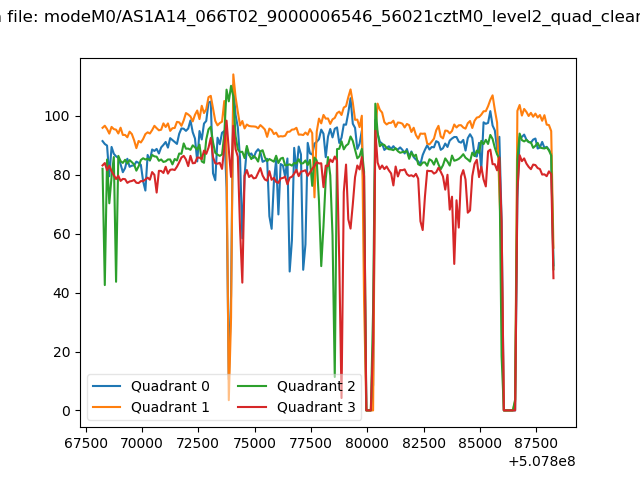
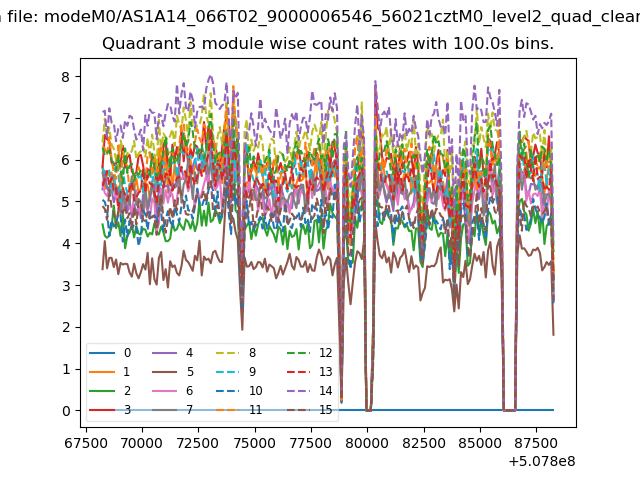
| Quadrant-wise count rates Data is divided into 100 sec bins |
 |
|
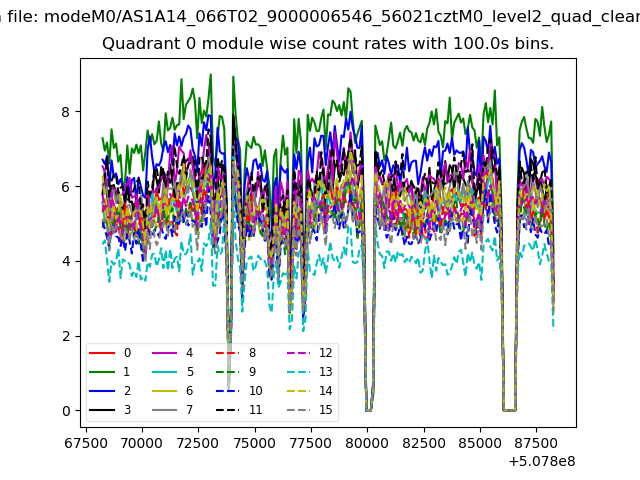
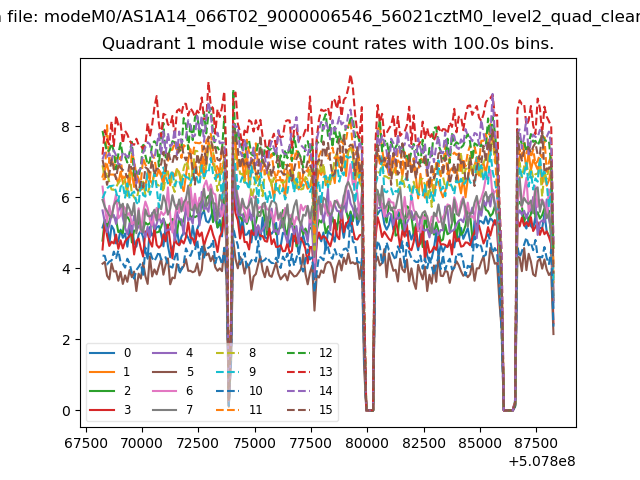
| Module-wise count rates for Quadrant A Data is divided into 100 sec bins |
 |
 |
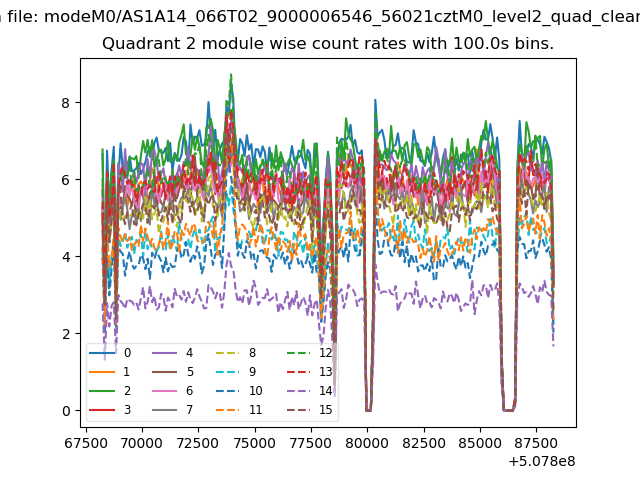
| Module-wise count rates for Quadrant B Data is divided into 100 sec bins |
 |
 |
| Module-wise count rates for Quadrant C Data is divided into 100 sec bins |
 |
 |
| Module-wise count rates for Quadrant D Data is divided into 100 sec bins |
 |
 |
| Parameter | Plot |
|---|---|
| CZT HV Monitor | 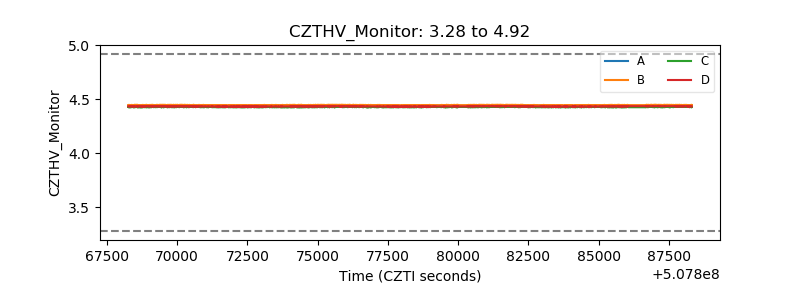 |
| D_VDD | 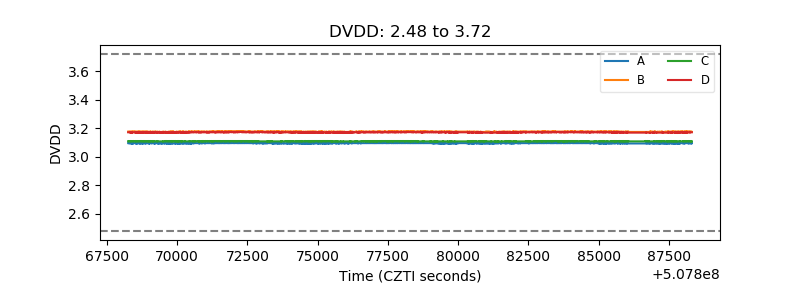 |
| Temperature 1 | 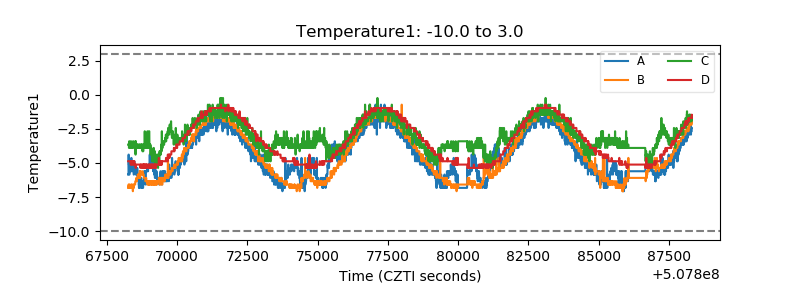 |
| Veto HV Monitor | 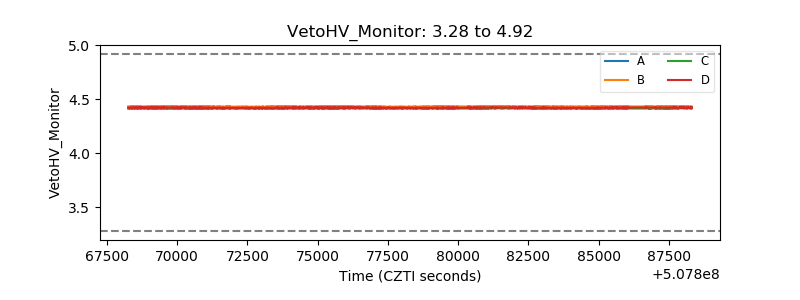 |
| Veto LLD | 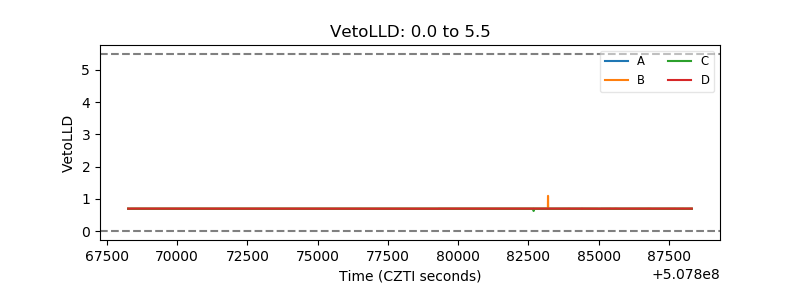 |
| Alpha Counter | 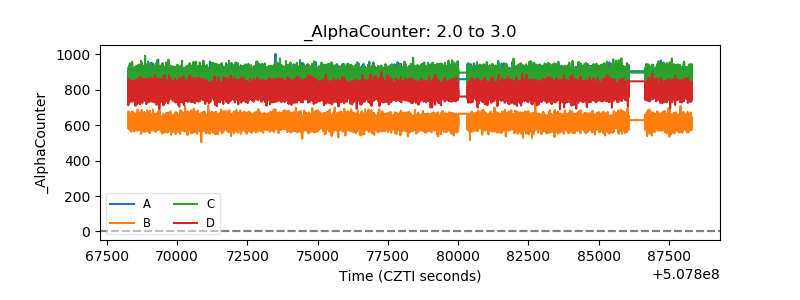 |
| _CPM_Rate | 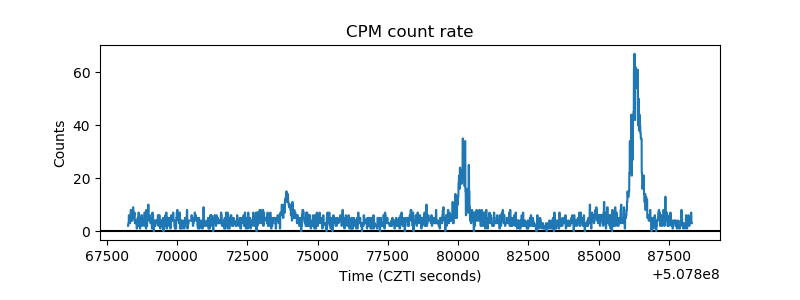 |
| CZT Counter | 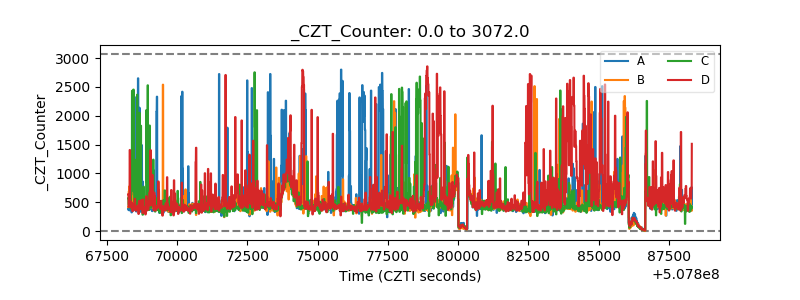 |
| +2.5 Volts monitor |  |
| +5 Volts monitor | 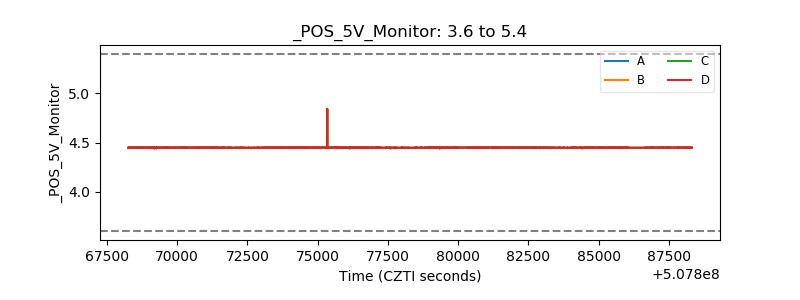 |
| _ROLL_ROT | 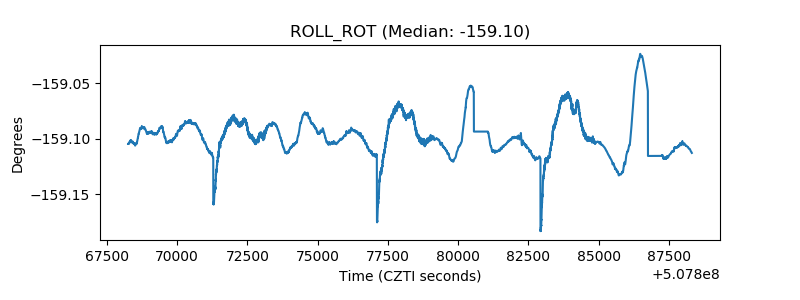 |
| _Roll_DEC | 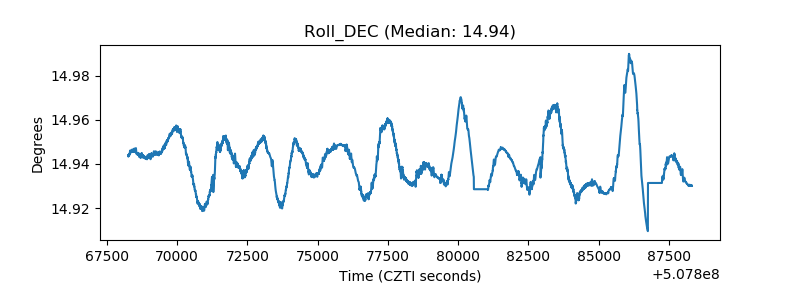 |
| _Roll_RA | 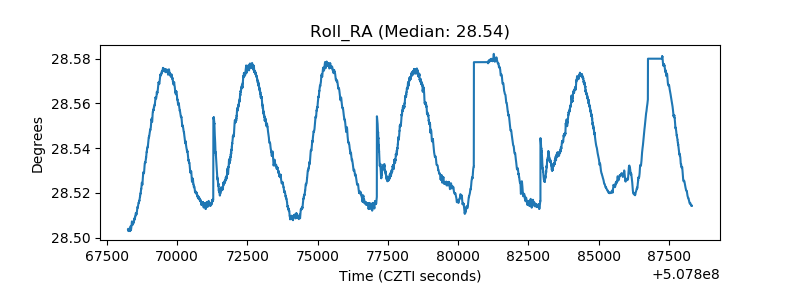 |
| Veto Counter | 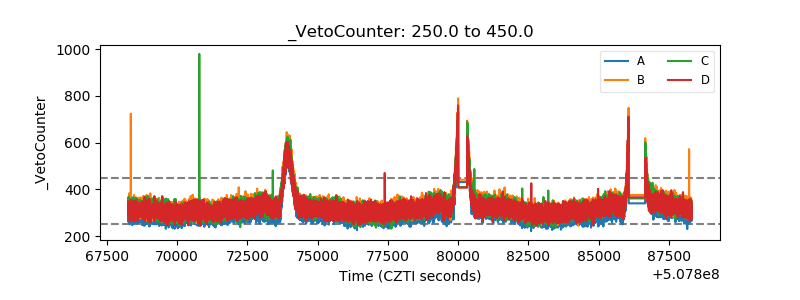 |