| Param | Original file | Final file |
|---|---|---|
| Filename | modeM0/AS1A14_066T02_9000006546_56022cztM0_level2.fits | modeM0/AS1A14_066T02_9000006546_56022cztM0_level2_quad_clean.evt |
| Size (bytes) | 435,962,880 | 89,562,240 |
| Size | 415.8 MB | 85.4 MB |
| Events in quadrant A | 4,034,900 | 569,092 |
| Events in quadrant B | 3,506,058 | 614,884 |
| Events in quadrant C | 2,813,281 | 567,620 |
| Events in quadrant D | 5,286,263 | 514,010 |
| Mode M9 | |||
|---|---|---|---|
| Quadrant | BADHDUFLAG | Total packets | Discarded packets |
| A | 0 | 8 | 0 |
| B | 0 | 8 | 0 |
| C | 0 | 8 | 0 |
| D | 0 | 8 | 0 |
| Mode M0 | |||
|---|---|---|---|
| Quadrant | BADHDUFLAG | Total packets | Discarded packets |
| A | 0 | 16680 | 1 |
| B | 0 | 15031 | 1 |
| C | 0 | 13391 | 1 |
| D | 0 | 20122 | 4 |
| Mode SS | |||
|---|---|---|---|
| Quadrant | BADHDUFLAG | Total packets | Discarded packets |
| A | 0 | 130 | 0 |
| B | 0 | 130 | 0 |
| C | 0 | 130 | 0 |
| D | 0 | 130 | 0 |
| Quadrant | Total seconds | Saturated seconds | Saturation percentage |
|---|---|---|---|
| A | 6395 | 364 | 5.691947% |
| B | 6396 | 266 | 4.158849% |
| C | 6396 | 39 | 0.609756% |
| D | 6395 | 441 | 6.896013% |
Noise dominated data is calculated using 1-second bins in cleaned event files. If a bin has >2000 counts, and if more than 50% of those come from <1% of pixels, then it is considered to be noise-dominated and hence unusable.
| Quadrant | # 1 sec bins | Bins with >0 counts | Bins with >2000 counts | High rate bins dominated by noise | Noise dominated (total time) | Noise dominated (detector-on time) | Marked lightcurve |
|---|---|---|---|---|---|---|---|
| A | 7170 | 6396 | 226 | 226 | 3.15% | 3.53% |  |
| B | 7171 | 6397 | 132 | 132 | 1.84% | 2.06% |  |
| C | 7171 | 6397 | 19 | 19 | 0.26% | 0.30% | 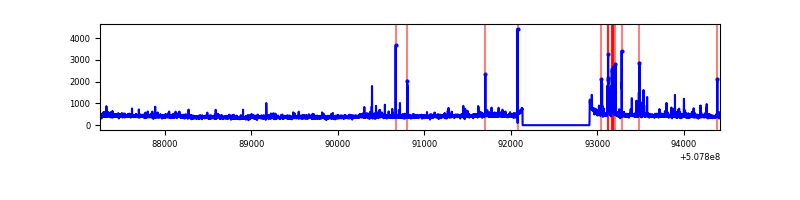 |
| D | 7170 | 6396 | 403 | 403 | 5.62% | 6.30% |  |
Top three noisy pixels from each quadrant. If the there are fewer than three noisy pixels in the level2.evt file, extra rows are filled as -1
| Pixel properties | Quadrant properties | ||||||
|---|---|---|---|---|---|---|---|
| Quadrant | DetID | PixID | Counts | Sigma | Mean | Median | Sigma |
| A | 12 | 115 | 1157810 | 7004.91 | 670 | 655 | 165.2 |
| A | 15 | 32 | 107477 | 646.65 | 670 | 655 | 165.2 |
| A | 0 | 8 | 95870 | 576.39 | 670 | 655 | 165.2 |
| B | 5 | 185 | 487100 | 3342.85 | 666 | 642 | 145.5 |
| B | 0 | 231 | 162519 | 1112.39 | 666 | 642 | 145.5 |
| B | 4 | 171 | 67387 | 458.66 | 666 | 642 | 145.5 |
| C | 3 | 233 | 82726 | 448.73 | 659 | 653 | 182.9 |
| C | 12 | 252 | 59133 | 319.74 | 659 | 653 | 182.9 |
| C | 13 | 3 | 30903 | 165.39 | 659 | 653 | 182.9 |
| D | 11 | 129 | 1262984 | 6871.83 | 646 | 616 | 183.7 |
| D | 8 | 160 | 409215 | 2224.25 | 646 | 616 | 183.7 |
| D | 8 | 129 | 251143 | 1363.77 | 646 | 616 | 183.7 |
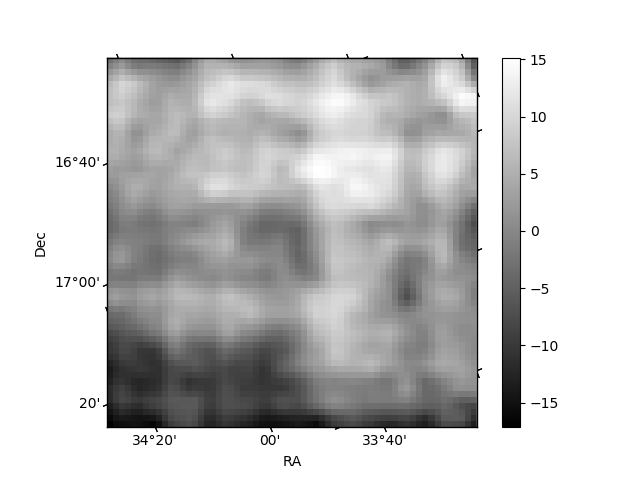
Histogram calculated using DETX and DETY for each event in the final _common_clean file
| Quadrant A | 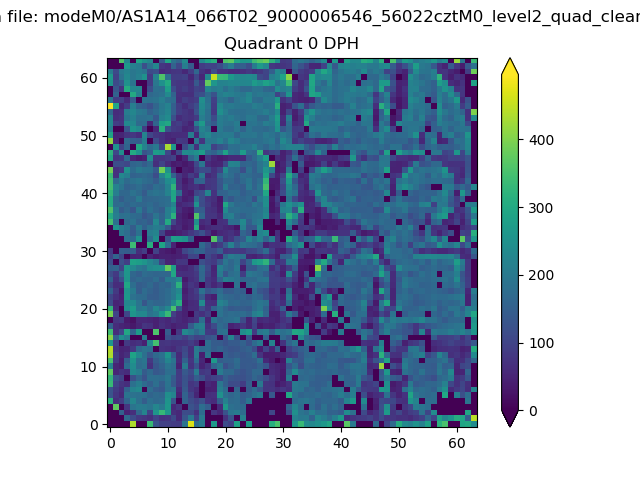 |
 |
Quadrant B |
|---|---|---|---|
| Quadrant D | 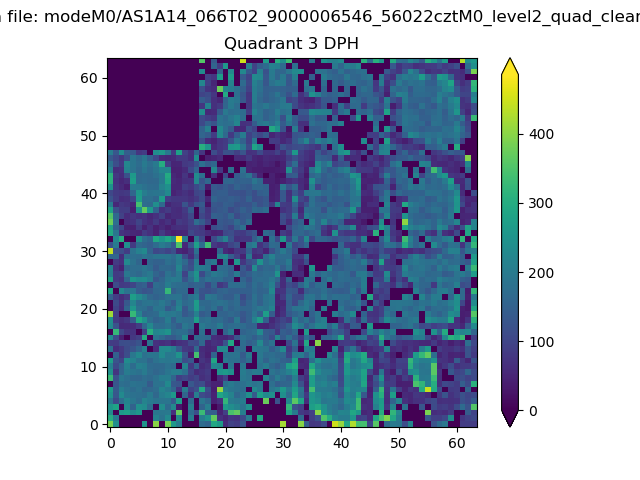 |
 |
Quadrant C |
| Plot type | Count rate plots | Images |
|---|---|---|
| Comparison with Poisson distribution Blue bars denote a histogram of data divided into 1 sec bins. Red curve is a Poisson curve with rate = median count rate of data. |
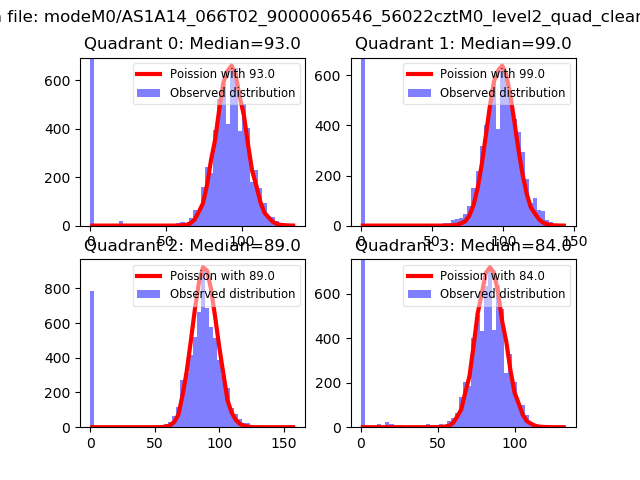 |
 |
| Quadrant-wise count rates Data is divided into 100 sec bins |
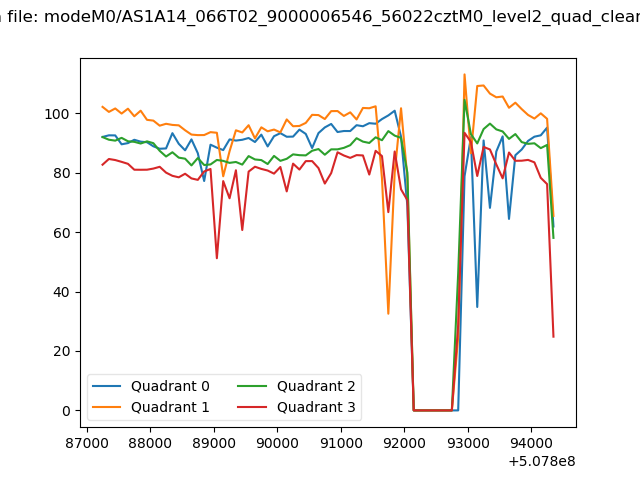 |
|
| Module-wise count rates for Quadrant A Data is divided into 100 sec bins |
 |
 |
| Module-wise count rates for Quadrant B Data is divided into 100 sec bins |
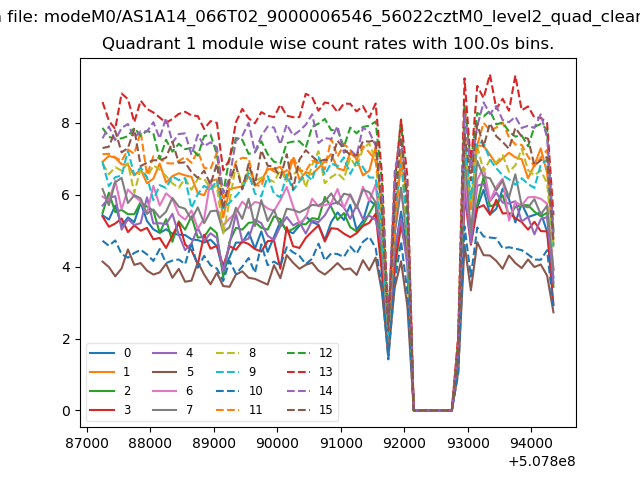 |
 |
| Module-wise count rates for Quadrant C Data is divided into 100 sec bins |
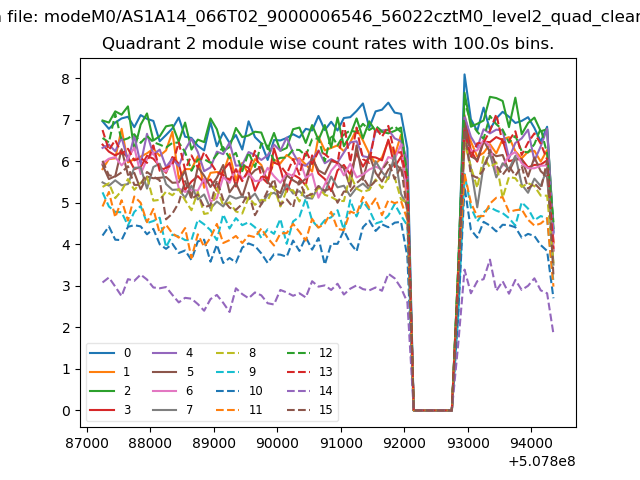 |
 |
| Module-wise count rates for Quadrant D Data is divided into 100 sec bins |
 |
 |
| Parameter | Plot |
|---|---|
| CZT HV Monitor | 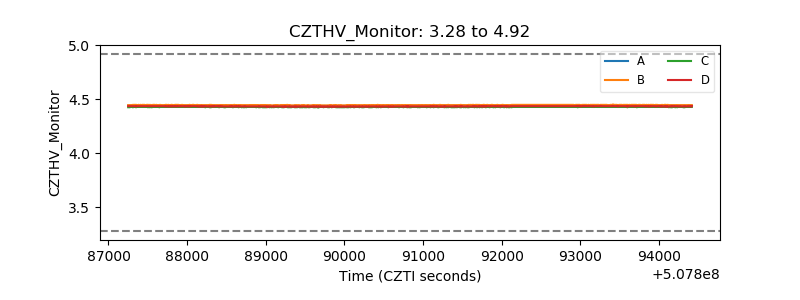 |
| D_VDD |  |
| Temperature 1 |  |
| Veto HV Monitor |  |
| Veto LLD | 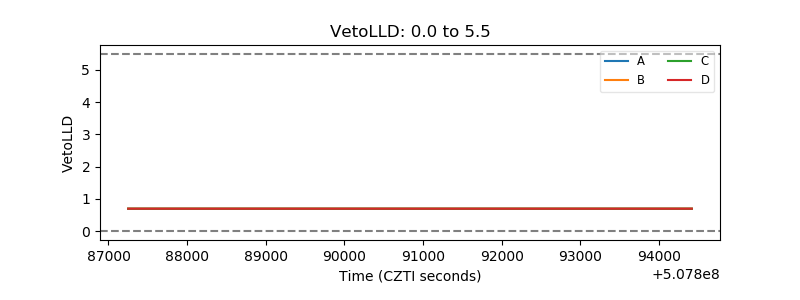 |
| Alpha Counter | 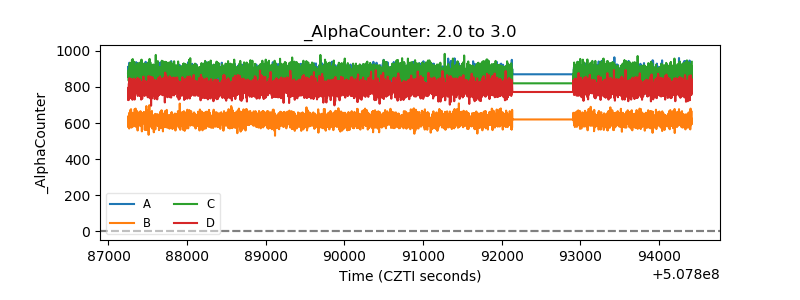 |
| _CPM_Rate |  |
| CZT Counter | 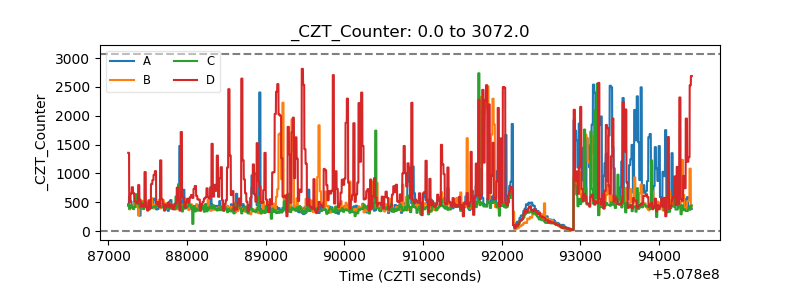 |
| +2.5 Volts monitor | 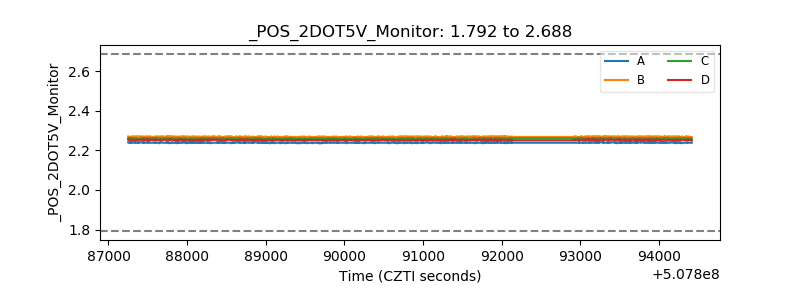 |
| +5 Volts monitor | 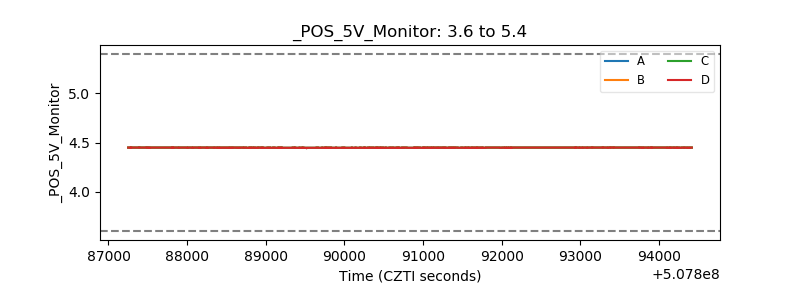 |
| _ROLL_ROT |  |
| _Roll_DEC |  |
| _Roll_RA |  |
| Veto Counter |  |