| Param | Original file | Final file |
|---|---|---|
| Filename | modeM0/AS1A14_066T02_9000006546_56023cztM0_level2.fits | modeM0/AS1A14_066T02_9000006546_56023cztM0_level2_quad_clean.evt |
| Size (bytes) | 506,162,880 | 85,250,880 |
| Size | 482.7 MB | 81.3 MB |
| Events in quadrant A | 5,145,428 | 538,246 |
| Events in quadrant B | 3,120,371 | 621,727 |
| Events in quadrant C | 2,872,786 | 555,001 |
| Events in quadrant D | 7,116,440 | 433,531 |
| Mode M9 | |||
|---|---|---|---|
| Quadrant | BADHDUFLAG | Total packets | Discarded packets |
| A | 0 | 10 | 0 |
| B | 0 | 10 | 0 |
| C | 0 | 10 | 0 |
| D | 0 | 10 | 0 |
| Mode M0 | |||
|---|---|---|---|
| Quadrant | BADHDUFLAG | Total packets | Discarded packets |
| A | 0 | 19646 | 1 |
| B | 0 | 13714 | 1 |
| C | 0 | 13293 | 1 |
| D | 0 | 25431 | 3 |
| Mode SS | |||
|---|---|---|---|
| Quadrant | BADHDUFLAG | Total packets | Discarded packets |
| A | 0 | 126 | 0 |
| B | 0 | 126 | 0 |
| C | 0 | 126 | 0 |
| D | 0 | 126 | 0 |
| Quadrant | Total seconds | Saturated seconds | Saturation percentage |
|---|---|---|---|
| A | 6197 | 624 | 10.069388% |
| B | 6197 | 92 | 1.484589% |
| C | 6198 | 44 | 0.709906% |
| D | 6197 | 1306 | 21.074714% |
Noise dominated data is calculated using 1-second bins in cleaned event files. If a bin has >2000 counts, and if more than 50% of those come from <1% of pixels, then it is considered to be noise-dominated and hence unusable.
| Quadrant | # 1 sec bins | Bins with >0 counts | Bins with >2000 counts | High rate bins dominated by noise | Noise dominated (total time) | Noise dominated (detector-on time) | Marked lightcurve |
|---|---|---|---|---|---|---|---|
| A | 7127 | 6198 | 452 | 452 | 6.34% | 7.29% |  |
| B | 7127 | 6198 | 39 | 39 | 0.55% | 0.63% |  |
| C | 7128 | 6199 | 18 | 18 | 0.25% | 0.29% | 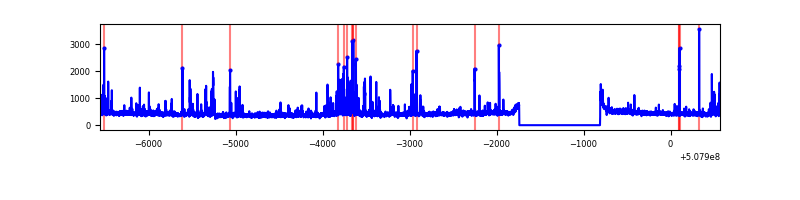 |
| D | 7127 | 6198 | 1166 | 1166 | 16.36% | 18.81% |  |
Top three noisy pixels from each quadrant. If the there are fewer than three noisy pixels in the level2.evt file, extra rows are filled as -1
| Pixel properties | Quadrant properties | ||||||
|---|---|---|---|---|---|---|---|
| Quadrant | DetID | PixID | Counts | Sigma | Mean | Median | Sigma |
| A | 12 | 115 | 2121712 | 13305.69 | 641 | 626 | 159.4 |
| A | 0 | 8 | 377161 | 2362.02 | 641 | 626 | 159.4 |
| A | 4 | 3 | 31161 | 191.54 | 641 | 626 | 159.4 |
| B | 5 | 185 | 272003 | 1888.8 | 653 | 628 | 143.7 |
| B | 10 | 247 | 95041 | 657.12 | 653 | 628 | 143.7 |
| B | 4 | 171 | 41633 | 285.4 | 653 | 628 | 143.7 |
| C | 12 | 252 | 122515 | 687.86 | 640 | 633 | 177.2 |
| C | 13 | 3 | 97957 | 549.26 | 640 | 633 | 177.2 |
| C | 6 | 223 | 39566 | 219.73 | 640 | 633 | 177.2 |
| D | 11 | 129 | 2949941 | 17529.46 | 589 | 563 | 168.3 |
| D | 8 | 160 | 1079348 | 6411.69 | 589 | 563 | 168.3 |
| D | 6 | 239 | 425122 | 2523.34 | 589 | 563 | 168.3 |
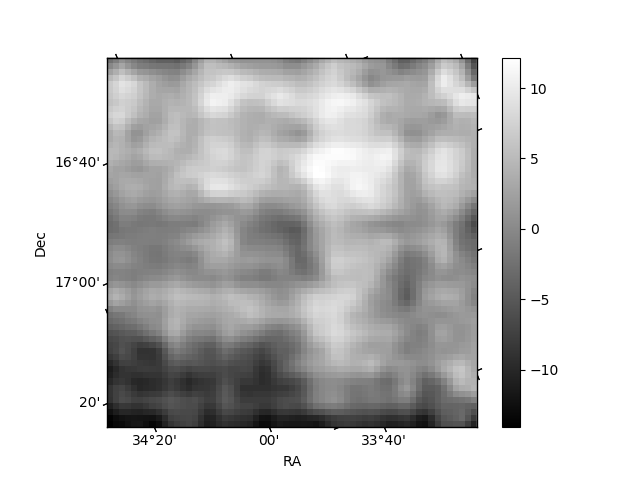
Histogram calculated using DETX and DETY for each event in the final _common_clean file
| Quadrant A | 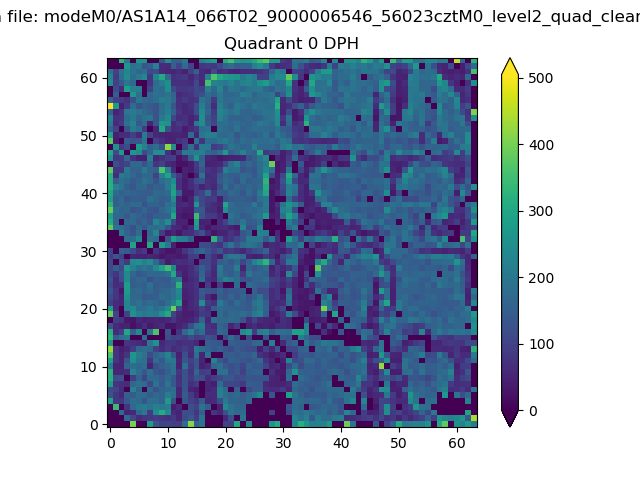 |
 |
Quadrant B |
|---|---|---|---|
| Quadrant D | 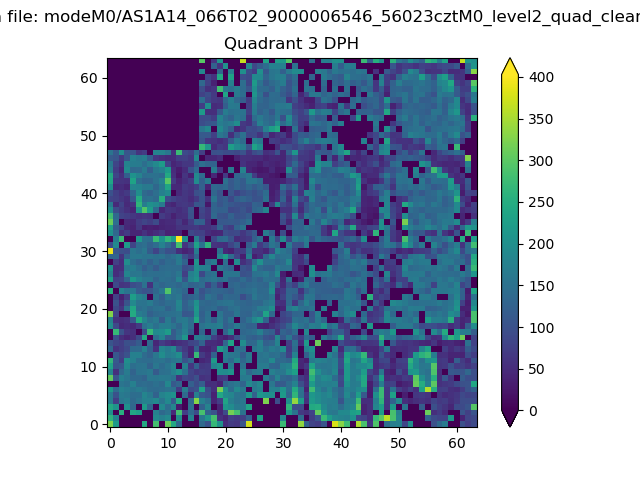 |
 |
Quadrant C |
| Plot type | Count rate plots | Images |
|---|---|---|
| Comparison with Poisson distribution Blue bars denote a histogram of data divided into 1 sec bins. Red curve is a Poisson curve with rate = median count rate of data. |
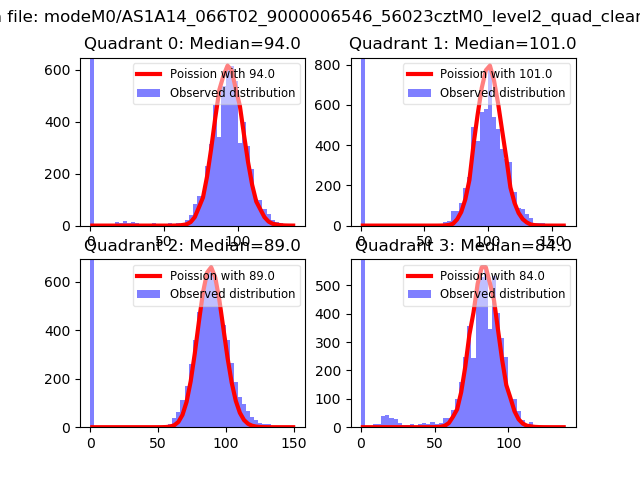 |
 |
| Quadrant-wise count rates Data is divided into 100 sec bins |
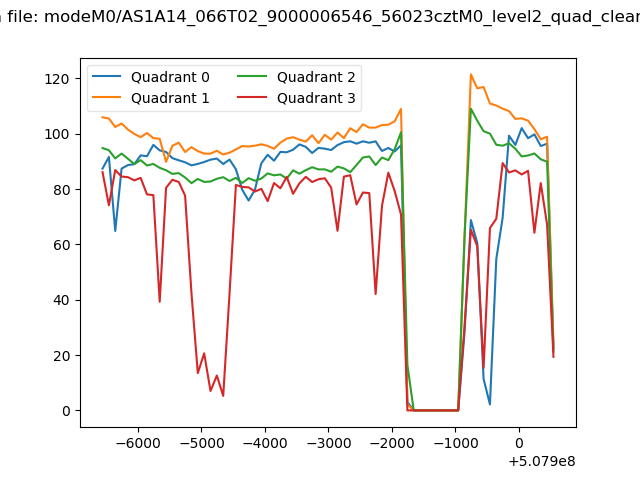 |
|
| Module-wise count rates for Quadrant A Data is divided into 100 sec bins |
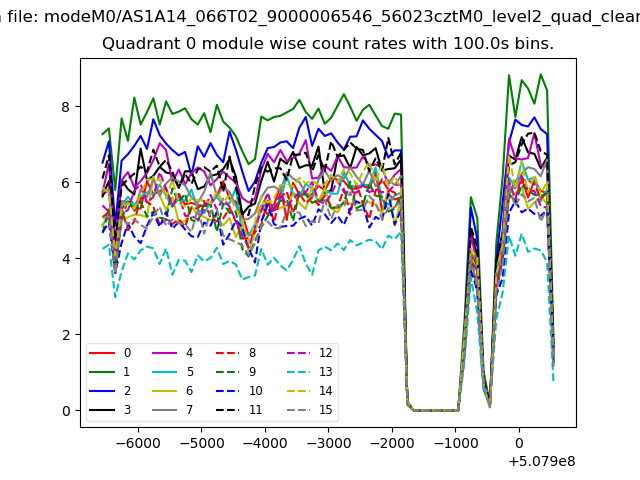 |
 |
| Module-wise count rates for Quadrant B Data is divided into 100 sec bins |
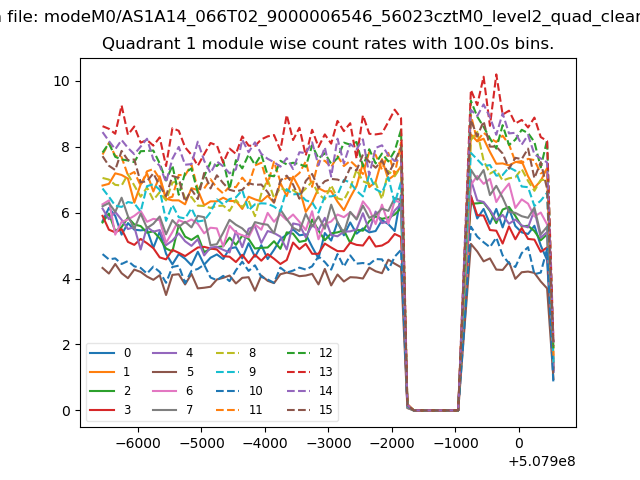 |
 |
| Module-wise count rates for Quadrant C Data is divided into 100 sec bins |
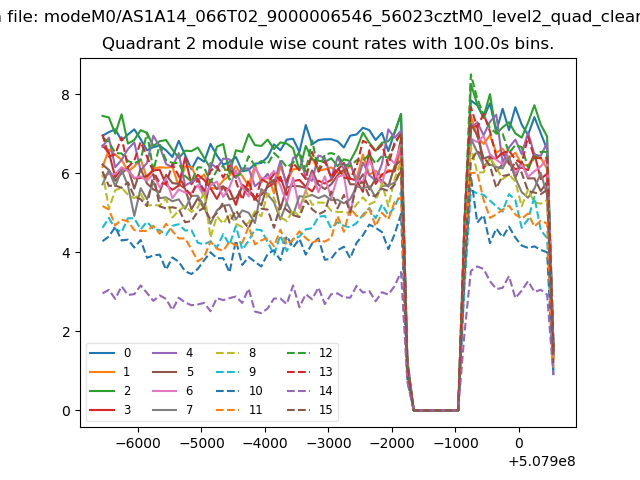 |
 |
| Module-wise count rates for Quadrant D Data is divided into 100 sec bins |
 |
 |
| Parameter | Plot |
|---|---|
| CZT HV Monitor | 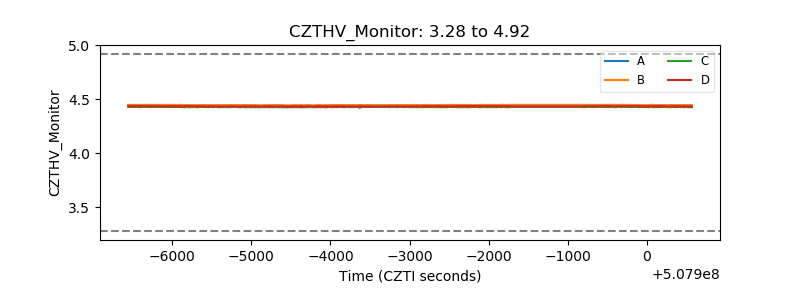 |
| D_VDD |  |
| Temperature 1 |  |
| Veto HV Monitor |  |
| Veto LLD | 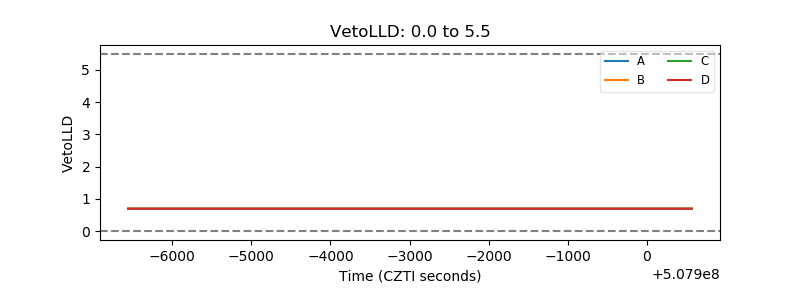 |
| Alpha Counter | 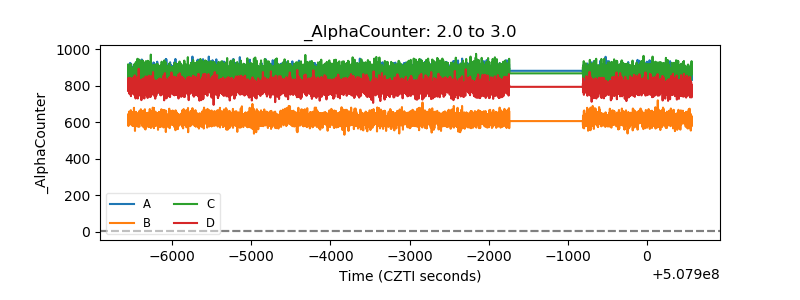 |
| _CPM_Rate |  |
| CZT Counter | 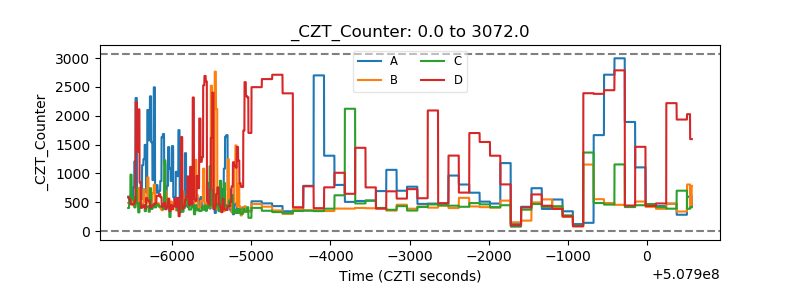 |
| +2.5 Volts monitor | 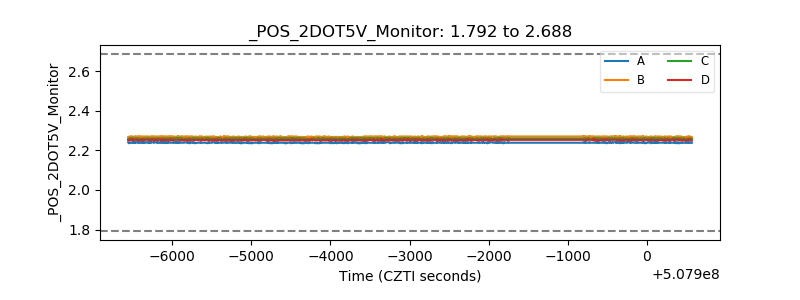 |
| +5 Volts monitor | 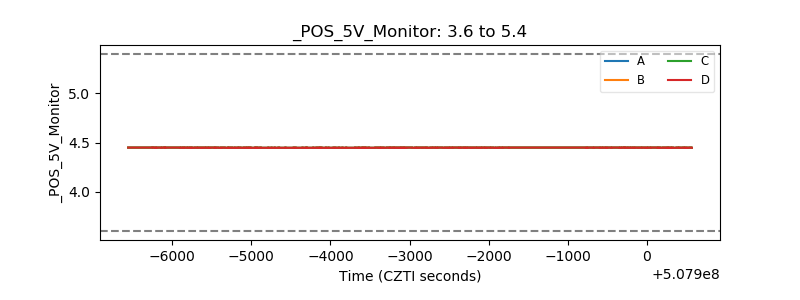 |
| _ROLL_ROT |  |
| _Roll_DEC |  |
| _Roll_RA |  |
| Veto Counter |  |