| Param | Original file | Final file |
|---|---|---|
| Filename | modeM0/AS1A14_066T02_9000006546_56025cztM0_level2.fits | modeM0/AS1A14_066T02_9000006546_56025cztM0_level2_quad_clean.evt |
| Size (bytes) | 657,800,640 | 83,203,200 |
| Size | 627.3 MB | 79.3 MB |
| Events in quadrant A | 9,539,613 | 427,469 |
| Events in quadrant B | 3,599,398 | 626,297 |
| Events in quadrant C | 3,589,265 | 561,857 |
| Events in quadrant D | 7,134,538 | 464,312 |
| Mode M9 | |||
|---|---|---|---|
| Quadrant | BADHDUFLAG | Total packets | Discarded packets |
| A | 0 | 10 | 0 |
| B | 0 | 10 | 0 |
| C | 0 | 10 | 0 |
| D | 0 | 10 | 0 |
| Mode M0 | |||
|---|---|---|---|
| Quadrant | BADHDUFLAG | Total packets | Discarded packets |
| A | 0 | 32660 | 1 |
| B | 0 | 15186 | 1 |
| C | 0 | 15233 | 5 |
| D | 0 | 25591 | 1 |
| Mode SS | |||
|---|---|---|---|
| Quadrant | BADHDUFLAG | Total packets | Discarded packets |
| A | 0 | 130 | 0 |
| B | 0 | 130 | 0 |
| C | 0 | 130 | 0 |
| D | 0 | 130 | 0 |
| Quadrant | Total seconds | Saturated seconds | Saturation percentage |
|---|---|---|---|
| A | 6282 | 2224 | 35.402738% |
| B | 6282 | 222 | 3.533906% |
| C | 6282 | 199 | 3.167781% |
| D | 6282 | 1140 | 18.147087% |
Noise dominated data is calculated using 1-second bins in cleaned event files. If a bin has >2000 counts, and if more than 50% of those come from <1% of pixels, then it is considered to be noise-dominated and hence unusable.
| Quadrant | # 1 sec bins | Bins with >0 counts | Bins with >2000 counts | High rate bins dominated by noise | Noise dominated (total time) | Noise dominated (detector-on time) | Marked lightcurve |
|---|---|---|---|---|---|---|---|
| A | 7327 | 6283 | 1937 | 1937 | 26.44% | 30.83% | 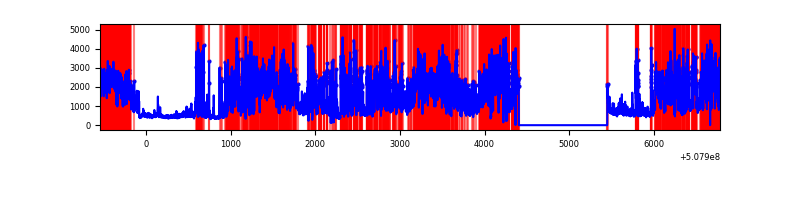 |
| B | 7327 | 6282 | 112 | 112 | 1.53% | 1.78% | 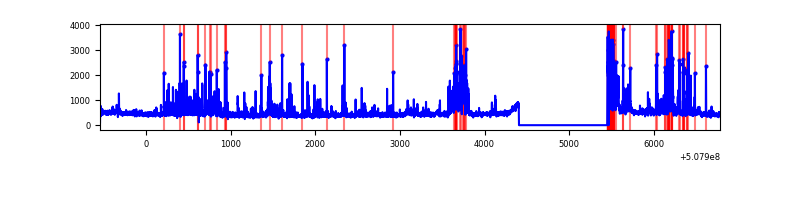 |
| C | 7327 | 6283 | 143 | 143 | 1.95% | 2.28% | 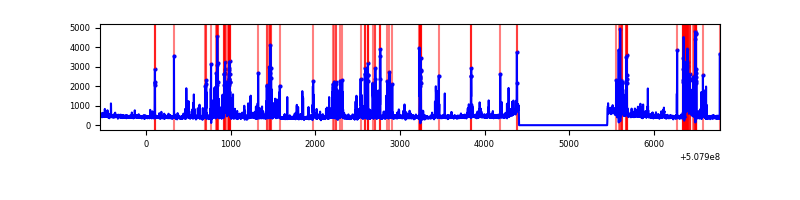 |
| D | 7327 | 6283 | 958 | 958 | 13.07% | 15.25% | 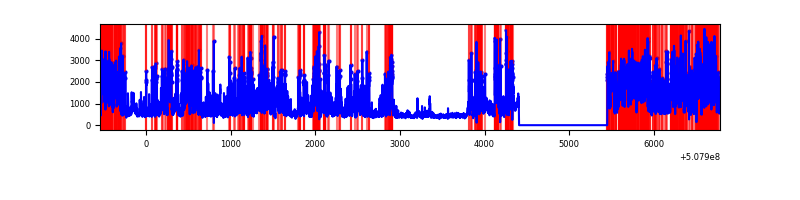 |
Top three noisy pixels from each quadrant. If the there are fewer than three noisy pixels in the level2.evt file, extra rows are filled as -1
| Pixel properties | Quadrant properties | ||||||
|---|---|---|---|---|---|---|---|
| Quadrant | DetID | PixID | Counts | Sigma | Mean | Median | Sigma |
| A | 15 | 32 | 5865298 | 41346.42 | 573 | 558 | 141.8 |
| A | 12 | 115 | 1227603 | 8650.67 | 573 | 558 | 141.8 |
| A | 0 | 8 | 117544 | 824.75 | 573 | 558 | 141.8 |
| B | 5 | 185 | 681141 | 4783.33 | 656 | 631 | 142.3 |
| B | 4 | 171 | 81678 | 569.68 | 656 | 631 | 142.3 |
| B | 10 | 247 | 75350 | 525.2 | 656 | 631 | 142.3 |
| C | 13 | 3 | 803505 | 4449.54 | 647 | 641 | 180.4 |
| C | 12 | 252 | 138893 | 766.2 | 647 | 641 | 180.4 |
| C | 9 | 237 | 55147 | 302.08 | 647 | 641 | 180.4 |
| D | 11 | 129 | 3254343 | 18869.17 | 605 | 578 | 172.4 |
| D | 6 | 239 | 660658 | 3827.92 | 605 | 578 | 172.4 |
| D | 8 | 160 | 471319 | 2729.91 | 605 | 578 | 172.4 |
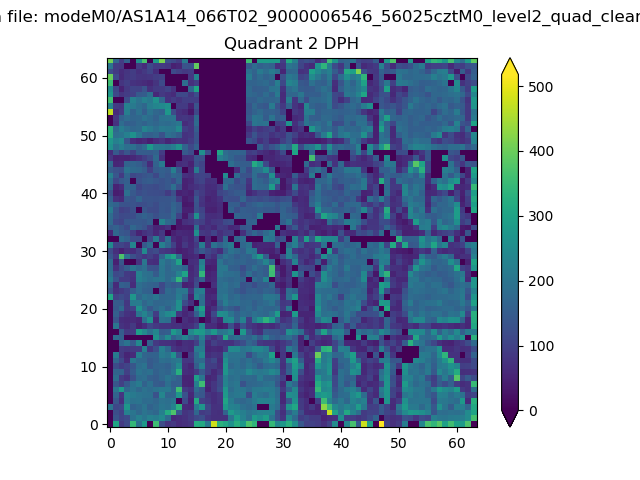
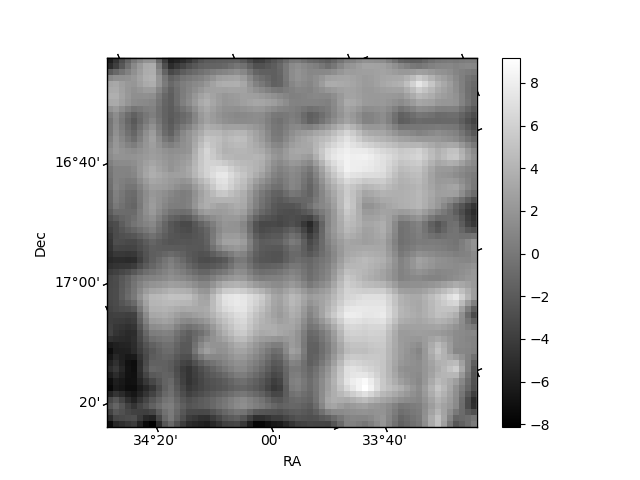
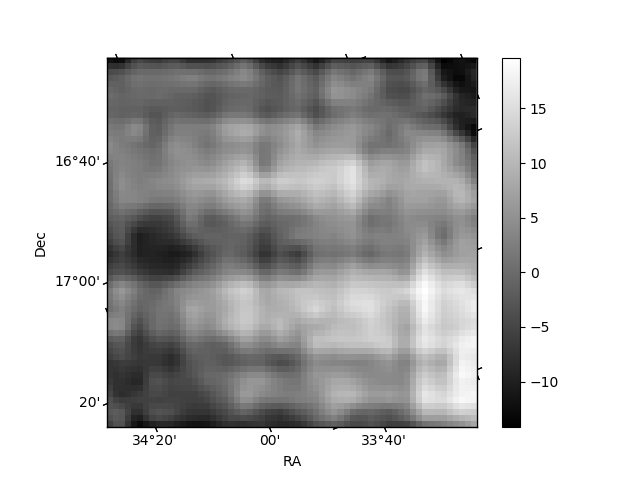
Histogram calculated using DETX and DETY for each event in the final _common_clean file
| Quadrant A | 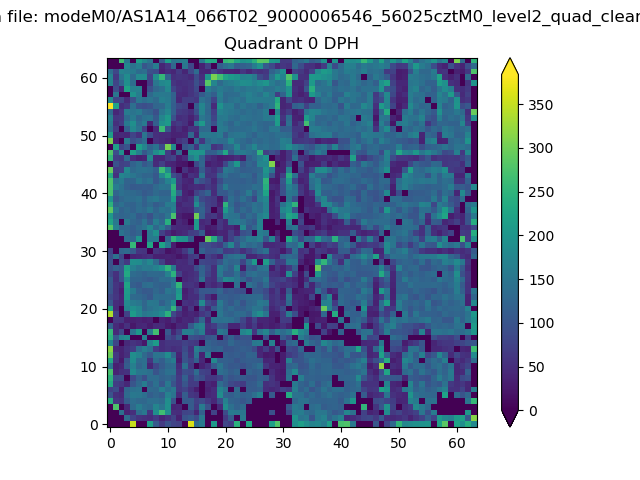 |
 |
Quadrant B |
|---|---|---|---|
| Quadrant D |  |
 |
Quadrant C |
| Plot type | Count rate plots | Images |
|---|---|---|
| Comparison with Poisson distribution Blue bars denote a histogram of data divided into 1 sec bins. Red curve is a Poisson curve with rate = median count rate of data. |
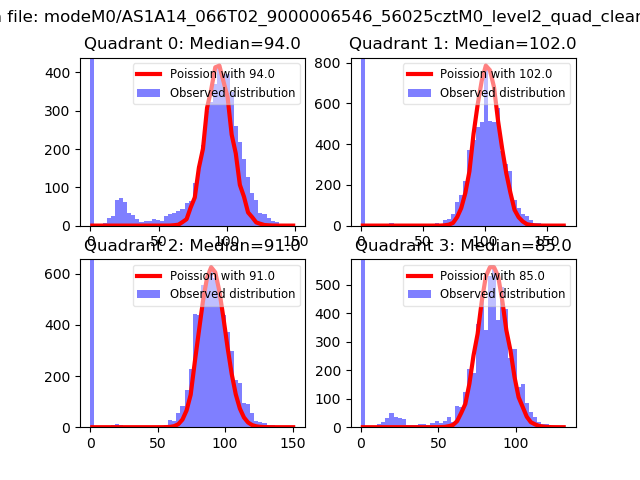 |
 |
| Quadrant-wise count rates Data is divided into 100 sec bins |
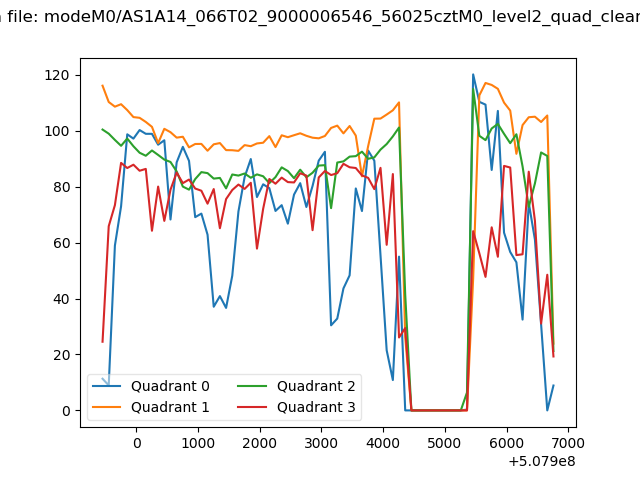 |
|
| Module-wise count rates for Quadrant A Data is divided into 100 sec bins |
 |
 |
| Module-wise count rates for Quadrant B Data is divided into 100 sec bins |
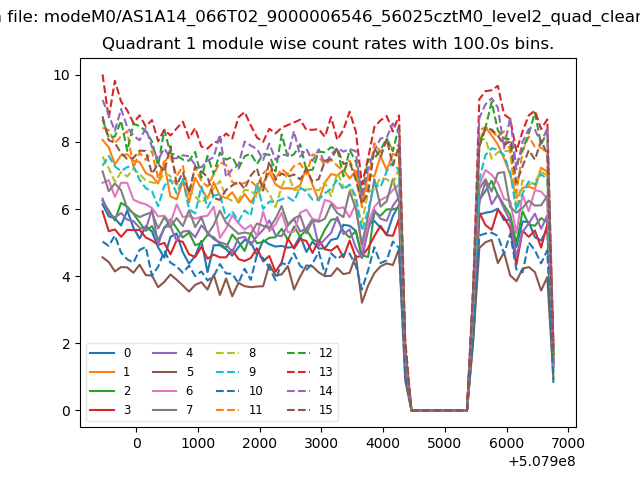 |
 |
| Module-wise count rates for Quadrant C Data is divided into 100 sec bins |
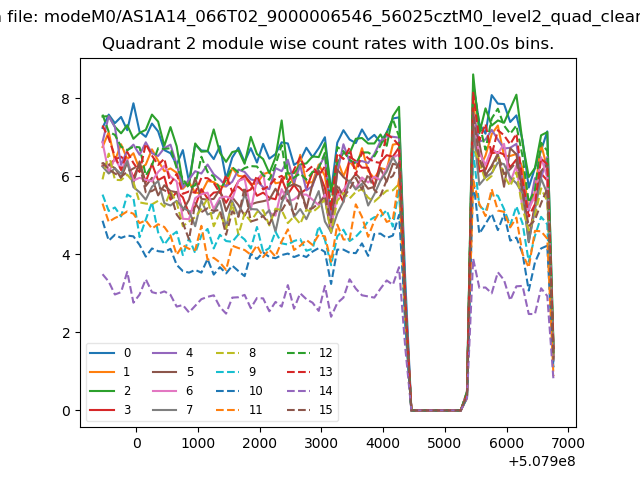 |
 |
| Module-wise count rates for Quadrant D Data is divided into 100 sec bins |
 |
 |
| Parameter | Plot |
|---|---|
| CZT HV Monitor |  |
| D_VDD | 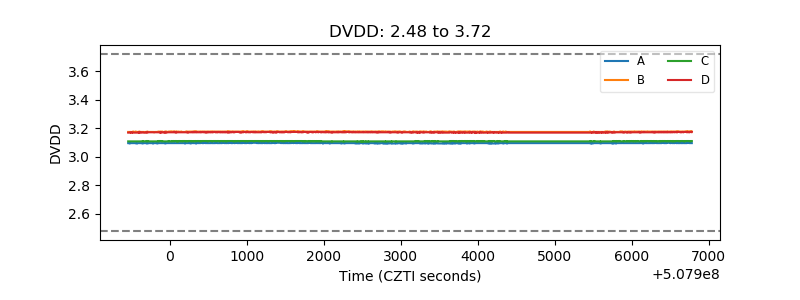 |
| Temperature 1 | 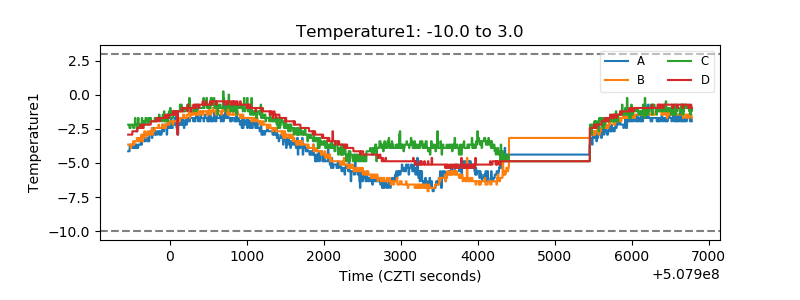 |
| Veto HV Monitor | 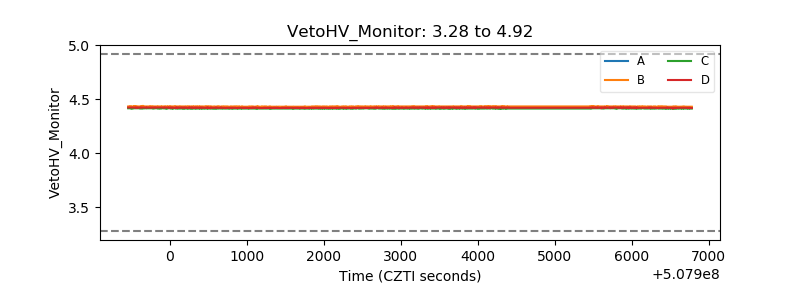 |
| Veto LLD | 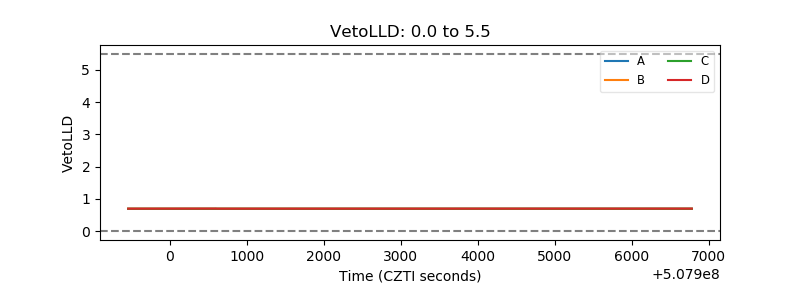 |
| Alpha Counter | 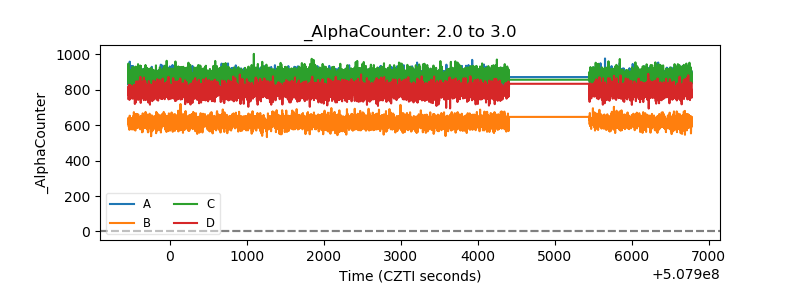 |
| _CPM_Rate |  |
| CZT Counter | 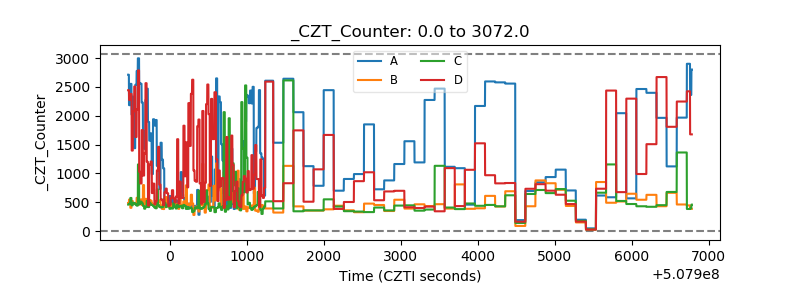 |
| +2.5 Volts monitor | 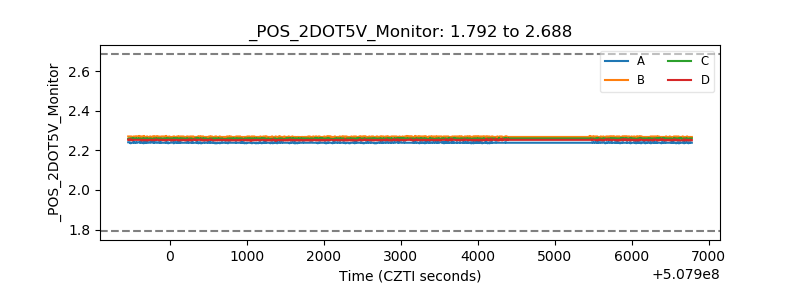 |
| +5 Volts monitor | 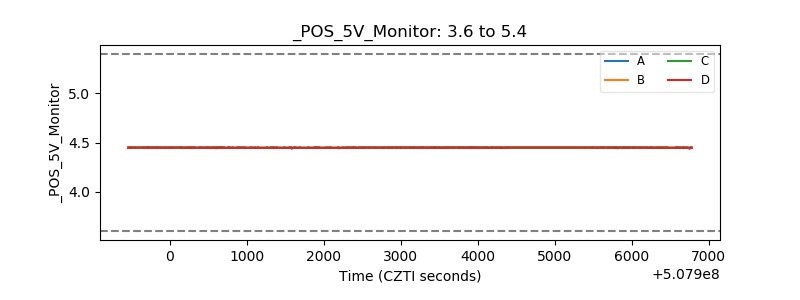 |
| _ROLL_ROT | 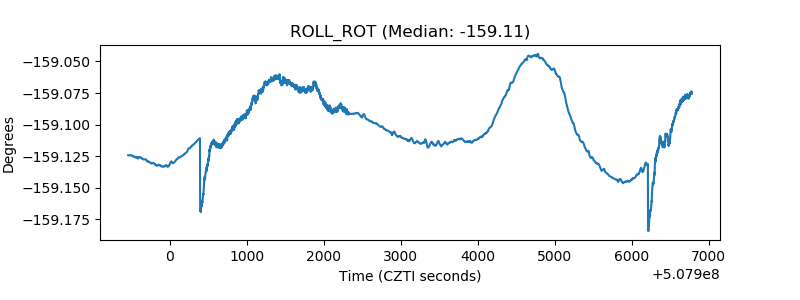 |
| _Roll_DEC | 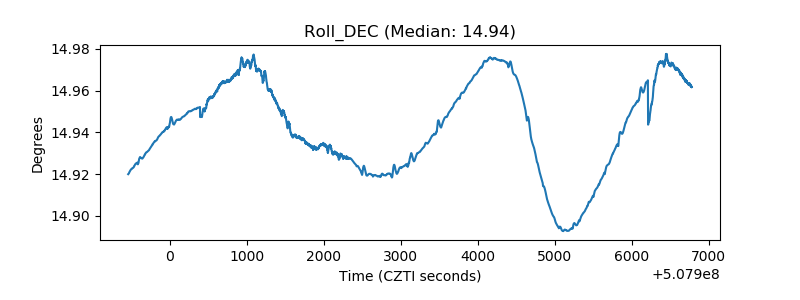 |
| _Roll_RA | 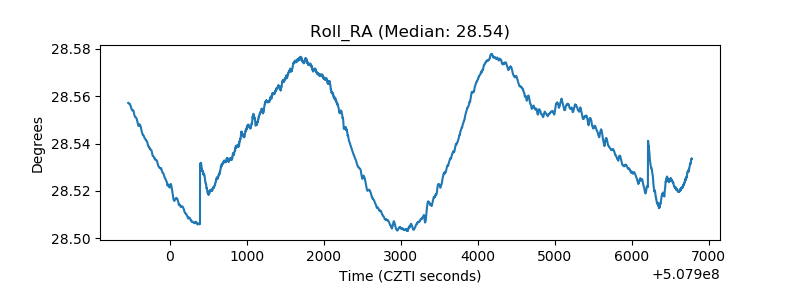 |
| Veto Counter | 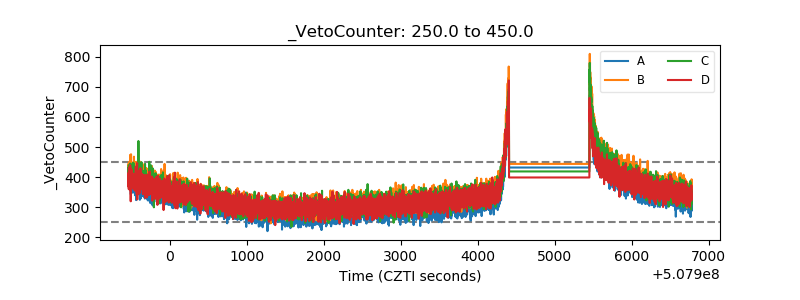 |