| Param | Original file | Final file |
|---|---|---|
| Filename | modeM0/AS1A14_066T02_9000006546_56026cztM0_level2.fits | modeM0/AS1A14_066T02_9000006546_56026cztM0_level2_quad_clean.evt |
| Size (bytes) | 733,668,480 | 80,982,720 |
| Size | 699.7 MB | 77.2 MB |
| Events in quadrant A | 9,143,611 | 465,417 |
| Events in quadrant B | 3,314,844 | 641,126 |
| Events in quadrant C | 5,283,695 | 485,787 |
| Events in quadrant D | 8,931,458 | 422,185 |
| Mode M9 | |||
|---|---|---|---|
| Quadrant | BADHDUFLAG | Total packets | Discarded packets |
| A | 0 | 11 | 0 |
| B | 0 | 11 | 0 |
| C | 0 | 11 | 0 |
| D | 0 | 11 | 0 |
| Mode M0 | |||
|---|---|---|---|
| Quadrant | BADHDUFLAG | Total packets | Discarded packets |
| A | 0 | 31530 | 6 |
| B | 0 | 14402 | 1 |
| C | 0 | 20538 | 1 |
| D | 0 | 30918 | 1 |
| Mode SS | |||
|---|---|---|---|
| Quadrant | BADHDUFLAG | Total packets | Discarded packets |
| A | 0 | 128 | 0 |
| B | 0 | 128 | 0 |
| C | 0 | 128 | 0 |
| D | 0 | 128 | 0 |
| Quadrant | Total seconds | Saturated seconds | Saturation percentage |
|---|---|---|---|
| A | 6260 | 1808 | 28.881789% |
| B | 6261 | 176 | 2.811053% |
| C | 6261 | 1007 | 16.083693% |
| D | 6261 | 1755 | 28.030666% |
Noise dominated data is calculated using 1-second bins in cleaned event files. If a bin has >2000 counts, and if more than 50% of those come from <1% of pixels, then it is considered to be noise-dominated and hence unusable.
| Quadrant | # 1 sec bins | Bins with >0 counts | Bins with >2000 counts | High rate bins dominated by noise | Noise dominated (total time) | Noise dominated (detector-on time) | Marked lightcurve |
|---|---|---|---|---|---|---|---|
| A | 7365 | 6261 | 1627 | 1627 | 22.09% | 25.99% |  |
| B | 7366 | 6262 | 67 | 67 | 0.91% | 1.07% |  |
| C | 7366 | 6262 | 863 | 863 | 11.72% | 13.78% | 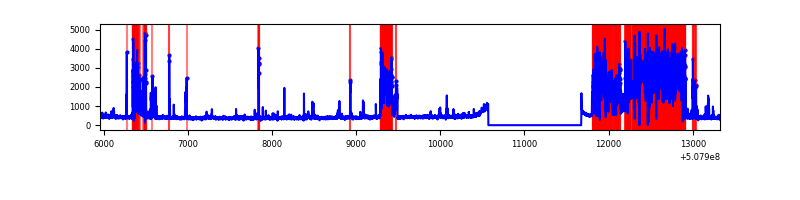 |
| D | 7366 | 6262 | 1635 | 1635 | 22.20% | 26.11% |  |
Top three noisy pixels from each quadrant. If the there are fewer than three noisy pixels in the level2.evt file, extra rows are filled as -1
| Pixel properties | Quadrant properties | ||||||
|---|---|---|---|---|---|---|---|
| Quadrant | DetID | PixID | Counts | Sigma | Mean | Median | Sigma |
| A | 15 | 32 | 5268553 | 35793.68 | 591 | 576 | 147.2 |
| A | 12 | 115 | 1377330 | 9354.46 | 591 | 576 | 147.2 |
| A | 0 | 8 | 91588 | 618.39 | 591 | 576 | 147.2 |
| B | 5 | 185 | 383518 | 2718.9 | 662 | 639 | 140.8 |
| B | 4 | 171 | 128088 | 905.04 | 662 | 639 | 140.8 |
| B | 10 | 247 | 50643 | 355.09 | 662 | 639 | 140.8 |
| C | 13 | 3 | 2852711 | 17286.02 | 593 | 587 | 165.0 |
| C | 12 | 252 | 45719 | 273.53 | 593 | 587 | 165.0 |
| C | 12 | 249 | 31309 | 186.2 | 593 | 587 | 165.0 |
| D | 11 | 129 | 4004301 | 24220.61 | 579 | 554 | 165.3 |
| D | 6 | 239 | 1068772 | 6462.17 | 579 | 554 | 165.3 |
| D | 2 | 62 | 857073 | 5181.5 | 579 | 554 | 165.3 |
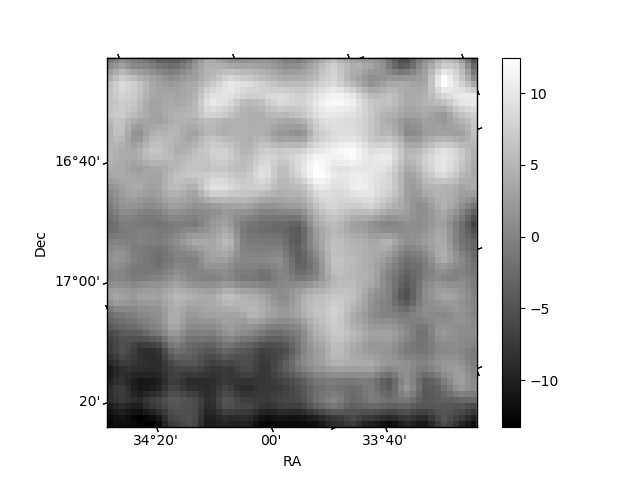
Histogram calculated using DETX and DETY for each event in the final _common_clean file
| Quadrant A | 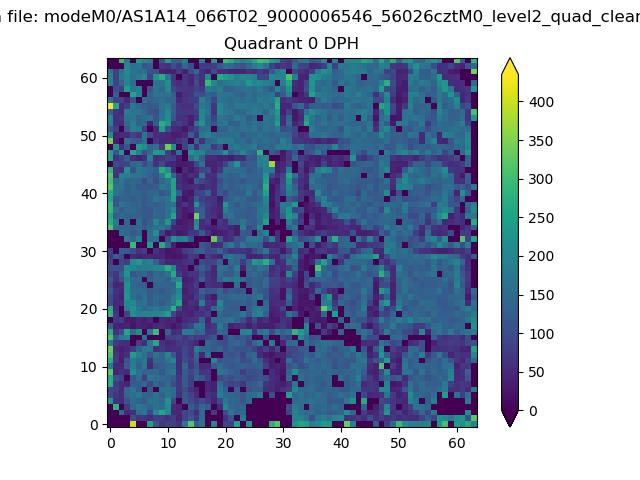 |
 |
Quadrant B |
|---|---|---|---|
| Quadrant D | 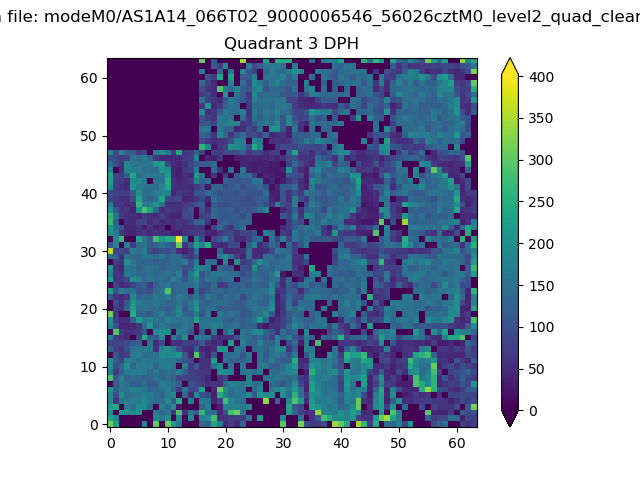 |
 |
Quadrant C |
| Plot type | Count rate plots | Images |
|---|---|---|
| Comparison with Poisson distribution Blue bars denote a histogram of data divided into 1 sec bins. Red curve is a Poisson curve with rate = median count rate of data. |
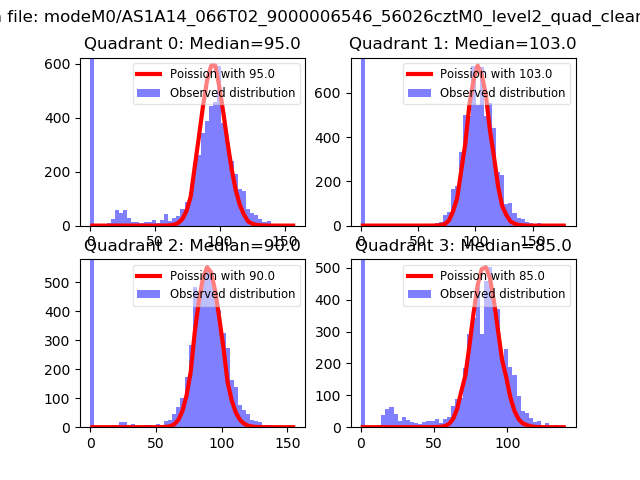 |
 |
| Quadrant-wise count rates Data is divided into 100 sec bins |
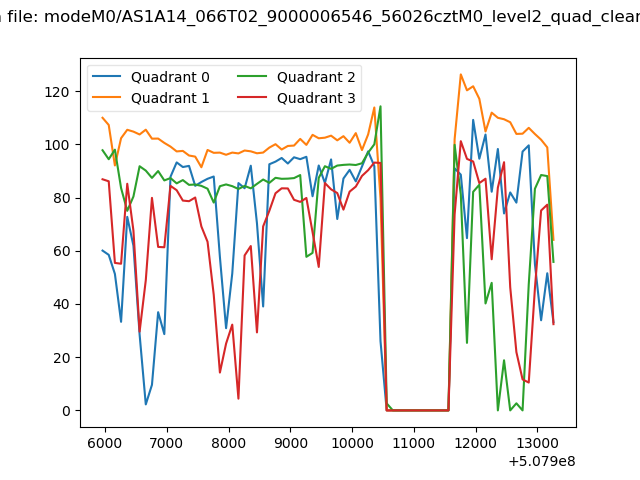 |
|
| Module-wise count rates for Quadrant A Data is divided into 100 sec bins |
 |
 |
| Module-wise count rates for Quadrant B Data is divided into 100 sec bins |
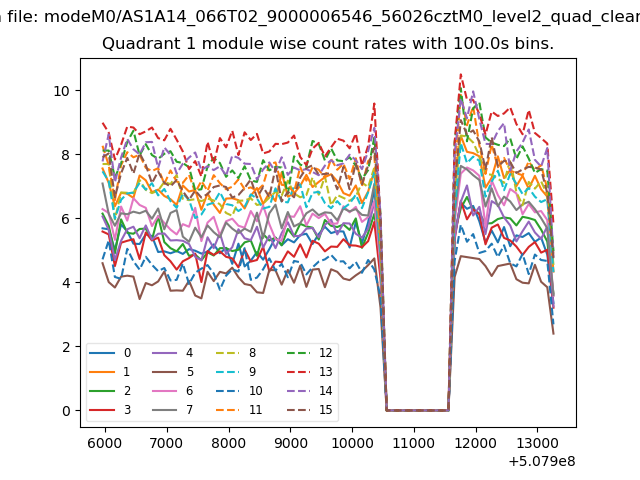 |
 |
| Module-wise count rates for Quadrant C Data is divided into 100 sec bins |
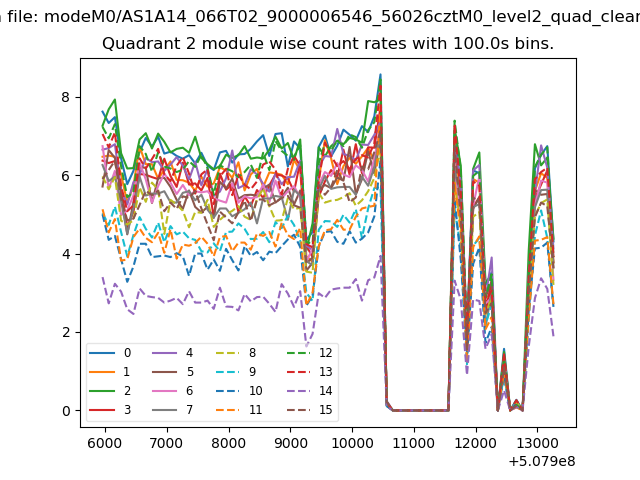 |
 |
| Module-wise count rates for Quadrant D Data is divided into 100 sec bins |
 |
 |
| Parameter | Plot |
|---|---|
| CZT HV Monitor | 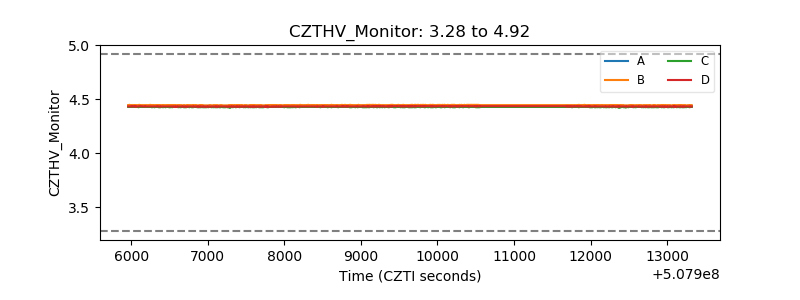 |
| D_VDD |  |
| Temperature 1 |  |
| Veto HV Monitor |  |
| Veto LLD | 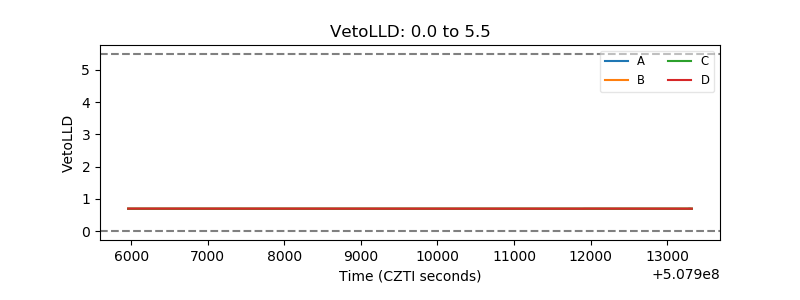 |
| Alpha Counter | 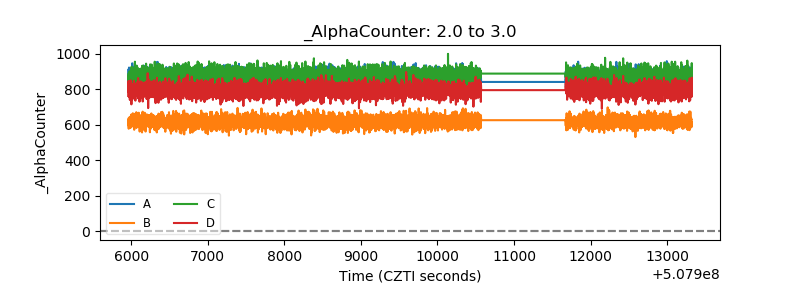 |
| _CPM_Rate |  |
| CZT Counter | 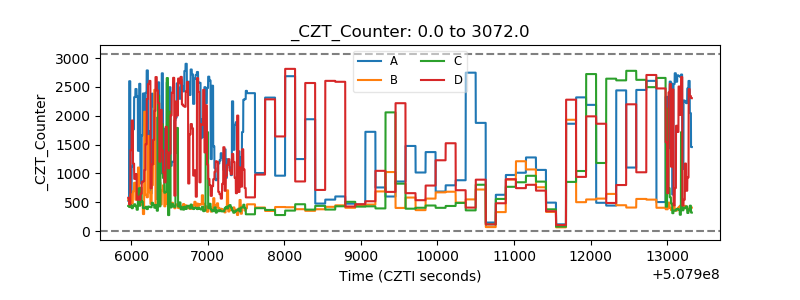 |
| +2.5 Volts monitor | 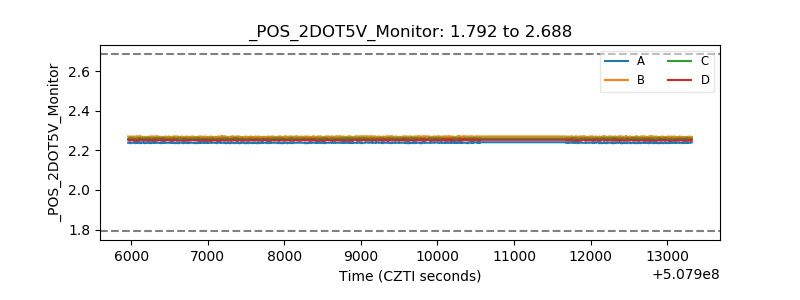 |
| +5 Volts monitor | 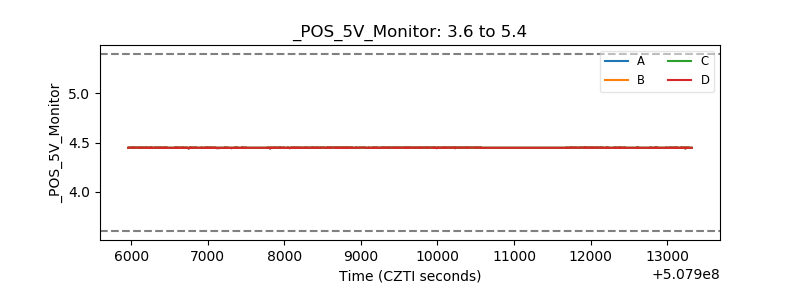 |
| _ROLL_ROT |  |
| _Roll_DEC |  |
| _Roll_RA |  |
| Veto Counter |  |