| Param | Original file | Final file |
|---|---|---|
| Filename | modeM0/AS1A14_066T02_9000006546_56027cztM0_level2.fits | modeM0/AS1A14_066T02_9000006546_56027cztM0_level2_quad_clean.evt |
| Size (bytes) | 803,154,240 | 69,652,800 |
| Size | 765.9 MB | 66.4 MB |
| Events in quadrant A | 8,344,470 | 450,217 |
| Events in quadrant B | 3,119,911 | 623,596 |
| Events in quadrant C | 10,358,954 | 165,924 |
| Events in quadrant D | 7,438,591 | 447,438 |
| Mode M9 | |||
|---|---|---|---|
| Quadrant | BADHDUFLAG | Total packets | Discarded packets |
| A | 0 | 12 | 0 |
| B | 0 | 12 | 0 |
| C | 0 | 12 | 0 |
| D | 0 | 12 | 0 |
| Mode M0 | |||
|---|---|---|---|
| Quadrant | BADHDUFLAG | Total packets | Discarded packets |
| A | 0 | 28938 | 1 |
| B | 0 | 13648 | 1 |
| C | 0 | 35089 | 3 |
| D | 0 | 26289 | 1 |
| Mode SS | |||
|---|---|---|---|
| Quadrant | BADHDUFLAG | Total packets | Discarded packets |
| A | 0 | 122 | 0 |
| B | 0 | 122 | 0 |
| C | 0 | 122 | 0 |
| D | 0 | 122 | 0 |
| Quadrant | Total seconds | Saturated seconds | Saturation percentage |
|---|---|---|---|
| A | 6037 | 1712 | 28.358456% |
| B | 6037 | 145 | 2.401855% |
| C | 6036 | 4370 | 72.398940% |
| D | 6036 | 1169 | 19.367131% |
Noise dominated data is calculated using 1-second bins in cleaned event files. If a bin has >2000 counts, and if more than 50% of those come from <1% of pixels, then it is considered to be noise-dominated and hence unusable.
| Quadrant | # 1 sec bins | Bins with >0 counts | Bins with >2000 counts | High rate bins dominated by noise | Noise dominated (total time) | Noise dominated (detector-on time) | Marked lightcurve |
|---|---|---|---|---|---|---|---|
| A | 7192 | 6038 | 1629 | 1629 | 22.65% | 26.98% | 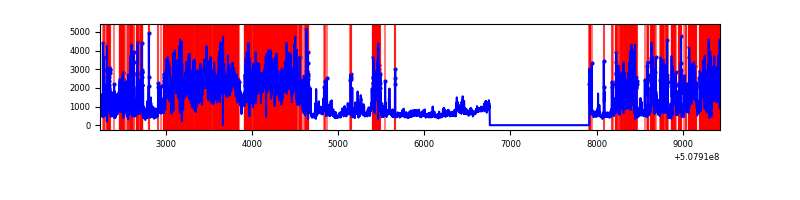 |
| B | 7192 | 6038 | 37 | 37 | 0.51% | 0.61% | 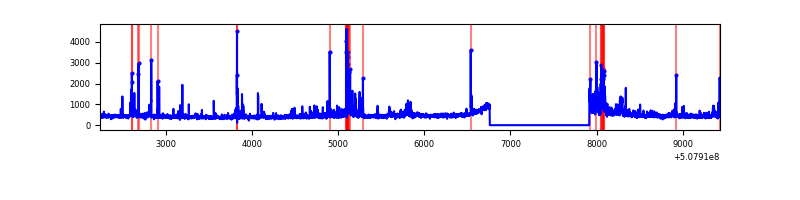 |
| C | 7190 | 6032 | 2461 | 2461 | 34.23% | 40.80% | 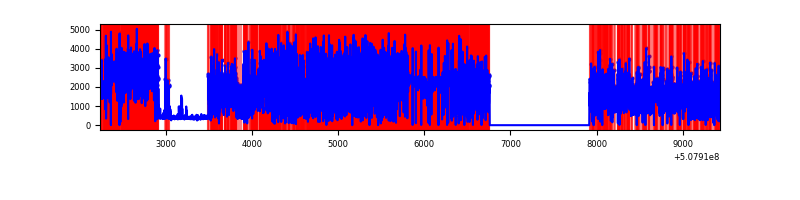 |
| D | 7191 | 6037 | 1088 | 1088 | 15.13% | 18.02% | 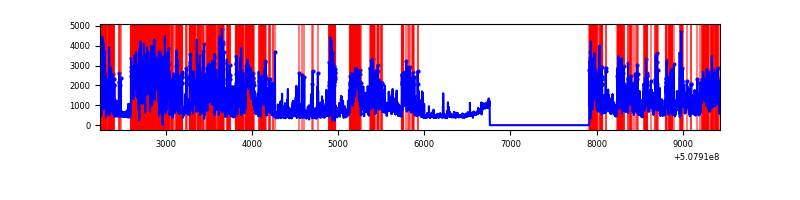 |
Top three noisy pixels from each quadrant. If the there are fewer than three noisy pixels in the level2.evt file, extra rows are filled as -1
| Pixel properties | Quadrant properties | ||||||
|---|---|---|---|---|---|---|---|
| Quadrant | DetID | PixID | Counts | Sigma | Mean | Median | Sigma |
| A | 15 | 32 | 3808456 | 26037.59 | 585 | 573 | 146.2 |
| A | 12 | 115 | 2045673 | 13984.01 | 585 | 573 | 146.2 |
| A | 0 | 8 | 100187 | 681.14 | 585 | 573 | 146.2 |
| B | 5 | 185 | 146033 | 1053.93 | 643 | 620 | 138.0 |
| B | 4 | 171 | 119866 | 864.28 | 643 | 620 | 138.0 |
| B | 0 | 213 | 77750 | 559.03 | 643 | 620 | 138.0 |
| C | 13 | 3 | 9174254 | 113964.22 | 286 | 283 | 80.5 |
| C | 12 | 252 | 34507 | 425.15 | 286 | 283 | 80.5 |
| C | 9 | 38 | 9102 | 109.55 | 286 | 283 | 80.5 |
| D | 11 | 129 | 4180433 | 24877.02 | 585 | 561 | 168.0 |
| D | 6 | 239 | 400234 | 2378.7 | 585 | 561 | 168.0 |
| D | 2 | 62 | 268065 | 1592.08 | 585 | 561 | 168.0 |
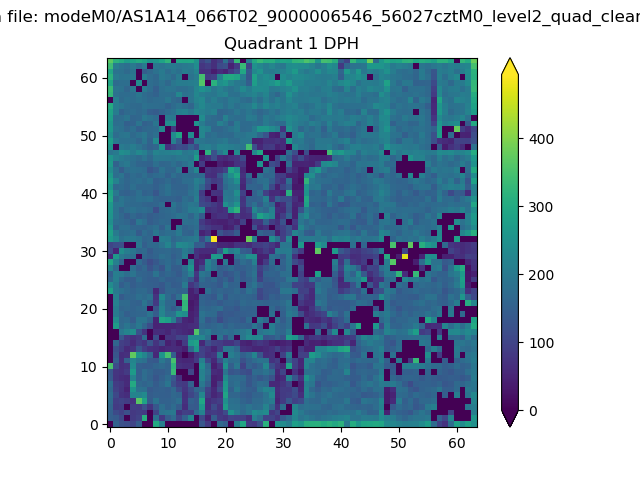
Histogram calculated using DETX and DETY for each event in the final _common_clean file
| Quadrant A |  |
 |
Quadrant B |
|---|---|---|---|
| Quadrant D |  |
 |
Quadrant C |
| Plot type | Count rate plots | Images |
|---|---|---|
| Comparison with Poisson distribution Blue bars denote a histogram of data divided into 1 sec bins. Red curve is a Poisson curve with rate = median count rate of data. |
 |
 |
| Quadrant-wise count rates Data is divided into 100 sec bins |
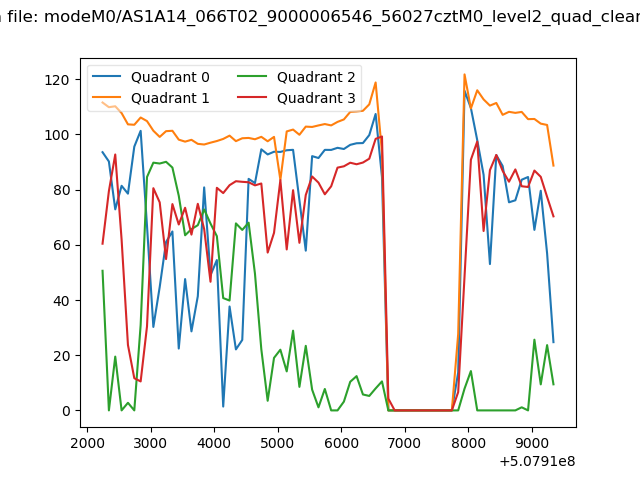 |
|
| Module-wise count rates for Quadrant A Data is divided into 100 sec bins |
 |
 |
| Module-wise count rates for Quadrant B Data is divided into 100 sec bins |
 |
 |
| Module-wise count rates for Quadrant C Data is divided into 100 sec bins |
 |
 |
| Module-wise count rates for Quadrant D Data is divided into 100 sec bins |
 |
 |
| Parameter | Plot |
|---|---|
| CZT HV Monitor |  |
| D_VDD | 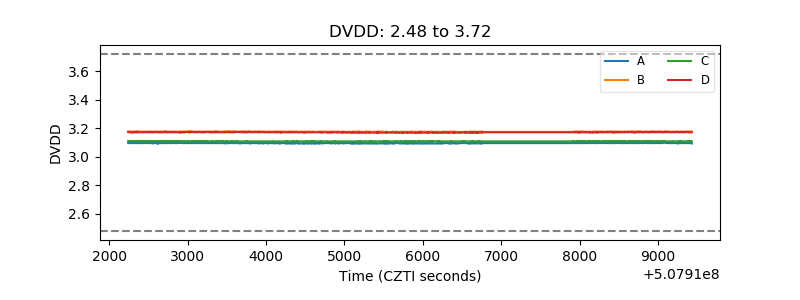 |
| Temperature 1 | 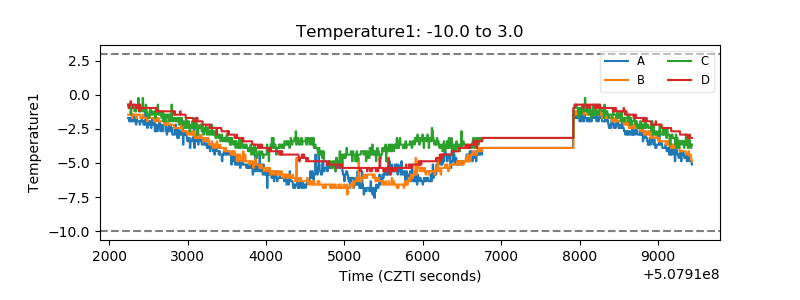 |
| Veto HV Monitor |  |
| Veto LLD |  |
| Alpha Counter |  |
| _CPM_Rate |  |
| CZT Counter | 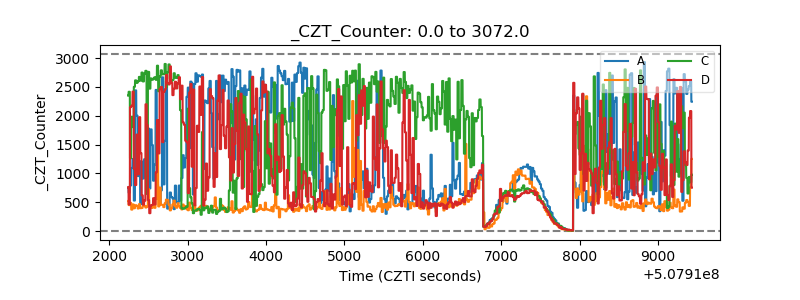 |
| +2.5 Volts monitor | 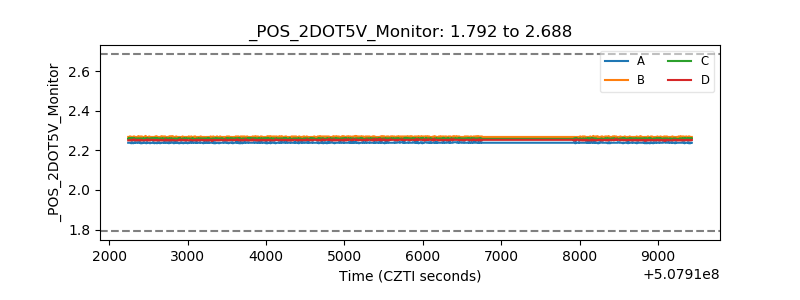 |
| +5 Volts monitor | 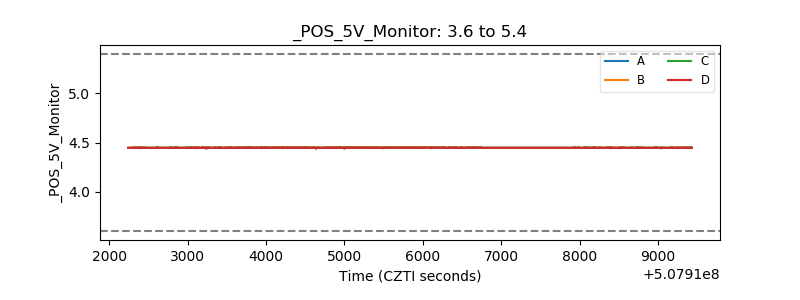 |
| _ROLL_ROT |  |
| _Roll_DEC |  |
| _Roll_RA | 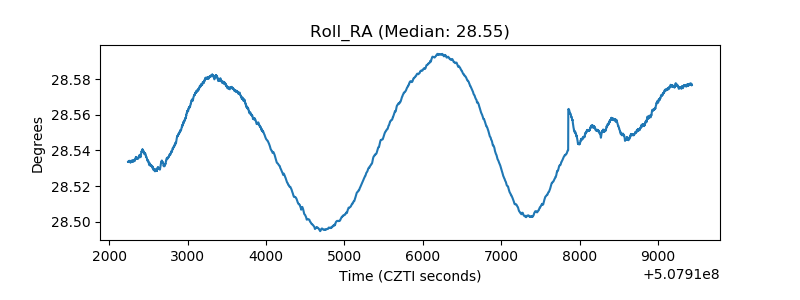 |
| Veto Counter |  |